. 2020 Oct 20;23(11):101700.
doi: 10.1016/j.isci.2020.101700. eCollection 2020 Nov 20.

Ubiquitin Homeostasis Is Disrupted in TDP-43 and FUS Cell Models of ALS

Affiliations

Ubiquitin Homeostasis Is Disrupted in TDP-43 and FUS Cell Models of ALS

Natalie E Farrawell et al. iScience. .

Abstract

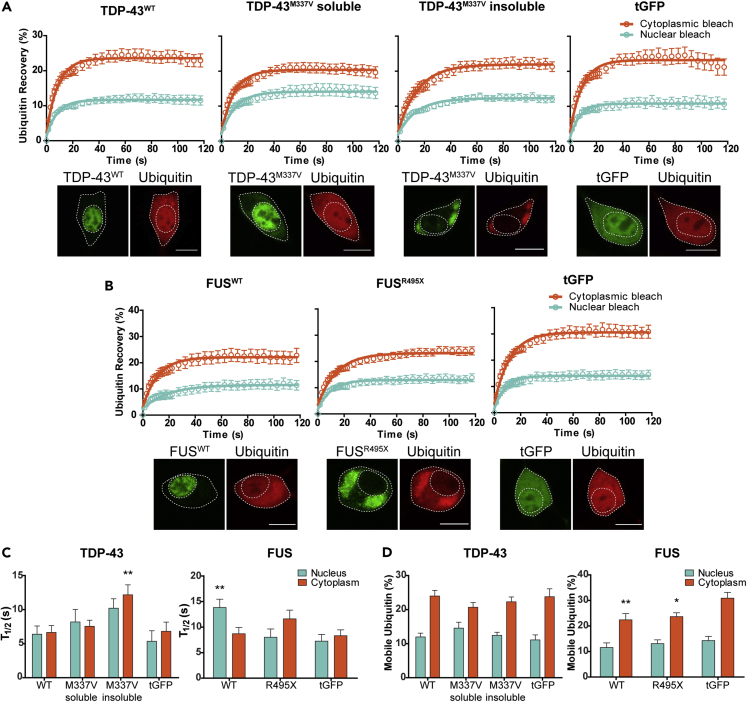
A major feature of amyotrophic lateral sclerosis (ALS) pathology is the accumulation of ubiquitin (Ub) into intracellular inclusions. This sequestration of Ub may reduce the availability of free Ub, disrupting Ub homeostasis and ultimately compromising cellular function and survival. We previously reported significant disturbance of Ub homeostasis in neuronal-like cells expressing mutant SOD1. Here, we show that Ub homeostasis is also perturbed in neuronal-like cells expressing either TDP-43 or FUS. The expression of mutant TDP-43 and mutant FUS led to UPS dysfunction, which was associated with a redistribution of Ub and depletion of the free Ub pool. Redistribution of Ub is also a feature of sporadic ALS, with an increase in Ub signal associated with inclusions and no compensatory increase in Ub expression. Together, these findings suggest that alterations to Ub homeostasis caused by the misfolding and aggregation of ALS-associated proteins play an important role in the pathogenesis of ALS.

Keywords: Molecular Biology; Neuroscience; Protein Folding.


Conflict of interest statement

The authors declare no competing interests.

Figures

None
Graphical abstract
Figure 1
Figure 1
TDP-43 and FUS Aggregates Contain K48 and K63-Linked Ubiquitin Chains NSC-34 cells transfected with mutant TDP-43-GFP (A) or mutant FUS-GFP (B) were fixed, permeabilized, and stained for UbK48 and UbK63 polymers 48 h post transfection. The mean fluorescence intensity of UbK48 and UbK63 associated with soluble and insoluble TDP-43M337V (C) or FUSR495X (D) was quantified using ImageJ. Data shown are mean ± SD (n = 17 TDP-43/UbK48, n = 25 TDP-43/UbK63, n = 19 FUS/UbK48, n = 25 FUS/UbK63) and statistical significance between groups was determined using an unpaired Student's t test (∗∗∗∗p < 0.0001). Scale bars represent 10 μm.
Figure 2
Figure 2
ALS Mutant TDP-43 and ALS Mutant FUS Alter UPS Activity in Living Cells Dose-dependent response of UPS activity (tdTomatoCL1 fluorescence) in NSC-34 cells co-transfected with TDP-43-GFP (A) or FUS-GFP (B) after overnight treatment (18 h) with the proteasome inhibitor, MG132. Data represent mean tdTomatoCL1 fluorescence ±SEM (n = 3) ∗p < 0.05, ∗∗∗p < 0.001 indicate significant difference to WT (two-way ANOVA with Bonferroni post-test). See also Figure S1.
Figure 3
Figure 3
Ubiquitin Distribution Is Altered in Cells Expressing ALS Mutants of TDP-43 and FUS (A−C) NSC-34 cells co-transfected with TDP-43-GFP (A) or FUS-GFP (B) and mCherry-Ub were photobleached in either the nucleus or cytoplasm and recovery of Ub fluorescence was monitored for 120 s. Data shown are means ± SEM (n ≥ 9, combined from three independent experiments). Scale bars represent 10 μm. (C) The mean half-life of mCherry-Ub recovery (T1/2) was measured in both the nucleus and cytoplasm of NSC-34 cells co-transfected with either TDP-43-GFP or FUS-GFP. Data shown are means ± SEM combined from three independent experiments (n ≥ 9). Two-way ANOVA with Bonferroni post-test was used to compare differences to the tGFP control (∗∗p ˂ 0.01). (D) Quantification of the proportion of mobile Ub in the nucleus and cytoplasm of cells expressing either TDP-43-GFP or FUS-GFP. Data shown are means ± SEM combined from three independent experiments (n ≥ 9). ∗p ˂ 0.05, ∗∗p ˂ 0.01 indicate significant difference to tGFP control (two-way ANOVA with Bonferroni post-test). See also Figure S2.
Figure 4
Figure 4
Reduced Levels of Free Monomeric Ubiquitin in NSC-34 Cells Expressing Mutant TDP-43 and Mutant FUS (A and B) The entire nucleus of NSC-34 cells co-expressing TDP-43-GFP (A) or FUS-GFP (B) and mCherry-Ub was photobleached, and the recovery of nuclear Ub was monitored as a proportion of cytoplasmic fluorescence for 120 s. Data represent mean ± SEM (n ≥ 10 TDP-43, n ≥ 12 FUS, combined from three independent experiments). Scale bars, 10 μm. (C) The percentage of mobile Ub in the nucleus at the final read was quantified as a proportion of cytoplasmic fluorescence. Data represent mean ± SEM (n ≥ 10 TDP-43, n ≥ 12 FUS, combined from three independent experiments). One-way ANOVA with a Tukey's multiple comparison post-test was used to determine statistical significance compared with tGFP control (∗∗p ˂ 0.01). See also Figure S4.
Figure 5
Figure 5
Free Ubiquitin Staining in NSC-34 Cells Expressing TDP-43 and FUS (A) NSC-34 cells transfected with TDP-43-GFP or FUS-GFP were fixed, permeabilized, and stained for free Ub using the free Ub sensor tUI-HA 48 h post-transfection. Scale bars, 20 μm. (B) Violin plots of tUI-HA fluorescence in cells expressing either TDP-43-GFP or FUS-GFP calculated from high-throughput image analysis using CellProfiler. Data shown are median, 25th and 75th quartiles with the width of the plot indicating frequency (n = 139 TDP-43WT, n = 253 TDP-43M337V, n = 273 FUSWT, n = 335 FUSR495X). Statistical significance between populations was determined using a Mann-Whitney U test. (C) Cells expressing TDP-43M337V-GFP were further divided into soluble and insoluble populations via manual segregation, and mean tUI-HA fluorescence was measured in ImageJ. Data are shown as a violin plot with median, 25th-75th quartile and overall data range (n = 250 TDP-43WT, n = 221 TDP-43M337Vsoluble, n = 27 TDP-43M337V, insoluble). Statistical significance was determined using Kruskal-Wallis test (∗p < 0.05, ∗∗p < 0.01). See also Figure S5.
Figure 6
Figure 6
Ubiquitin Homeostasis in sALS (A) Human ALS postmortem tissue was stained for both TDP-43 and Ub. Inclusions were imaged across two cases of sALS. Representative images of motor neurons with the absence or presence of large skeins that colocalize to Ub staining are shown. Scale bar, 10 μm. (B) The mean fluorescence intensity of Ub associated with soluble and insoluble TDP-43 was quantified using ImageJ. Data shown are mean ± SD (n = 3) and statistical significance was determined using an unpaired Student's t test (∗∗∗∗p < 0.0001). (C) Relative levels of Ub gene expression that were detected in microdissected ventral horn ALS spinal tissue (from D'Erchia et al., 2017). (D) Waterfall plot of relative expression or fold change of genes in the UPS and autophagy KEGG pathways. Representative genes from three different regions are displayed. (E) Key processes contributing to free Ub homeostasis and the difference in these processes in ALS compared with control. See also Figure S6, Tables S1 and S2.

References

    1. Arai T., Hasegawa M., Akiyama H., Ikeda K., Nonaka T., Mori H., Mann D., Tsuchiya K., Yoshida M., Hashizume Y., Oda T. TDP-43 is a component of ubiquitin-positive tau-negative inclusions in frontotemporal lobar degeneration and amyotrophic lateral sclerosis. Biochem. Biophys. Res. Commun. 2006;351:602–611. - PubMed
    1. Axelrod D., Koppel D.E., Schlessinger J., Elson E., Webb W.W. Mobility measurement by analysis of fluorescence photobleaching recovery kinetics. Biophys. J. 1976;16:1055–1069. - PMC - PubMed
    1. Baskaran P., Shaw C., Guthrie S. TDP-43 causes neurotoxicity and cytoskeletal dysfunction in primary cortical neurons. PLoS One. 2018;13:e0196528. - PMC - PubMed
    1. Bax M., Mckenna J., Do-Ha D., Stevens C.H., Higginbottom S., Balez R., Cabral-Da-Silva M.E.C., Farrawell N.E., Engel M., Poronnik P. The ubiquitin proteasome system is a key regulator of pluripotent stem cell survival and motor neuron differentiation. Cells. 2019;8:581. - PMC - PubMed
    1. Becker L.A., Huang B., Bieri G., Ma R., Knowles D.A., Jafar-Nejad P., Messing J., Kim H.J., Soriano A., Auburger G. Therapeutic reduction of ataxin-2 extends lifespan and reduces pathology in TDP-43 mice. Nature. 2017;544:367–371. - PMC - PubMed

LinkOut - more resources