. 2020;1(1):47.
doi: 10.1038/s43247-020-00044-z. Epub 2020 Nov 12.

More meteorological events that drive compound coastal flooding are projected under climate change

Affiliations

More meteorological events that drive compound coastal flooding are projected under climate change

Emanuele Bevacqua et al. Commun Earth Environ. 2020.

Abstract

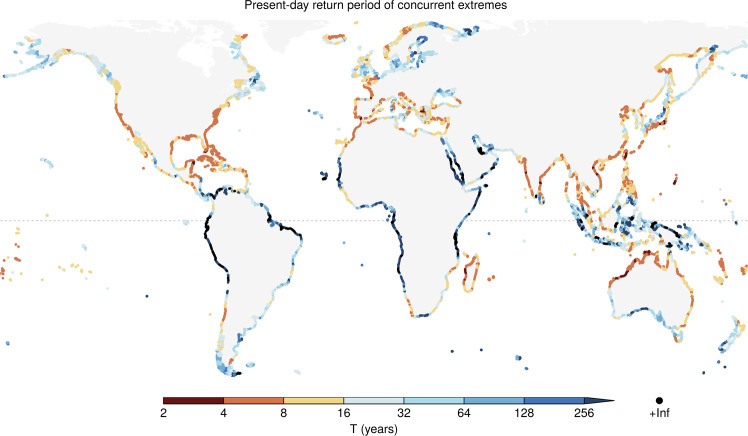
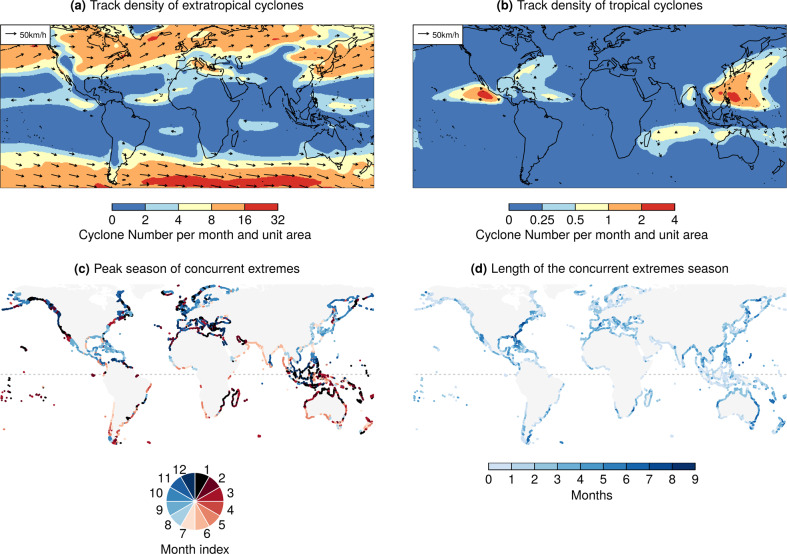
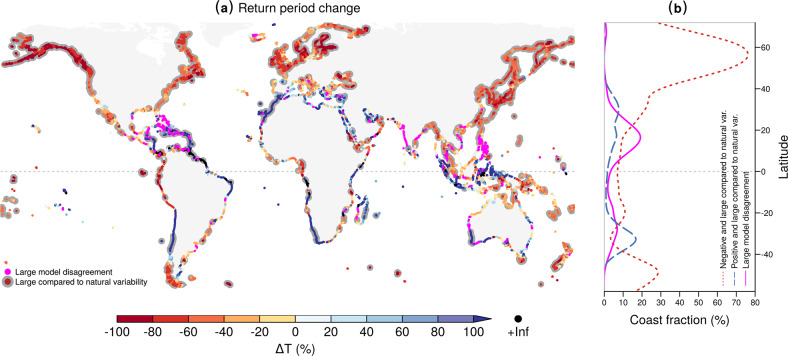
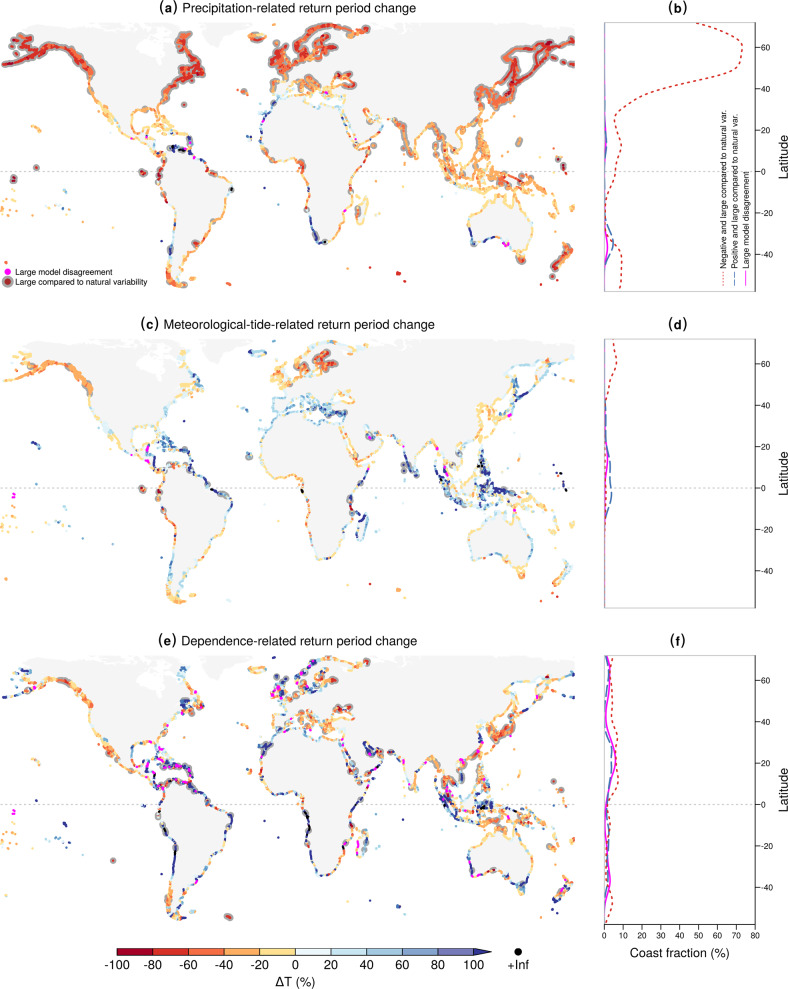
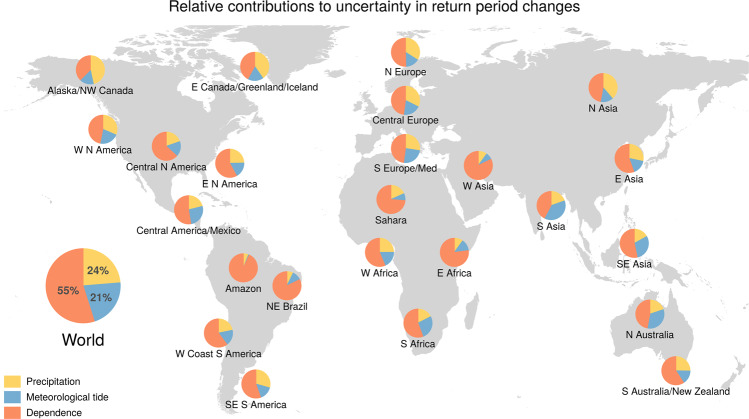
Compound flooding arises from storms causing concurrent extreme meteorological tides (that is the superposition of storm surge and waves) and precipitation. This flooding can severely affect densely populated low-lying coastal areas. Here, combining output from climate and ocean models, we analyse the concurrence probability of the meteorological conditions driving compound flooding. We show that, under a high emissions scenario, the concurrence probability would increase globally by more than 25% by 2100 compared to present. In latitudes above 40o north, compound flooding could become more than 2.5 times as frequent, in contrast to parts of the subtropics where it would weaken. Changes in extreme precipitation and meteorological tides account for most (77% and 20%, respectively) of the projected change in concurrence probability. The evolution of the dependence between precipitation and meteorological tide dominates the uncertainty in the projections. Our results indicate that not accounting for these effects in adaptation planning could leave coastal communities insufficiently protected against flooding.

Keywords: Atmospheric science; Hydrology; Natural hazards; Physical oceanography; Projection and prediction.


Conflict of interest statement

Competing interestsThe authors declare no competing interests.

Figures

Fig. 1
Fig. 1. Present-day return period of concurrent extremes in precipitation and meteorological tide.
Return period (or inverse probability) of co-occurring extremes based on the ERA-Interim data (1980–2014).
Fig. 2
Fig. 2. Drivers and seasonality of present-day concurrent extremes in precipitation and meteorological tide.
Track density of a extratropical cyclones from ERA-Interim and b tropical cyclones from IBTrACS (see “Methods” section). Values express the number of cyclones per month per unit area (equivalent to a 5o spherical cap). Arrows show the mean translation speed of cyclones. c The month with the highest concurrence of extremes and d length of the concurrence season, based on ERA-Interim. The length of the concurrence season was defined as the shortest possible period within which 90% (range defined by the 5–95th percentiles) of concurrent extremes were observed. In c-d, extremes are defined based on the 99.5th percentiles.
Fig. 3
Fig. 3. Future changes in the return periods of concurrent meteorological drivers of compound flooding.
a Ensemble median projected change (%) of joint return period (or inverse probability) between future (2070–2099) and baseline (1970–2004) climate. Dots with a grey background indicate locations where the projected change is robust, i.e. the ensemble median change lies outside the present-day 95% confidence interval and at least five out of six models agree on the sign of the change. Magenta indicates locations with high model disagreement, i.e. where at least two models project large (lying outside the present-day 95% confidence interval) positive trends and at least two models project large negative trends. b Coastline fraction per 5o of latitude (smoothing spline) with a robust negative change (red dotted line), robust positive change (blue dashed line), and high model disagreement (magenta solid line).
Fig. 4
Fig. 4. Attribution of projected changes in joint return periods to changes in precipitation, meteorological tides, and their dependence.
a Ensemble median projected change (%) of joint return periods (or inverse probability) between future (2070–2099) and baseline (1970–2004) when only taking into account the projected changes in precipitation (ΔTprec.). b Coastline fraction per 5o of latitude (smoothing spline) with a robust negative change (red dotted line), robust positive change (blue dashed line), and high model disagreement (magenta solid line). cf Similar results as a and b, but for joint return period changes when only taking into account the projected changes in the meteorological tide (ΔTmet. tide) in c-d, and in the dependence between meteorological tide and precipitation (ΔTdep.) in e-f.
Fig. 5
Fig. 5. Drivers of uncertainty in the projected changes of the joint return period of concurrent precipitation and meteorological tide extremes for IPCC subregions and worldwide.
Relative model uncertainty in the projected change in joint return periods (or inverse probability) between the future (2070–2099) and baseline (1970–2004) climates driven by the individual meteorological drivers of compound flooding, i.e. only by precipitation, meteorological-tide, and their dependence (see “Methods” section). The IPCC subregions are shown in Supplementary Fig. S6.

References

    1. Vousdoukas MI, et al. Global probabilistic projections of extreme sea levels show intensification of coastal flood hazard. Nat. Commun. 2018;9:2360. doi: 10.1038/s41467-018-04692-w. - DOI - PMC - PubMed
    1. Hinkel J, et al. Coastal flood damage and adaptation costs under 21st century sea-level rise. Proc. Natl Acad. Sci. USA. 2014;111:3292–3297. doi: 10.1073/pnas.1222469111. - DOI - PMC - PubMed
    1. Bouwer LM, Jonkman SN. Global mortality from storm surges is decreasing. Environ. Res. Lett. 2018;13:014008. doi: 10.1088/1748-9326/aa98a3. - DOI
    1. Winsemius HC, et al. Global drivers of future river flood risk. Nat. Clim. Change. 2016;6:381–385. doi: 10.1038/nclimate2893. - DOI
    1. Pfahl S, O’Gorman P, Fischer E. Understanding the regional pattern of projected future changes in extreme precipitation. Nat. Clim. Change. 2017;7:423–427. doi: 10.1038/nclimate3287. - DOI

LinkOut - more resources