

Cryo-EM structure of native human uromodulin, a zona pellucida module polymer
- PMID: 33196145
- PMCID: PMC7737619
- DOI: 10.15252/embj.2020106807
Cryo-EM structure of native human uromodulin, a zona pellucida module polymer
Abstract
Assembly of extracellular filaments and matrices mediating fundamental biological processes such as morphogenesis, hearing, fertilization, and antibacterial defense is driven by a ubiquitous polymerization module known as zona pellucida (ZP) "domain". Despite the conservation of this element from hydra to humans, no detailed information is available on the filamentous conformation of any ZP module protein. Here, we report a cryo-electron microscopy study of uromodulin (UMOD)/Tamm-Horsfall protein, the most abundant protein in human urine and an archetypal ZP module-containing molecule, in its mature homopolymeric state. UMOD forms a one-start helix with an unprecedented 180-degree twist between subunits enfolded by interdomain linkers that have completely reorganized as a result of propeptide dissociation. Lateral interaction between filaments in the urine generates sheets exposing a checkerboard of binding sites to capture uropathogenic bacteria, and UMOD-based models of heteromeric vertebrate egg coat filaments identify a common sperm-binding region at the interface between subunits.
Keywords: ZP domain; cryo-electron microscopy; polymerization; uromodulin; zona pellucida.
© 2020 The Authors Published under the terms of the CC BY 4.0 license.
Conflict of interest statement
The authors declare that they have no conflict of interest.
Figures

- A
Domain organization of the secreted human UMOD precursor. Magenta, EGF I‐III; salmon, D8C domain; orange, EGF IV; light blue and dark blue, ZP‐N and ZP‐C domains; red, ZP‐N/ZP‐C linker; gray, internal hydrophobic patch (IHP); black, CCS; yellow, EHP. A thick black horizontal line marks the CTP, with a brown circle depicting the GPI anchor attachment. Inverted tripods show N‐glycans, with the high‐mannose chain attached to D8C N275 colored cyan. Black and orange arrows indicate the position of the hepsin (F587|R588) and elastase (S291|S292) cleavage sites, respectively, with thin horizontal bars indicating the extent of UMODfl and UMODe.
- B
Representative Volta phase plate micrographs of native UMODfl filaments. Although tree/front views are predominant, a number of zig‐zag/side views can be seen in the right‐most micrograph. The yellow arrows show examples of how twisting of individual UMOD filaments generates both views. Scale bars: 50 nm.
- C
Reducing Coomassie‐stained SDS–PAGE analysis of the UMODfl (6 µg; lane 1) and UMODe (3 and 5 µg; lanes 2, 3) material used for structure determination.
- D
Representative micrograph of UMODe filaments, showing the absence of branches. Scale bar: 50 nm.
- E
Superposition of the UMODfl (salmon) and UMODe (cyan) cryo‐EM maps shows that only the former shows density for a globular domain protruding from the core of the filaments. This reveals the approximate location of the elastase cleavage site, corresponding to the N‐terminus of UMODe, within the structure of UMODfl (orange arrows).
- F
Coomassie‐stained SDS–PAGE analysis of supernatant and pellet fractions of purified native UMOD filaments, incubated with increasing amounts of urea. No significant breakdown of the polymers is observed at urea concentrations below 7 M.

- A
Electron micrograph of unstained UMOD filament sheets in human urine. The inset highlights a double helix‐like structure resulting from juxtaposition of two individual filaments. Scale bars: 50 nm and 10 nm (inset).
- B, C
“Tree” front view and “zig‐zag” side view of purified native UMOD filaments, imaged using a Volta phase plate. Scale bars: 10 nm.
- D, E
Front and side views of UMODe filaments, showing the absence of branches. Scale bars: 10 nm.
- F
Orthogonal views of the sharpened cryo‐EM map of UMODfl (3.8 Å resolution), oriented as in panels (B and C), respectively. The map is fitted with an atomic model that consists of a complete EGF IV + ZP module (chain A; blue), the ZP‐C domain of a second molecule (chain B; teal), and the EGF IV + ZP‐N domain of a third one (chain C; magenta).
- G–J
Details of the UMODfl map shown in panel (F): ZP‐N N396 glycan (G); interdomain linker α1β (H) and β1 (I); ZP‐C αEFβ/ZP‐N βF′ intermolecular interface (J).
- K
Sharpened cryo‐EM map of UMODe (4.0 Å resolution) in two orthogonal views oriented as in panels (D and E). Comparison of this map with that of UMODfl identifies density belonging to the N‐terminal half of UMOD (salmon contour in the front view of panel F), which is lost upon site‐specific cleavage by elastase (orange arrow).
- L
Goodsell‐style depiction of a complete UMODfl filament model, with protein subunits shown in different colors.
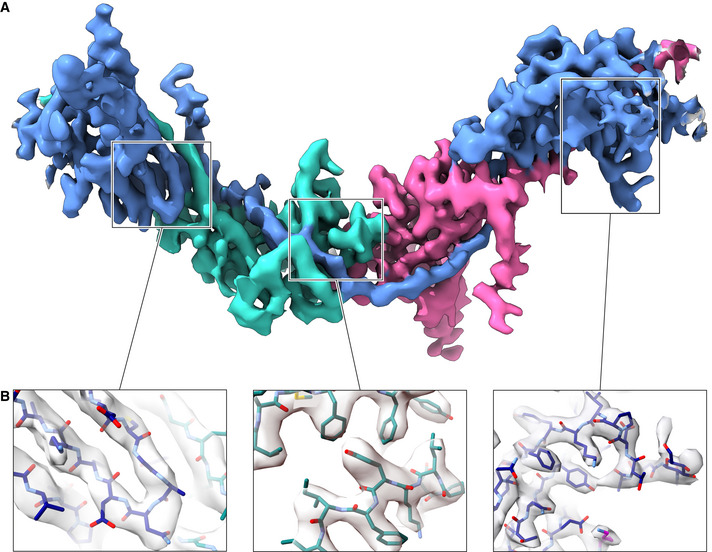
- A
Overall view of the entire polymerization region of a UMOD molecule (blue), wrapped around the ZP‐C domain (teal) and EGF IV + ZP‐N domains (magenta) of the preceding and following subunits, respectively.
- B
Details of different parts of the map, highlighting the separation of β‐strands (left panel) and the quality of side chain density (middle and right panels). The map is fitted with an atomic model of UMOD where carbon atoms of different chains are colored according to panel A.

- A
A section of a UMOD filament is shown that consists of 5 consecutive subunits (UMOD 1‐5) related by the helical symmetry operation indicated in the top panel. In the middle panel, where the helical axis is represented by a large black arrow, subunits are depicted in cartoon (UMOD 1, 3, and 5) and surface (UMOD 2, 3, and 4) representation to highlight protein–protein interfaces (with UMOD 1 ZP‐N and UMOD 5 ZP‐C omitted for clarity). In the filament, the ZP‐N/ZP‐C linker of each molecule (e.g., UMOD 3) wraps around the ZP‐C domain of the subunit that precedes it (UMOD 2) and the ZP‐N domain of the subunit that follows it (UMOD 4); additionally, the ZP‐N and ZP‐C domains of the same molecule are engaged in interactions with the ZP‐C domain of the subunit that in turn precedes UMOD 2 (UMOD 1) and the ZP‐N domain of the subunit that follows UMOD 4 (UMOD 5), respectively. As summarized in the bottom panel, every UMOD subunit is thus interacting with another four by being engaged in six interfaces that belong to three different types (ZP‐N/ZP‐C, black arrow; ZP‐N/β1, dark red arrow; E′FG, α1β/ZP‐C, light red arrow). Subunits 3, 2, and 4 in this figure correspond to Fig 3 chains A, B, and C, respectively.
- B
Path of the interdomain linkers of UMOD 1‐5, whose domains are outlined in the background. The view is rotated by ~ 40° around the Y‐axis, compared to panel (A).

- A
Comparison of the precursor and polymeric structures of UMOD shows how dissociation of the EHP triggers a major conformational change in the ZP module. This involves a significant rearrangement of the interdomain linker, which not only completely dissociates from ZP‐C but also changes secondary structure upon conversion of α1 in the precursor to α1β in the polymer. Molecules are depicted in cartoon representation, with only one subunit of the UMOD precursor homodimer shown; structural elements are colored as in Fig EV1A, with the N‐ and C‐terminal halves of the ZP‐N/ZP‐C linker colored bright and dark red, respectively.
- B
In the ZP‐C domain of the precursor form of UMOD (left panel, teal), the polymerization‐blocking EHP β‐strand interacts hydrophobically with a short α‐helix (αEF) encompassing the FXF motif. Hepsin‐mediated cleavage of the CCS of this molecule (chain B/UMOD 2) triggers release of its EHP, which is replaced by α1β from the interdomain linker of a second UMOD subunit (chain A/UMOD 3) (right panel). This allows the FXF motif of molecule B to form an intermolecular β‐sheet (αEFβ/βF′; upper dashed box) with the ZP‐N fg loop of a third, incoming subunit (chain C/UMOD 4, magenta). Another result of the CCS cleavage is that the C‐terminus of mature UMOD 2 is freed for interaction with the D8C domain of the same molecule (not shown). Elements are shown as in panel (A), with disulfide bonds and glycan residues represented by thick dark gray and thin black sticks, respectively; β‐strands are labeled as in the UMOD precursor (Bokhove et al, 2016a).
- C
Hidden Markov model logos, highlighting the conservation of selected residues shown in panels (B, D, and E).
- D
Hydrophobic interactions stabilize the interface between the E′FG extension of the ZP‐N domain of chain A and the ZP‐C domain of chain B, corresponding to the dashed box in the lower right part of panel (B).
- E
Details of the interface between the ZP‐C domain of chain B and the ZP‐N domain of chain C, showing a different view of the area boxed in the upper right part of panel (B).

- A
D8C domain models created using I‐TASSER (blue shades) or Robetta (magenta shades) have approximately the same overall dimensions.
- B
Consistent with the location of the elastase cleavage site (orange arrow) that immediately precedes the EGF IV domain (orange), the top model of D8C generated by Robetta (salmon) can be straightforwardly docked into the globular density protruding from the core of the filament. The unsharpened cryo‐EM map of UMODfl is shown, and a black arrow indicates the C6527‐C8582 disulfide, which orients the C‐terminal tail of mature UMOD (thick lemon tube) toward D8C. The latter also packs against the loop that connects C6527 to βD (thin lemon tube).
- C
Using multi‐body refinement in RELION, we performed a focused refinement of the density corresponding to the complete N‐terminal branch of UMOD. This locally refined map suggested the location of EGF I‐III, which served as a guideline to build a model of full‐length UMOD.
- D
The gray density depicts the N‐terminal branch, treated as body 1, whereas the cyan density shows the rest of the filament segment, treated as body 2. After being separately refined, these two local maps were merged to produce a composite map of UMODfl, which was used as a reference for model building and as a starting point for Fig 6B. UMOD branch domains are indicated and colored as in Fig S1A.
- A
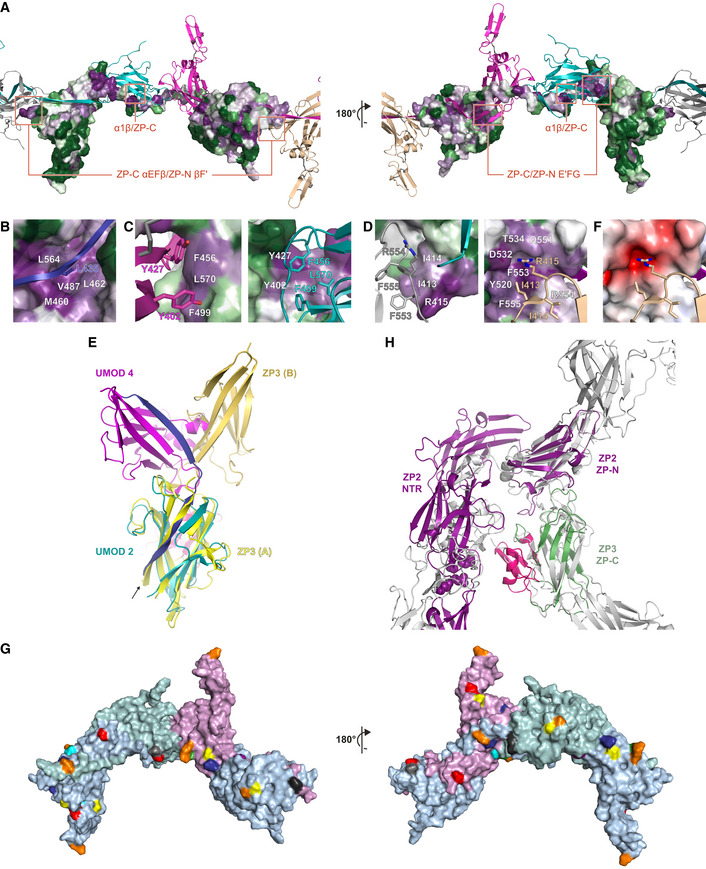
Surface representation of a UMOD subunit (UMOD 3), with residues colored from green to violet by increasing conservation according to ConSurf. Other subunits within the filament are shown as cartoons colored according to Fig 2, with interface areas highlighted in panels B‐D indicated by red rectangles.
- B
Interface between the interdomain linker of a UMOD subunit and the ZP‐C domain of the subunit that precedes it. White labels in this panel as well as panels C and D indicate residues depicted in surface representation.
- C
Close‐up of the interface between the ZP‐C domain of a UMOD molecule and the ZP‐N E′FG extension of the subunit that follows it.
- D
Details of the ZP‐C αEFβ/ZP‐N βF′ interface involving a copy of UMOD (UMOD n) and the second to next subunit (UMOD n + 2).
- E
Superposition of the ZP‐C domains of a polymeric UMOD subunit (UMOD 2 of Fig 2; teal) and one of the two subunits of the cZP3 precursor (chain A of PDB
3NK3 ; yellow, with the ZP3‐specific subdomain colored hot pink). The ZP‐N counterparts (magenta and orange‐yellow, respectively) that interact with these domains are differently positioned relative to the corresponding ZP‐Cs, although both interfaces are formed by the same elements. The arrow indicates how superimposing the ZP‐C domains brings the EHP of ZP3 in the same position as α1β in the interdomain linker of the UMOD subunit that follows UMOD 2 (UMOD 3; blue). - F
Same view of the ZP‐C αEFβ/ZP‐N βF′ interface shown on the right half of panel D, with the ZP‐C surface colored by calculated electrostatic potential from −5 kT/e (red) to + 5 kT/e (blue) through 0 kT/e (white).
- G
The ZP module interface observed in the UMOD filament is compatible with the expected solvent exposure of the N‐ and O‐glycosylation sites of other ZP module proteins. Predicted N‐glycosylation sites of human glycoprotein 2 (orange), α‐ and β‐tectorin (yellow and blue), ZP2 (green), ZP3 (gray), ZP4 (cyan), chicken ZPD (purple), as well as O‐glycosylation site 1 of chicken ZP3 (black), are mapped onto the surface of three adjacent UMOD chains (A, light blue; B, light teal; C, light magenta) based on sequence–structure alignments. UMOD N‐glycosylation sites are shown in red.
- H
Homology models of the N‐terminal repeat region (NTR) of mouse ZP2 plus its ZP‐N domain (Monné et al, 2008) and the ZP‐C domain of mouse ZP3 (green) were superimposed on the ZP‐N and ZP‐C domains of two adjacent UMOD filament subunits (gray), respectively; subsequently, ZP2 NTR was approximately oriented like the N‐terminal branch of the same UMOD subunit used for the ZP‐N/ZP‐N superposition. The resulting model shows that, akin to UMOD EGF I‐III + D8C, the ZP‐N domain repeats that precede the ZP module of ZP2 can project from the core of egg coat filaments without interfering with subunit polymerization interfaces. Similarly, the C‐terminal subdomain specific to ZP3 (hot pink) is predicted to be positioned laterally to the egg coat filament body and potentially face the ovastacin cleavage site in the second N‐terminal repeat of ZP2 (spheres).

- A
Immunofluorescence of unpermeabilized stably transfected MDCK cells shows that, unlike wt full‐length UMOD, ZP‐N (R415A) or ZP‐C (ΔFA) UMOD mutants do not assemble into filaments. Scale bar: 50 µm.
- B–G
Immunofluorescence of unpermeabilized cells co‐expressing FLAG‐tagged wt UMOD (green) and the indicated HA‐tagged isoforms (red). UMOD R415A does not incorporate into polymers that only contain wt protein (C). UMOD ΔFA has a dominant‐negative effect on wt protein polymerization (D) that is rescued in a double mutant carrying both ZP‐N and ZP‐C mutations (F). Similarly, the dominant‐negative effect of a CCS mutation (4A) that prevents EHP dissociation (E) is suppressed by introducing the R415A mutation in the 4A isoform (G). Scale bar: 50 µm.
- H
Immunofluorescence of permeabilized cells expressing soluble isoforms of UMOD truncated before the EHP (UMOD‐CCS) shows that wt forms intracellular polymers whereas polymerization interface mutants do not. The intracellular polymers are localized in the endoplasmic reticulum (ER), as shown by co‐staining with the KDEL sequence used as ER marker. Scale bar: 10 µm.

- A
Immunofluorescence of permeabilized MDCK cells expressing full‐length wt UMOD or mutants R415A or ΔFA. No intracellular aggregation is observed. Scale bar: 50 µm.
- B
MDCK cells stably expressing R415A or ΔFA mutants of full‐length UMOD. Immunoblots of total cell lysates (top panels) indicate that both wt protein and polymerization mutants are mainly present as a fully glycosylated isoform (upper band, black arrow), in addition to a minor ER‐glycosylated species (lower band, gray arrow). Immunoblot analysis of PNGase F‐deglycosylated proteins secreted by MDCK cells (bottom panels) shows that neither the R415A nor the ΔFA mutation affects protein secretion in the culturing medium. Blue arrows indicate proteins cleaved within the juxtamembrane region between GPI and EHP; red arrows mark proteins that were processed at the CCS. These results demonstrate comparable intracellular trafficking and secretion of wt and mutant isoforms. Note that the ΔFA mutation increases the amount of protein that is processed at the CCS, suggesting that alteration of the FXF motif affects the accessibility of the closely located cleavage site (Fig 3B, left panel); despite this, filaments are completely absent in the case of the mutant (Fig 4A, right panel), further underlying the specific effect of the mutation on UMOD polymerization.
- C
Immunoblot of deglycosylated proteins released in the culturing medium of MDCK cells stably co‐expressing FLAG‐tagged wt UMOD and HA‐tagged wt or mutant isoforms. Co‐expression of mutant UMOD does not alter the cleavage of the FLAG‐tagged wt protein, suggesting that the dominant‐negative effect of the ΔFA and 4A mutants is not caused by abnormal processing of wt UMOD.
- D
Immunoblot of UMOD in the cell lysate and conditioned medium of MDCK cells transiently transfected with the indicated HA‐tagged isoforms. The presence of the EHP motif is required for efficient protein exit from the ER, as suggested by comparing the intracellular levels and secretion of UMOD‐CCS and UMOD‐EHP.
- E
MDCK cells transiently expressing ZP‐N R415A and ZP‐C ΔFA mutants of UMOD‐EHP. Immunofluorescence of permeabilized cells shows the absence of intracellular polymers in both wt and mutant forms. Scale bar: 10 µm.
- F
Immunofluorescence analysis of unpermeabilized MDCK cells expressing UMOD‐EHP. Lack of membrane‐anchoring prevents localization and polymerization of the protein at the plasma membrane. Scale bar: 50 µm.
- G
Co‐culture of MDCK cells stably expressing HA‐tagged (red) or Myc‐tagged (green) wt UMOD. Filaments are uniformly colored, suggesting that polymerization depends on incorporation of membrane‐bound monomers instead of cleaved monomers released in the culture medium. Scale bar: 25 µm.

- A
Analytical SEC of UFE HCE/LCE digests produces two protein peaks, F1 and F2.
- B, C
Reducing SDS–PAGE (B) and native PAGE (C) of SEC‐purified UFE digests with indicated molecular weight markers. The different SEC elution volumes of F1 and F2 (A) reflect different levels of egg coat filament digestion by HCE/LCE.
- D, E
TOF‐MS spectrograms of purified F2 (D) and F1 (E) products. Round‐shaped symbols near the peaks indicate the two moieties of the intact ZP module of ZI‐3 (green) or the separated ZP‐N and ZP‐C domains of LCE‐cleaved ZI‐1,2 (purple).
- F, G
TOF‐MS spectrograms of cross‐linked products of F2 (F) and F1 (G), with domain symbols indicating the deduced subunit composition of cross‐linked products.
- H
Schematic representation of subunit interactions in medaka egg coat filaments. While ZI‐1,2 subunits (purple) incorporate into the filaments upon activation of monomeric precursors (Appendix Fig S3A), the variable oligomeric state of the ZI‐3 precursors (Appendix Fig S3B) allows this subunit to be incorporated in either dimeric (green) or monomeric (light green) form. Digestion of the resulting polymers through specific cleavage of the ZI‐1,2 interdomain linker by LCE (black crosses) would solubilize filament fragments corresponding to the macromolecular complexes identified in (F) and (G).
- I
Electron micrograph of negatively stained medaka egg coat filaments. On the right are representative 2D classes, indicating a separation of ~ 65 Å between repeating units within the polymers (white arrows). Scale bars: 100 nm (left panel) and 10 nm (bottom right panel).

- A
Negative stain micrograph of a sheet formed by purified UMOD filaments in 100 mM NaCl (top). Analysis of this material by correlation averaging reveals a periodic pattern (bottom) with a two‐fold symmetry axis perpendicular to the plane of the sheet (white symbol). Scale bars: 250 Å (top) and 125 Å (bottom).
- B
UMOD sheet model, generated by antiparallel juxtaposition of multiple copies of the UMODfl composite map, according to the 2D information shown in panel (A). Due to lack of information in the direction perpendicular to the plane of the sheets, the exact position of adjacent filaments relative to this plane is unknown; for simplicity, the depicted model has been generated by assuming that the cores of the filaments making up the sheet lie on the same plane. Individual filaments are alternately colored light and dark gray, with N‐terminal protein regions highlighted in pink and magenta, respectively. The zig‐zag view of two adjacent filaments in the sheet resembles the projection of a double helix (see inset of Fig 1A), and the regular presentation of UMOD branches generates a molecular Velcro surface for the capture of UPEC.
- C
Comparison of the UMOD sheet model with the bottom part of panel (A) suggests that the diffuse density protruding into the space between adjacent filaments (cyan arrow) corresponds to the glycan(s) attached to N396 and/or N513 (light and dark blue arrows, respectively).
- D
Detail of a porcine ZP filament model, generated by superposition of homology models of adjacent ZP3 and ZP4 subunits (green and purple, respectively) onto the structure of UMODfl (semi‐transparent gray), and projection of the residues of the interdomain linker of another ZP3 subunit onto the UMOD ZP‐N/ZP‐C linker (red). A cluster of experimentally verified glycosylation sites is shown, with side chain atoms depicted as spheres and boxes highlighting the proximity of ZP3 N271 and ZP4 N220, whose N‐glycans mediate sperm binding in pig (Yonezawa, 2014). Note how these residues are also close to the conserved N‐ (dashed underline) and O‐ (site 1, single underline; site 2, double underline) glycosylation sites in the ZP3 interdomain linker. The invariant ZP3 Trp that follows site 1 is shown in stick representation at the interface with ZP4.
- E
Detail of the ZP3/ZP1 interface of an avian egg coat filament model, assembled and represented as described for panel (D). The box highlights the location of O‐glycosylation site 1, important for in vitro binding of chicken ZP3 to sperm (Han et al, 2010).

- A
Hepsin cleaves the membrane‐proximal CCS sequence of GPI‐anchored UMOD homodimers, triggering the dissociation of the EHP from the corresponding ZP‐C domain. For clarity, UMOD branch domains preceding EGF IV have been omitted.
- B
EHP displacement activates ZP‐C for polymerization by allowing it to form an intermolecular β‐sheet with an incoming ZP‐N domain from another homodimer.
- C
Reorientation of the second ZP‐C allows it to also be processed by hepsin, locally detaching the growing filament from the membrane.
- D
The interdomain linker, whose ordered precursor structure is also perturbed upon EHP dissociation, undergoes a major rearrangement that both replaces the ZP‐N/ZP‐N interface of the UMOD precursor and compensates for the loss of the EHP by DSE, completing filament formation.
Similar articles
-
Using machine learning to study protein-protein interactions: From the uromodulin polymer to egg zona pellucida filaments.Mol Reprod Dev. 2021 Oct;88(10):686-693. doi: 10.1002/mrd.23538. Epub 2021 Sep 29. Mol Reprod Dev. 2021. PMID: 34590381
-
A structured interdomain linker directs self-polymerization of human uromodulin.Proc Natl Acad Sci U S A. 2016 Feb 9;113(6):1552-7. doi: 10.1073/pnas.1519803113. Epub 2016 Jan 25. Proc Natl Acad Sci U S A. 2016. PMID: 26811476 Free PMC article.
-
The cryo-EM structure of the human uromodulin filament core reveals a unique assembly mechanism.Elife. 2020 Aug 20;9:e60265. doi: 10.7554/eLife.60265. Elife. 2020. PMID: 32815518 Free PMC article.
-
Structure of Zona Pellucida Module Proteins.Curr Top Dev Biol. 2018;130:413-442. doi: 10.1016/bs.ctdb.2018.02.007. Epub 2018 May 10. Curr Top Dev Biol. 2018. PMID: 29853186 Review.
-
The Human Egg's Zona Pellucida.Curr Top Dev Biol. 2018;130:379-411. doi: 10.1016/bs.ctdb.2018.01.001. Epub 2018 Mar 6. Curr Top Dev Biol. 2018. PMID: 29853184 Review.
Cited by
-
ZP2 cleavage blocks polyspermy by modulating the architecture of the egg coat.Cell. 2024 Mar 14;187(6):1440-1459.e24. doi: 10.1016/j.cell.2024.02.013. Cell. 2024. PMID: 38490181 Free PMC article.
-
The role of uromodulin in cardiovascular disease: a review.Front Cardiovasc Med. 2024 Jul 9;11:1417593. doi: 10.3389/fcvm.2024.1417593. eCollection 2024. Front Cardiovasc Med. 2024. PMID: 39049957 Free PMC article. Review.
-
A zebrafish gene with sequence similarities to human uromodulin and GP2 displays extensive evolutionary diversification among teleost and confers resistance to bacterial infection.Heliyon. 2024 Sep 6;10(18):e37510. doi: 10.1016/j.heliyon.2024.e37510. eCollection 2024 Sep 30. Heliyon. 2024. PMID: 39309883 Free PMC article.
-
Advances in uromodulin biology and potential clinical applications.Nat Rev Nephrol. 2024 Dec;20(12):806-821. doi: 10.1038/s41581-024-00881-7. Epub 2024 Aug 19. Nat Rev Nephrol. 2024. PMID: 39160319 Free PMC article. Review.
-
Zona Pellucida like Domain Protein 1 (ZPLD1) Polymerization Is Regulated by Two Distinguished Hydrophobic Motifs.Int J Mol Sci. 2022 Nov 11;23(22):13894. doi: 10.3390/ijms232213894. Int J Mol Sci. 2022. PMID: 36430381 Free PMC article.
References
-
- Agirre J, Iglesias‐Fernandez J, Rovira C, Davies GJ, Wilson KS, Cowtan KD (2015) Privateer: software for the conformational validation of carbohydrate structures. Nat Struct Mol Biol 22: 833–834 - PubMed
Publication types
MeSH terms
Substances
Associated data
- Actions
- Actions
Grants and funding
LinkOut - more resources
Full Text Sources
Molecular Biology Databases
Miscellaneous
