. 2020 Dec 7;219(12):e202004101.
doi: 10.1083/jcb.202004101.

centrocortin RNA localization to centrosomes is regulated by FMRP and facilitates error-free mitosis

Affiliations

centrocortin RNA localization to centrosomes is regulated by FMRP and facilitates error-free mitosis

Pearl V Ryder et al. J Cell Biol. .

Abstract

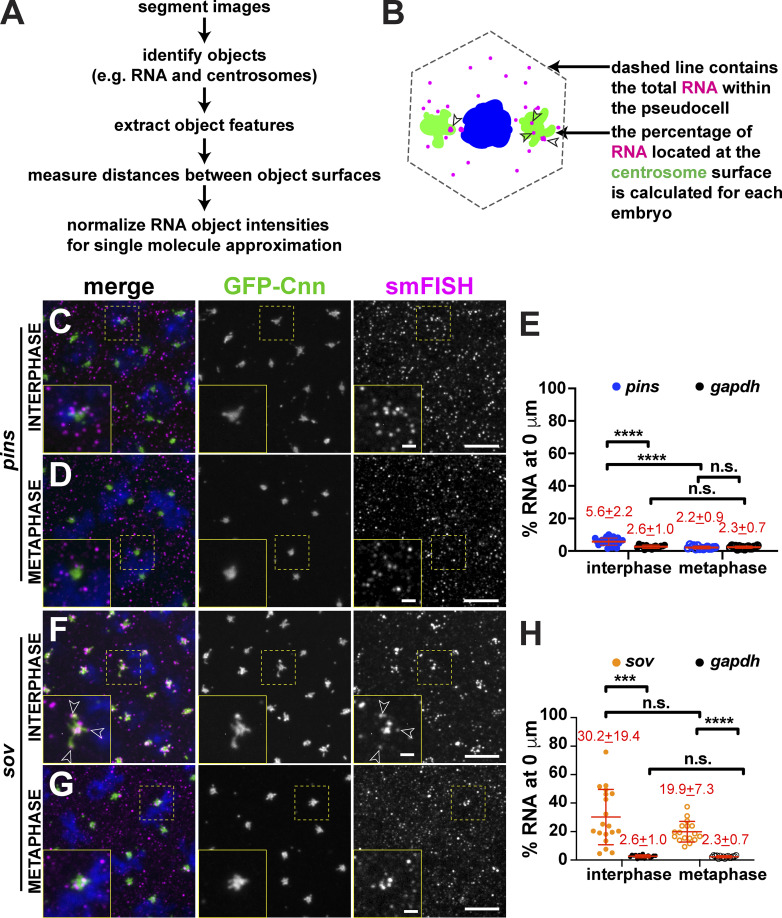
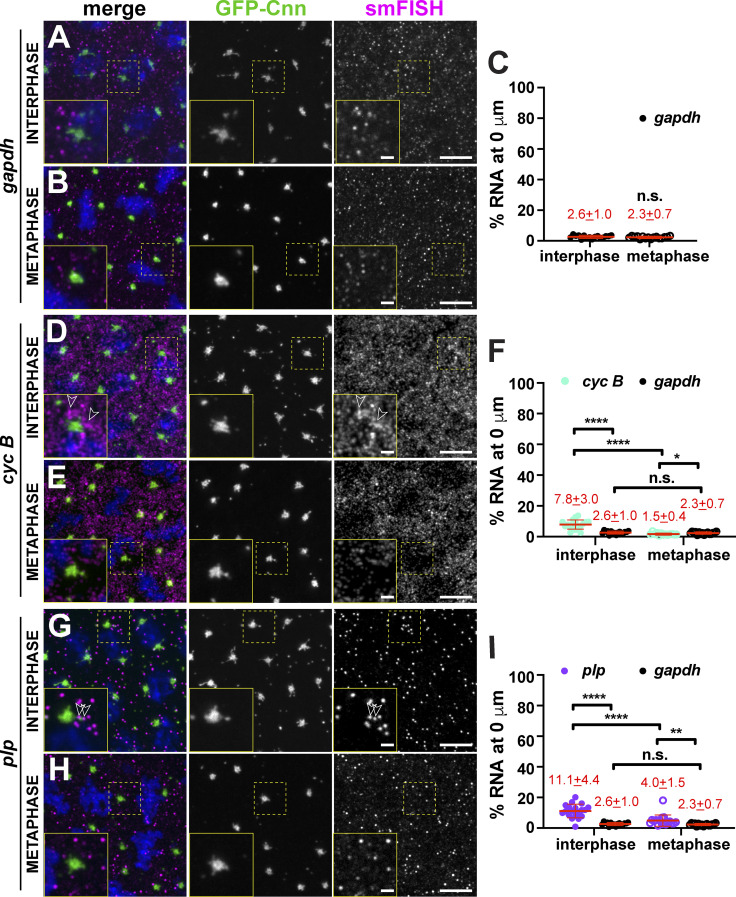
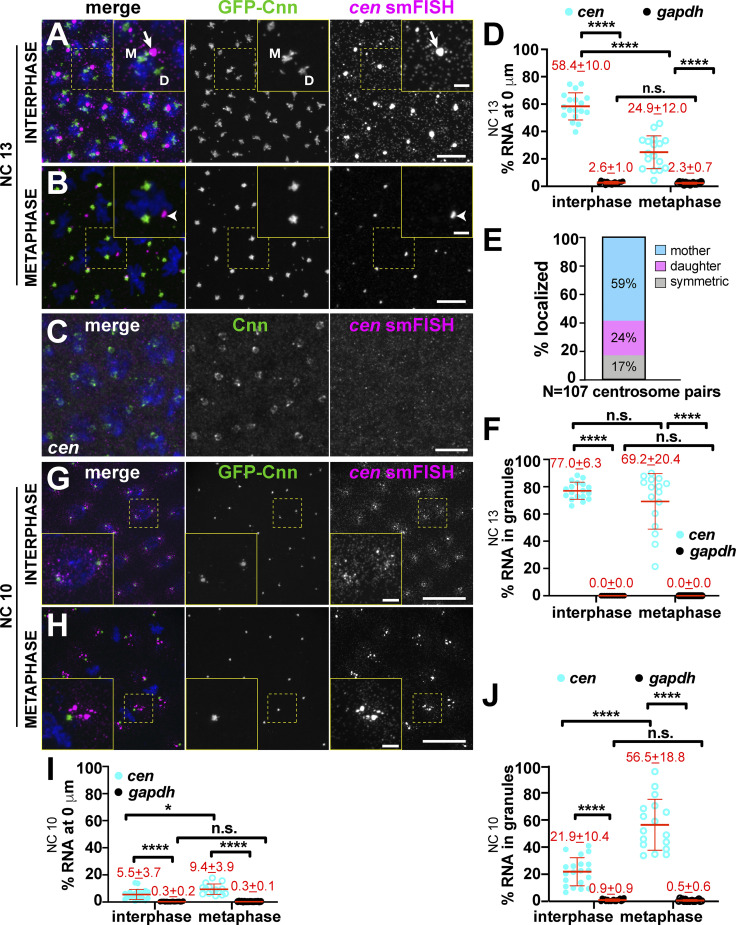
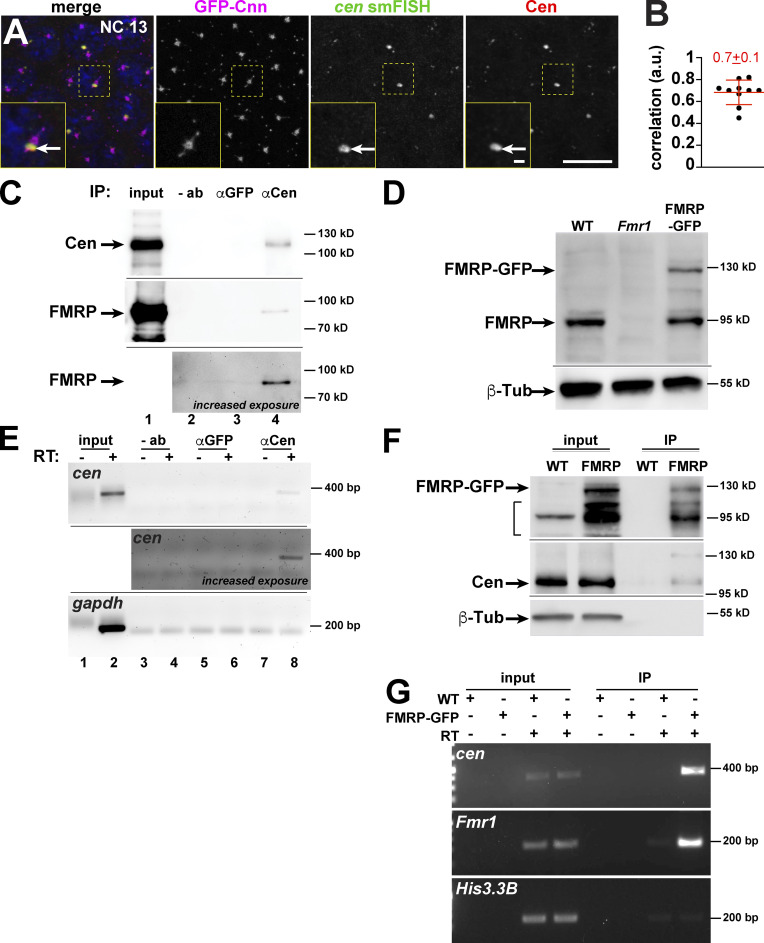
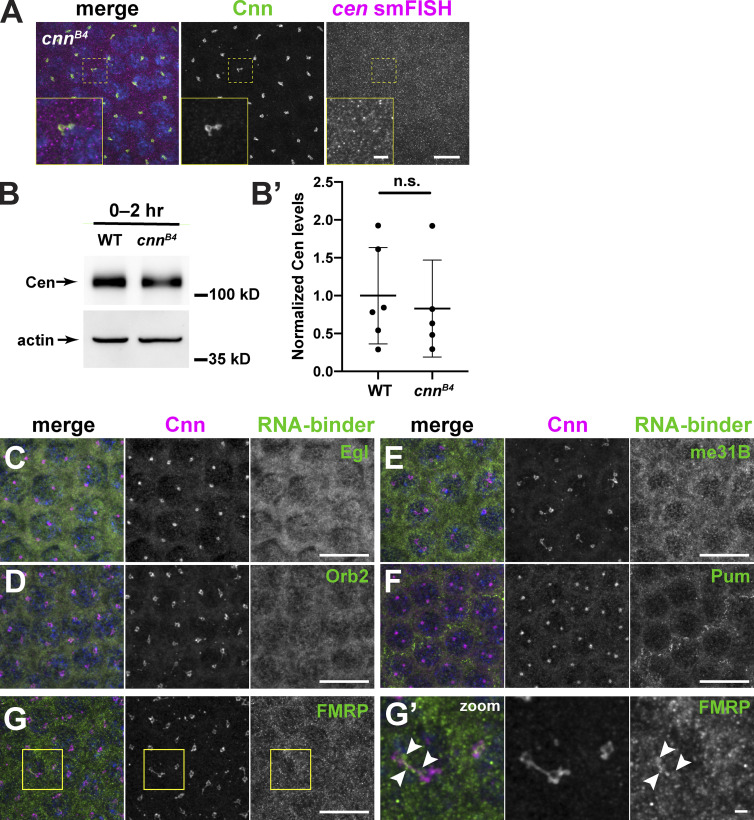
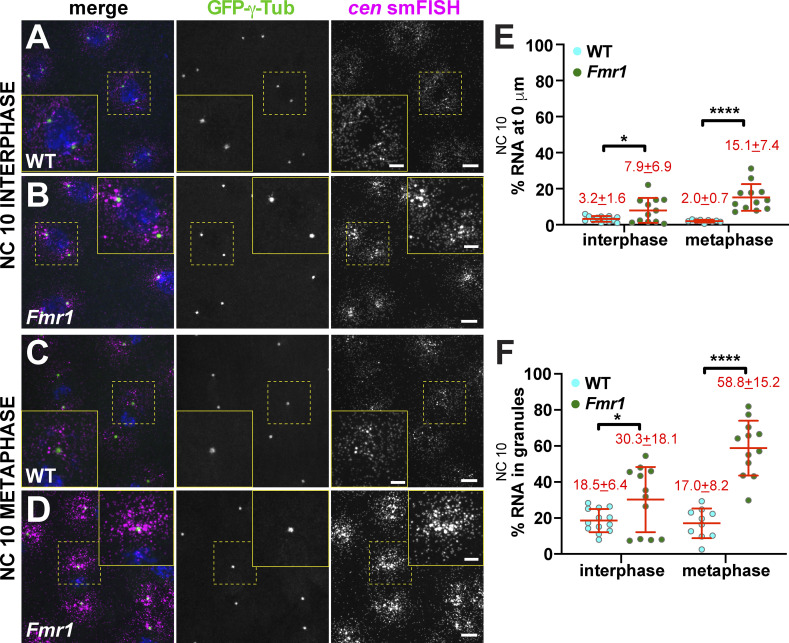
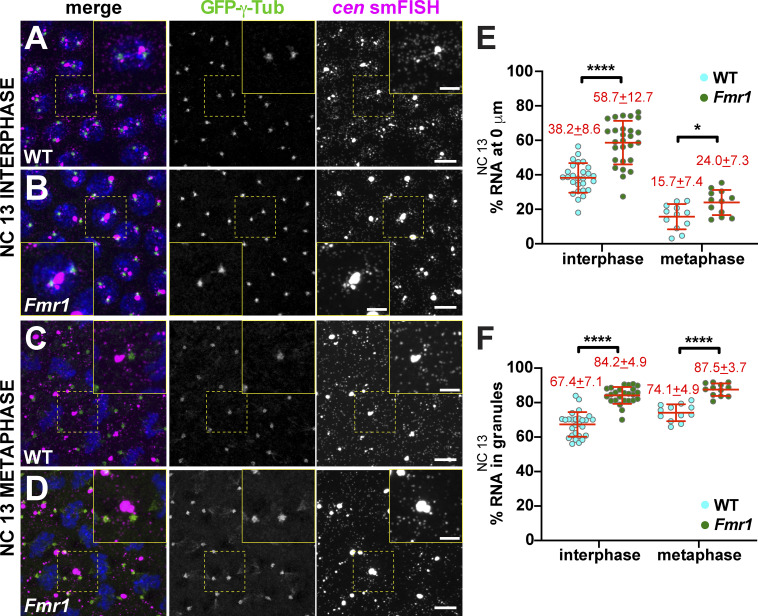
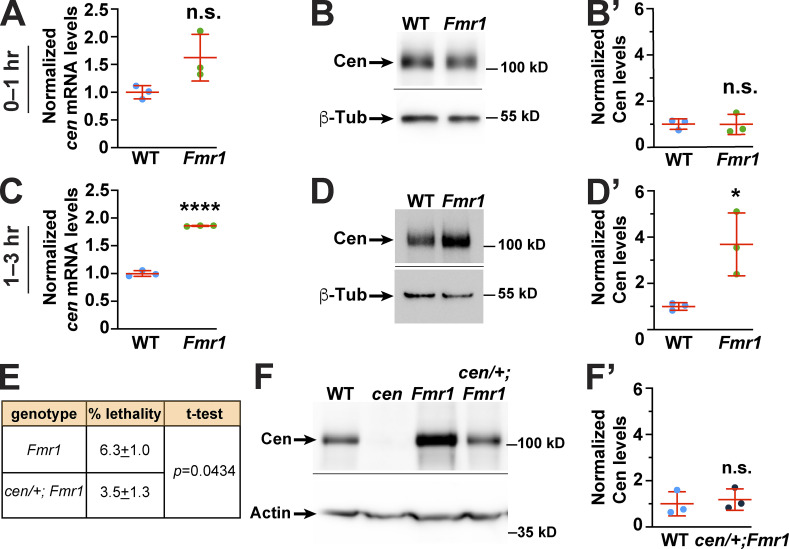
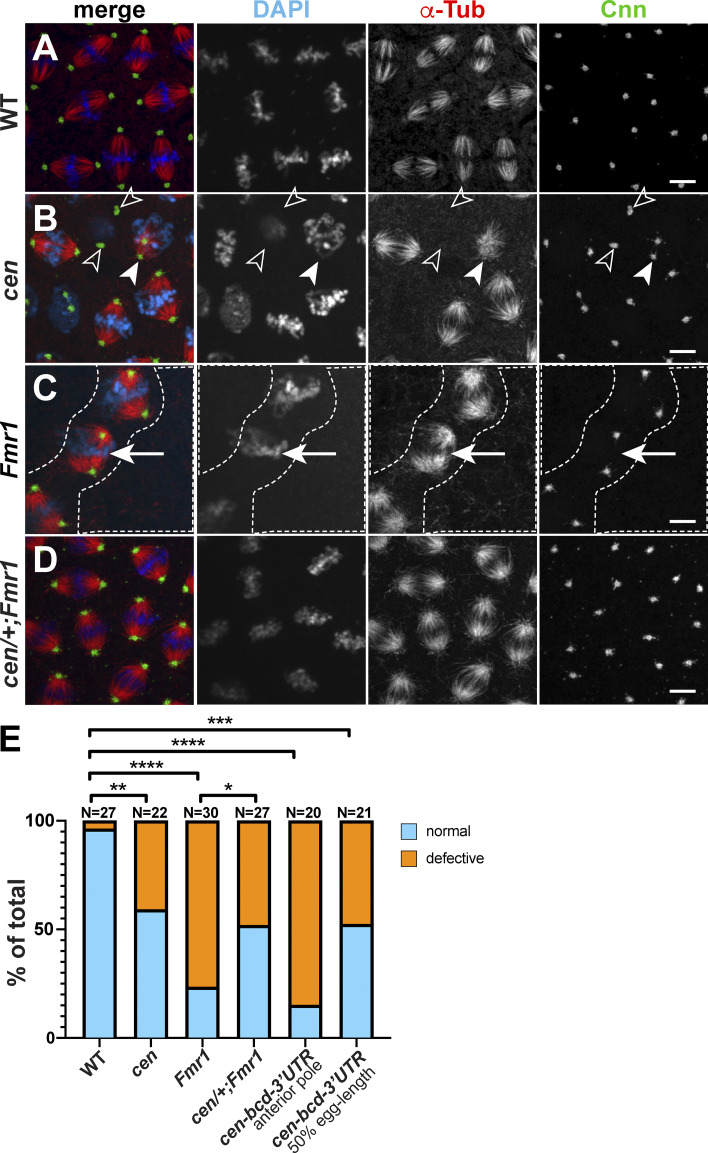
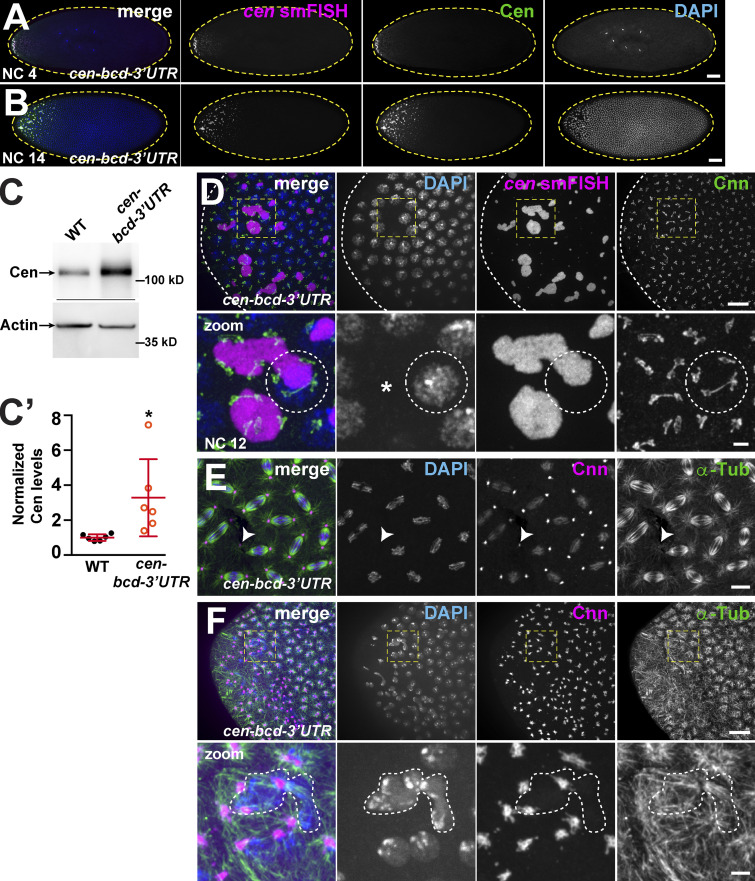
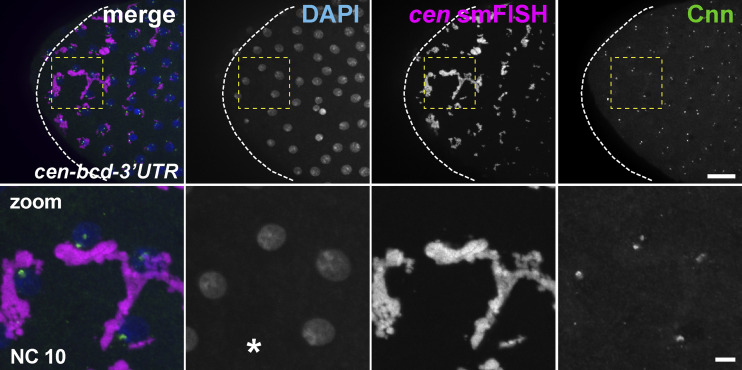
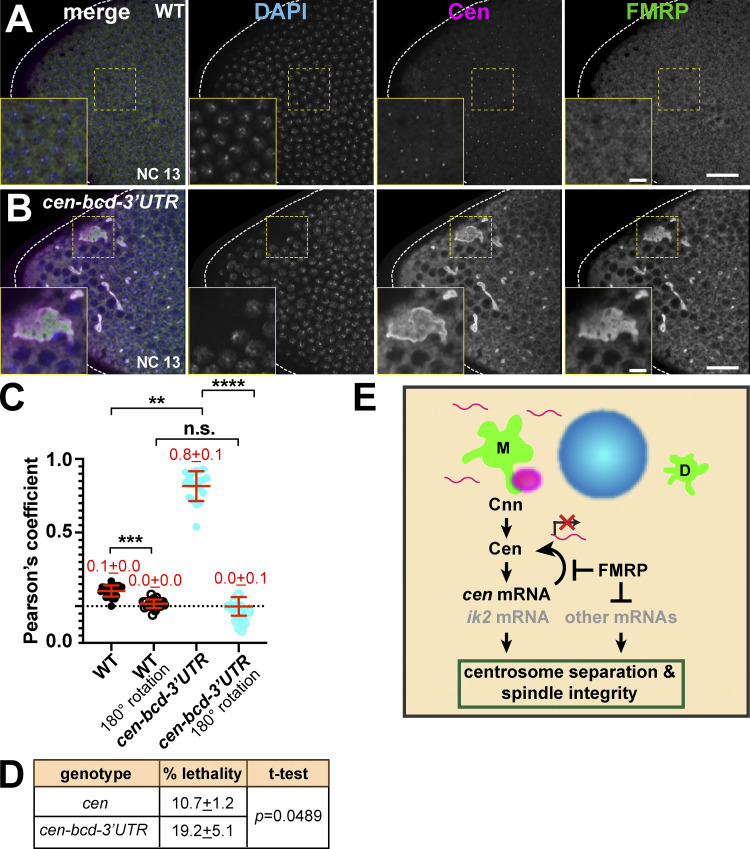
Centrosomes are microtubule-organizing centers required for error-free mitosis and embryonic development. The microtubule-nucleating activity of centrosomes is conferred by the pericentriolar material (PCM), a composite of numerous proteins subject to cell cycle-dependent oscillations in levels and organization. In diverse cell types, mRNAs localize to centrosomes and may contribute to changes in PCM abundance. Here, we investigate the regulation of mRNA localization to centrosomes in the rapidly cycling Drosophila melanogaster embryo. We find that RNA localization to centrosomes is regulated during the cell cycle and developmentally. We identify a novel role for the fragile-X mental retardation protein in the posttranscriptional regulation of a model centrosomal mRNA, centrocortin (cen). Further, mistargeting cen mRNA is sufficient to alter cognate protein localization to centrosomes and impair spindle morphogenesis and genome stability.


Figures

Figure S1.
Figure S1.
Determining mRNA enrichment at centrosomes. (A) Workflow used to quantify RNA distributions relative to centrosomes. (B) Cartoon shows total RNA (magenta) within a syncytial Drosophila embryo pseudocell (dashed line). Arrowheads show RNA overlapping with the centrosome (green) surface. (C–H) Maximum-intensity projections and quantification of smFISH for pins or sov mRNAs (magenta) in interphase and metaphase NC 13 embryos expressing GFP-Cnn (green). Boxed regions are enlarged in the insets. Open arrowheads denote association of sov mRNA with centrosome flares. Quantification of the percentage of RNA overlapping with the centrosome surface (0 µm distance) is shown to the right, where each dot represents a single measurement from n = 16 interphase and metaphase (gapdh mRNA), n = 24 interphase and 15 metaphase (pins mRNA), and n = 19 interphase and 17 metaphase (sov mRNA) embryos. Mean ± SD are shown (red text). (C–H) pins (C–E) and sov (F–H). Note that values for gapdh are reproduced from Fig. 1 C to facilitate comparison. Table 1 lists the number of embryos, centrosomes, and RNA objects quantified per condition. ***, P < 0.001; and ****, P < 0.0001 by ANOVA followed by Dunnett’s T3 multiple comparisons test. Scale bars: 5 µm; 1 µm (insets). n.s., not significant.
Figure 1.
Figure 1.
Quantitative localization of mRNA to centrosomes. Maximum-intensity projections of smFISH (magenta) in NC 13 embryos expressing the centrosome marker GFP-Cnn (green). DAPI labels nuclei blue. Boxed regions enlarged in insets. Open arrowheads mark mRNA at the PCM. Quantification of the percentage of RNA overlapping with the centrosome surface (0 µm distance) is shown to the right, where each dot represents a single measurement from n = 16 interphase and metaphase (gapdh mRNA), 19 interphase and 13 metaphase (cyc B mRNA), and 19 interphase and 17 metaphase (plp mRNA) embryos, respectively. Mean ± SD displayed (red). (A–I) gapdh (A–C), cyc B (D–F), and plp mRNAs (G–I). Note that values for gapdh are reproduced from C for comparison. Table 1 lists the number of embryos, centrosomes, and RNA objects quantified per condition. *, P < 0.05; **, P < 0.01; ****, P < 0.0001 by ANOVA followed by Dunnett’s T3 multiple comparisons test. Scale bars: 5 µm; 1 µm (insets). n.s., not significant.
Figure 2.
Figure 2.
cen mRNA localization to centrosomes is cell cycle regulated. Maximum-intensity projections of cen smFISH (magenta), where Cnn (green) labels centrosomes. Boxed regions enlarged in insets. (A) Interphase NC 13 embryo showing cen mRNA granules (arrow). Mother (M) and daughter (D) centrosomes noted. (B) Metaphase NC 13 embryo with cen mRNA (arrowhead) displaced from centrosomes. (C) cen mRNA is not detected in cen mutants. (D) Percentage of RNA overlapping with centrosomes in NC 13. Note that values for gapdh are reproduced from Fig. 1 C for comparison. (E) Frequency distribution of cen mRNA granule localization from n = 107 centrosome pairs and n = 5 embryos. (F) Percentage of cen mRNA residing within granules (≥4 overlapping RNA molecules) in NC 13. (G) Interphase NC 10 embryo with cen mRNA symmetrically distributed to centrosomes. (H) Metaphase NC 10 embryo with cen mRNA granules. (I) Percentage of RNA overlapping with centrosomes in NC 10. (J) Percentage of cen mRNA within granules in NC 10. Each dot represents a measurement from a single embryo. Mean ± SD displayed (red) from n = 16 interphase and metaphase (gapdh mRNA), 18 interphase and 17 metaphase (cen mRNA) NC 13; n = 19 interphase and 18 metaphase (gapdh mRNA); and 20 interphase and 17 metaphase (cen mRNA) NC 10 embryos, respectively. Table 1 lists number of objects quantified per condition. *, P < 0.05; ****, P < 0.0001 by ANOVA followed by Dunnett’s T3 multiple comparisons test (D, I, and J) and the Kruskal-Wallis test followed by Dunn’s multiple comparisons test (F). Scale bars: 10 µm; 2.5 µm (insets). n.s., not significant.
Figure 3.
Figure 3.
Composition of the cen mRNA granule. (A) Maximum-intensity projection of a NC 13 embryo expressing GFP-Cnn (magenta) showing colocalization of cen mRNA (green) and protein (red). Boxed region enlarged in insets; arrows, cen mRNA granule. (B) Pearson’s correlation coefficient for cen smFISH and Cen signals. Each dot is a single measurement from n = 10 NC 13 embryos; mean ± SD displayed (red). (C) Blots from Cen immunoprecipitation (IP) using 1–3-h (∼NC 7–14) embryo extracts. Lane 1, 10% input; lane 2, empty beads; lane 3, rabbit anti-GFP antibody; and lane 4, rabbit anti-Cen antibody. Cen pulls down itself (top) and FMRP (middle and bottom). Lower blot shows increased exposure to highlight FMRP, with lane 1 cropped due to oversaturated signal. (D) Blot shows FMRP levels in 0–2-h (up to NC 14) embryos of the indicated genotypes using anti-FMRP antibody. (E) RNA-immunoprecipitation where RT-PCR reactions were run in the presence (+) or absence (–) of reverse transcriptase (RT). Lanes 1 and 2, 10% input; lanes 3 and 4, empty beads; lanes 5 and 6, rabbit anti-GFP antibody; and lanes 7 and 8, rabbit anti-Cen antibody. Middle image shows increased exposure to highlight cen; note that lanes 1 and 2 were cropped owing to oversaturated signal. (F) Blots from FMRP-GFP immunoprecipitation using 0–2-h WT or FMRP-GFP (FMRP) embryonic extracts and GFP-Trap beads probed with rabbit anti-GFP (top), rabbit anti-Cen (middle), and mouse anti-β-Tub antibodies (bottom). GFP pulls out FMRP-GFP and Cen protein. Bracket denotes nonspecific and/or degradation products. (G) RNA-immunoprecipitation from GFP-Trap beads, where Fmr1 (positive control; Ling et al., 2004) and cen mRNAs are pulled down (last lane), while His3.3B mRNA (negative control) is not. Full gels/blots available on FigShare (see Materials and methods). Scale bars: 10 µm; 1 µm (insets). a.u., arbitrary units.
Figure S2.
Figure S2.
cen mRNA granule formation requires the centrosome scaffold. (A) Image shows immunofluorescence for Cnn (green) and cen smFISH (magenta) in an NC 12 cnnB4 embryo. Boxed region is enlarged in inset. Note the absence of large pericentrosomal cen mRNA granules. (B) Immunoblots show Cen protein content in 0–2-h (up to NC 14) WT and cnnB4 lysates. Actin is used as a loading control. (B′) Each dot represents the levels of Cen normalized to the mean relative expression of the actin load control. n.s., not significant (P = 0.672) by unpaired t test from n = 3 independent biological replicates, with n = 2 technical replicates run on the same gel. (C–G′) Images show interphase NC 12 embryos stained for Cnn (magenta) and antibodies for the indicated RNA-binding proteins (RNA-binder, green): Egl (C), Orb2 (D), me31B (E), Pum (F), and FMRP (G). (G′) Inset from G; arrowheads, FMRP overlapping with Cnn. Scale bars: 10 µm; 2 µm (insets).
Figure 4.
Figure 4.
Fmr1 regulates cen mRNA granule formation. Maximum-intensity projections of cen smFISH (magenta) in NC 10 embryos expressing GFP-γ-Tub (green). Boxed regions are enlarged at right (yellow box, zoom). (A) WT NC 10 interphase embryo with cen mRNA at centrosomes. (B) Fmr1 embryo with more granular, pericentrosomal cen mRNA. (C) WT NC 10 metaphase embryo. (D) Fmr1 embryo showing increased cen mRNA at centrosomes. (E) Percentage of cen mRNA overlapping with centrosomes in WT versus Fmr1 embryos. (F) Percentage of cen mRNA within granules. Each dot is a single measurement from n = 13 interphase and 10 metaphase WT and n = 12 interphase and metaphase Fmr1 embryos. Mean ± SD displayed (red). Table 1 lists number of objects quantified per condition. *, P < 0.05; ****, P < 0.0001 by unpaired t test. Scale bars: 10 µm; 2.5 µm (insets).
Figure 5.
Figure 5.
FMRP regulates cen mRNA localization to centrosomes. Maximum-intensity projections of cen smFISH (magenta) in NC 13 embryos expressing GFP-γ-Tub (green). Boxed regions are enlarged at right (yellow box, zoom). (A) WT interphase embryo showing cen mRNA granules. (B) Fmr1 embryo with increased cen mRNA in pericentrosomal granules. (C) WT metaphase embryo with cen mRNA displaced from the centrosome. (D) Fmr1 embryo with cen mRNA at centrosomes. (E) Percentage of cen mRNA overlapping with centrosomes in WT versus Fmr1 embryos. (F) Percentage of cen mRNA within granules. Each dot is a single measurement from n = 27 interphase and n = 12 metaphase WT or Fmr1 NC 13 embryos; mean ± SD displayed (red). Table 1 lists number of objects quantified per condition. *, P < 0.05; ****, P < 0.0001 by unpaired t test. Scale bars: 10 µm; 2.5 µm (insets).
Figure 6.
Figure 6.
FMRP regulates levels of cen mRNA and protein levels. (A) Levels of cen RNA were normalized to RP49 as detected by qPCR from 0- to 1-h (up to NC 7) embryos. (B) Blots show Cen protein levels relative to the β-Tub loading control from 0–1-h embryos and quantified in B′. (C) Normalized levels of cen RNA from 1–3-h (∼NC 7–NC 14) embryos. (D) Blots show Cen protein in 1–3-h embryos and quantified in D′. (E) Embryonic lethality rates in Fmr1 versus cen/+; Fmr1 embryos. The mean ± SD is presented from n = 3 biological replicates; P was calculated by unpaired t test. (F) Blots show Cen protein in 1–3-h embryos and quantified in F′. Each dot is a measurement from an independent experiment; mean ± SD are displayed (red). Data in A–D′ and F′ are normalized to the mean relative expression of the controls from n = 3 biological replicates. *, P < 0.05; **** P < 0.0001 by unpaired t test. Full-sized blots available on FigShare (see Materials and methods). n.s., not significant.
Figure 7.
Figure 7.
Cen and FMRP ensure proper mitosis. Maximum-intensity projections of metaphase NC 11 embryos from the indicated genotypes stained for β-Tub to label microtubules (red), Cnn (green), and DAPI (blue). (A) WT show uniform bipolar mitotic spindles. (B) cen embryo with reduced microtubules (open arrowheads) and incomplete centrosome separation (closed arrowheads). (C) Fmr1 embryo with nuclear fallout (dashed lines) and bent spindles (arrows). (D) Hemizygosity for cen partially rescues Fmr1 mutants. (E) Frequency of spindle defects from n = 27 WT, 22 cen, 30 Fmr1, 27 cen/+;Fmr1, 20 cen-bcd-3′UTR (anterior), and 21 cen-bcd-3′UTR (50% egg length) embryos. *, P < 0.05; **, P < 0.01; ***, P < 0.001; ****, P < 0.0001 by Fisher’s exact test. Scale bars: 5 µm.
Figure 8.
Figure 8.
Ectopic localization of cen mRNA disrupts nuclear divisions. Maximum-intensity projections of cen-bcd-3′UTR embryos (derived from females expressing a pUASp-cen-bcd-3′UTR transgene and the maternal α-Tub GAL4 driver in the cen null background). (A and B) Embryos labeled with cen smFISH (magenta), DAPI (blue), and Cen (green) with a gradient of cen mRNA and protein (A) and disrupted nuclear spacing at the anterior pole (B). (C) Blots show Cen protein in 1–3-h (∼NC 7–NC 14) embryos and quantified in C′. Cen levels were normalized to the mean WT levels of actin from n = 3 independent biological replicates with n = 2 technical replicates run on the same gel. Mean ± SD is displayed (red). *, P < 0.05 by unpaired t test. (D) NC 12 anterior with large cen RNPs (magenta) decorated by centrosomes (Cnn, green). Dashed circle outlines nucleus and part of a cen RNP with supernumerary centrosomes. (E) NC 12 embryo at ∼50% egg length; arrowhead marks a detached centrosome. (F) NC 12 embryo at anterior pole with disorganized microtubules (α-Tub, green), centrosome position (Cnn, magenta), and dysmorphic nuclei (DAPI; dashed lines). Boxes enlarged below (zoom). Scale bars: 50 µm (A and B); 10 µm (D–F); and 2 µm (insets).
Figure S3.
Figure S3.
Deregulation of cen mRNA granule formation. (A) Immunoblots show Cen protein content relative to the actin loading control from 1–3-h embryonic extracts and are quantified in A′. Levels of Cen were normalized to the mean WT levels of actin from n = 3 independent biological replicates, each with n = 2 technical replicates run on the same gel. (B) Maximum-intensity projection of an interphase NC 10 embryo for cen mRNA labeled by smFISH (magenta), DAPI (nuclei, blue), and Cnn showing large cen RNPs. Asterisk marks nuclear fallout. Boxed regions enlarged below (zoom). Scale bars: 10 µm; 2 µm (insets).
Figure 9.
Figure 9.
Deregulation of cen mRNA impairs viability. (A and B) Single optical sections of interphase NC 13 embryos stained for Cen and FMRP; boxes enlarged in inset. (C) Pearson’s coefficient of Cen and FMRP signals; each dot is a measurement from n = 25 WT and n = 19 cen-bcd-3′UTR embryos from two independent experiments. One channel was rotated 180° to test for specificity of colocalization. Mean ± SD is displayed (red). **, P < 0.01; ***, P < 0.001; ****, P < 0.0001 by Kruskal-Wallis followed by Dunn’s multiple comparisons test. Scale bars: 20 µm (A and B); 5 µm (insets). n.s., not significant. (D) Embryonic lethality rates in cen versus cen-bcd-3′UTR embryos from three independent experiments. Mean ± SD is shown; P calculated by unpaired t test. (E) Model for FMRP-mediated regulation of cen mRNA. A direct interaction docks Cen to Cnn (green) at the centrosome (Kao and Megraw, 2009). Cen protein interacts with cen mRNA (magenta), which also recruits ik2 mRNA (Bergalet et al., 2020). Our data suggest that cen mRNA localization, organization into granules and levels, and translation are regulated by FMRP. Further, cen mRNA is an important target of FMRP required for spindle integrity and viability.

Comment in

References

    1. Albert, M.L., Darnell J.C., Bender A., Francisco L.M., Bhardwaj N., and Darnell R.B.. 1998. Tumor-specific killer cells in paraneoplastic cerebellar degeneration. Nat. Med. 4:1321–1324. 10.1038/3315 - DOI - PubMed
    1. Alliegro, M.C., and Alliegro M.A.. 2008. Centrosomal RNA correlates with intron-poor nuclear genes in Spisula oocytes. Proc. Natl. Acad. Sci. USA. 105:6993–6997. 10.1073/pnas.0802293105 - DOI - PMC - PubMed
    1. Alliegro, M.C., Alliegro M.A., and Palazzo R.E.. 2006. Centrosome-associated RNA in surf clam oocytes. Proc. Natl. Acad. Sci. USA. 103:9034–9038. 10.1073/pnas.0602859103 - DOI - PMC - PubMed
    1. Anderson, K.V., and Lengyel J.A.. 1979. Rates of synthesis of major classes of RNA in Drosophila embryos. Dev. Biol. 70:217–231. 10.1016/0012-1606(79)90018-6 - DOI - PubMed
    1. Ascano, M. Jr., Mukherjee N., Bandaru P., Miller J.B., Nusbaum J.D., Corcoran D.L., Langlois C., Munschauer M., Dewell S., Hafner M., et al. . 2012. FMRP targets distinct mRNA sequence elements to regulate protein expression. Nature. 492:382–386. 10.1038/nature11737 - DOI - PMC - PubMed

Publication types

MeSH terms