. 2021 Feb 1;181(2):186-194.
doi: 10.1001/jamainternmed.2020.6288.

Changes in Health Care Use and Outcomes After Turnover in Primary Care

Affiliations

Changes in Health Care Use and Outcomes After Turnover in Primary Care

Adrienne H Sabety et al. JAMA Intern Med. .

Abstract

Importance: Disruptions of continuity of care may harm patient outcomes, but existing studies of continuity disruption are limited by an inability to separate the association of continuity disruption from that of other physician-related factors.

Objectives: To examine changes in health care use and outcomes among patients whose primary care physician (PCP) exited the workforce and to directly measure the association of this primary care turnover with patients' health care use and outcomes.

Design, setting, and participants: This cohort study used nationally representative Medicare billing claims for a random sample of 359 470 Medicare fee-for-service beneficiaries with at least 1 PCP evaluation and management visit from January 1, 2008, to December 31, 2017. Primary care physicians who stopped practicing were identified and matched with PCPs who remained in practice. A difference-in-differences analysis compared health care use and clinical outcomes for patients who did lose PCPs with those who did not lose PCPs using subgroup analyses by practice size. Subgroup analyses were done on visits from January 1, 2008, to December 31, 2017.

Exposure: Patients' loss of a PCP.

Main outcomes and measures: Primary care, specialty care, urgent care, emergency department, and inpatient visits, as well as overall spending for patients, were the primary outcomes. Receipt of appropriate preventive care and prescription fills were also examined.

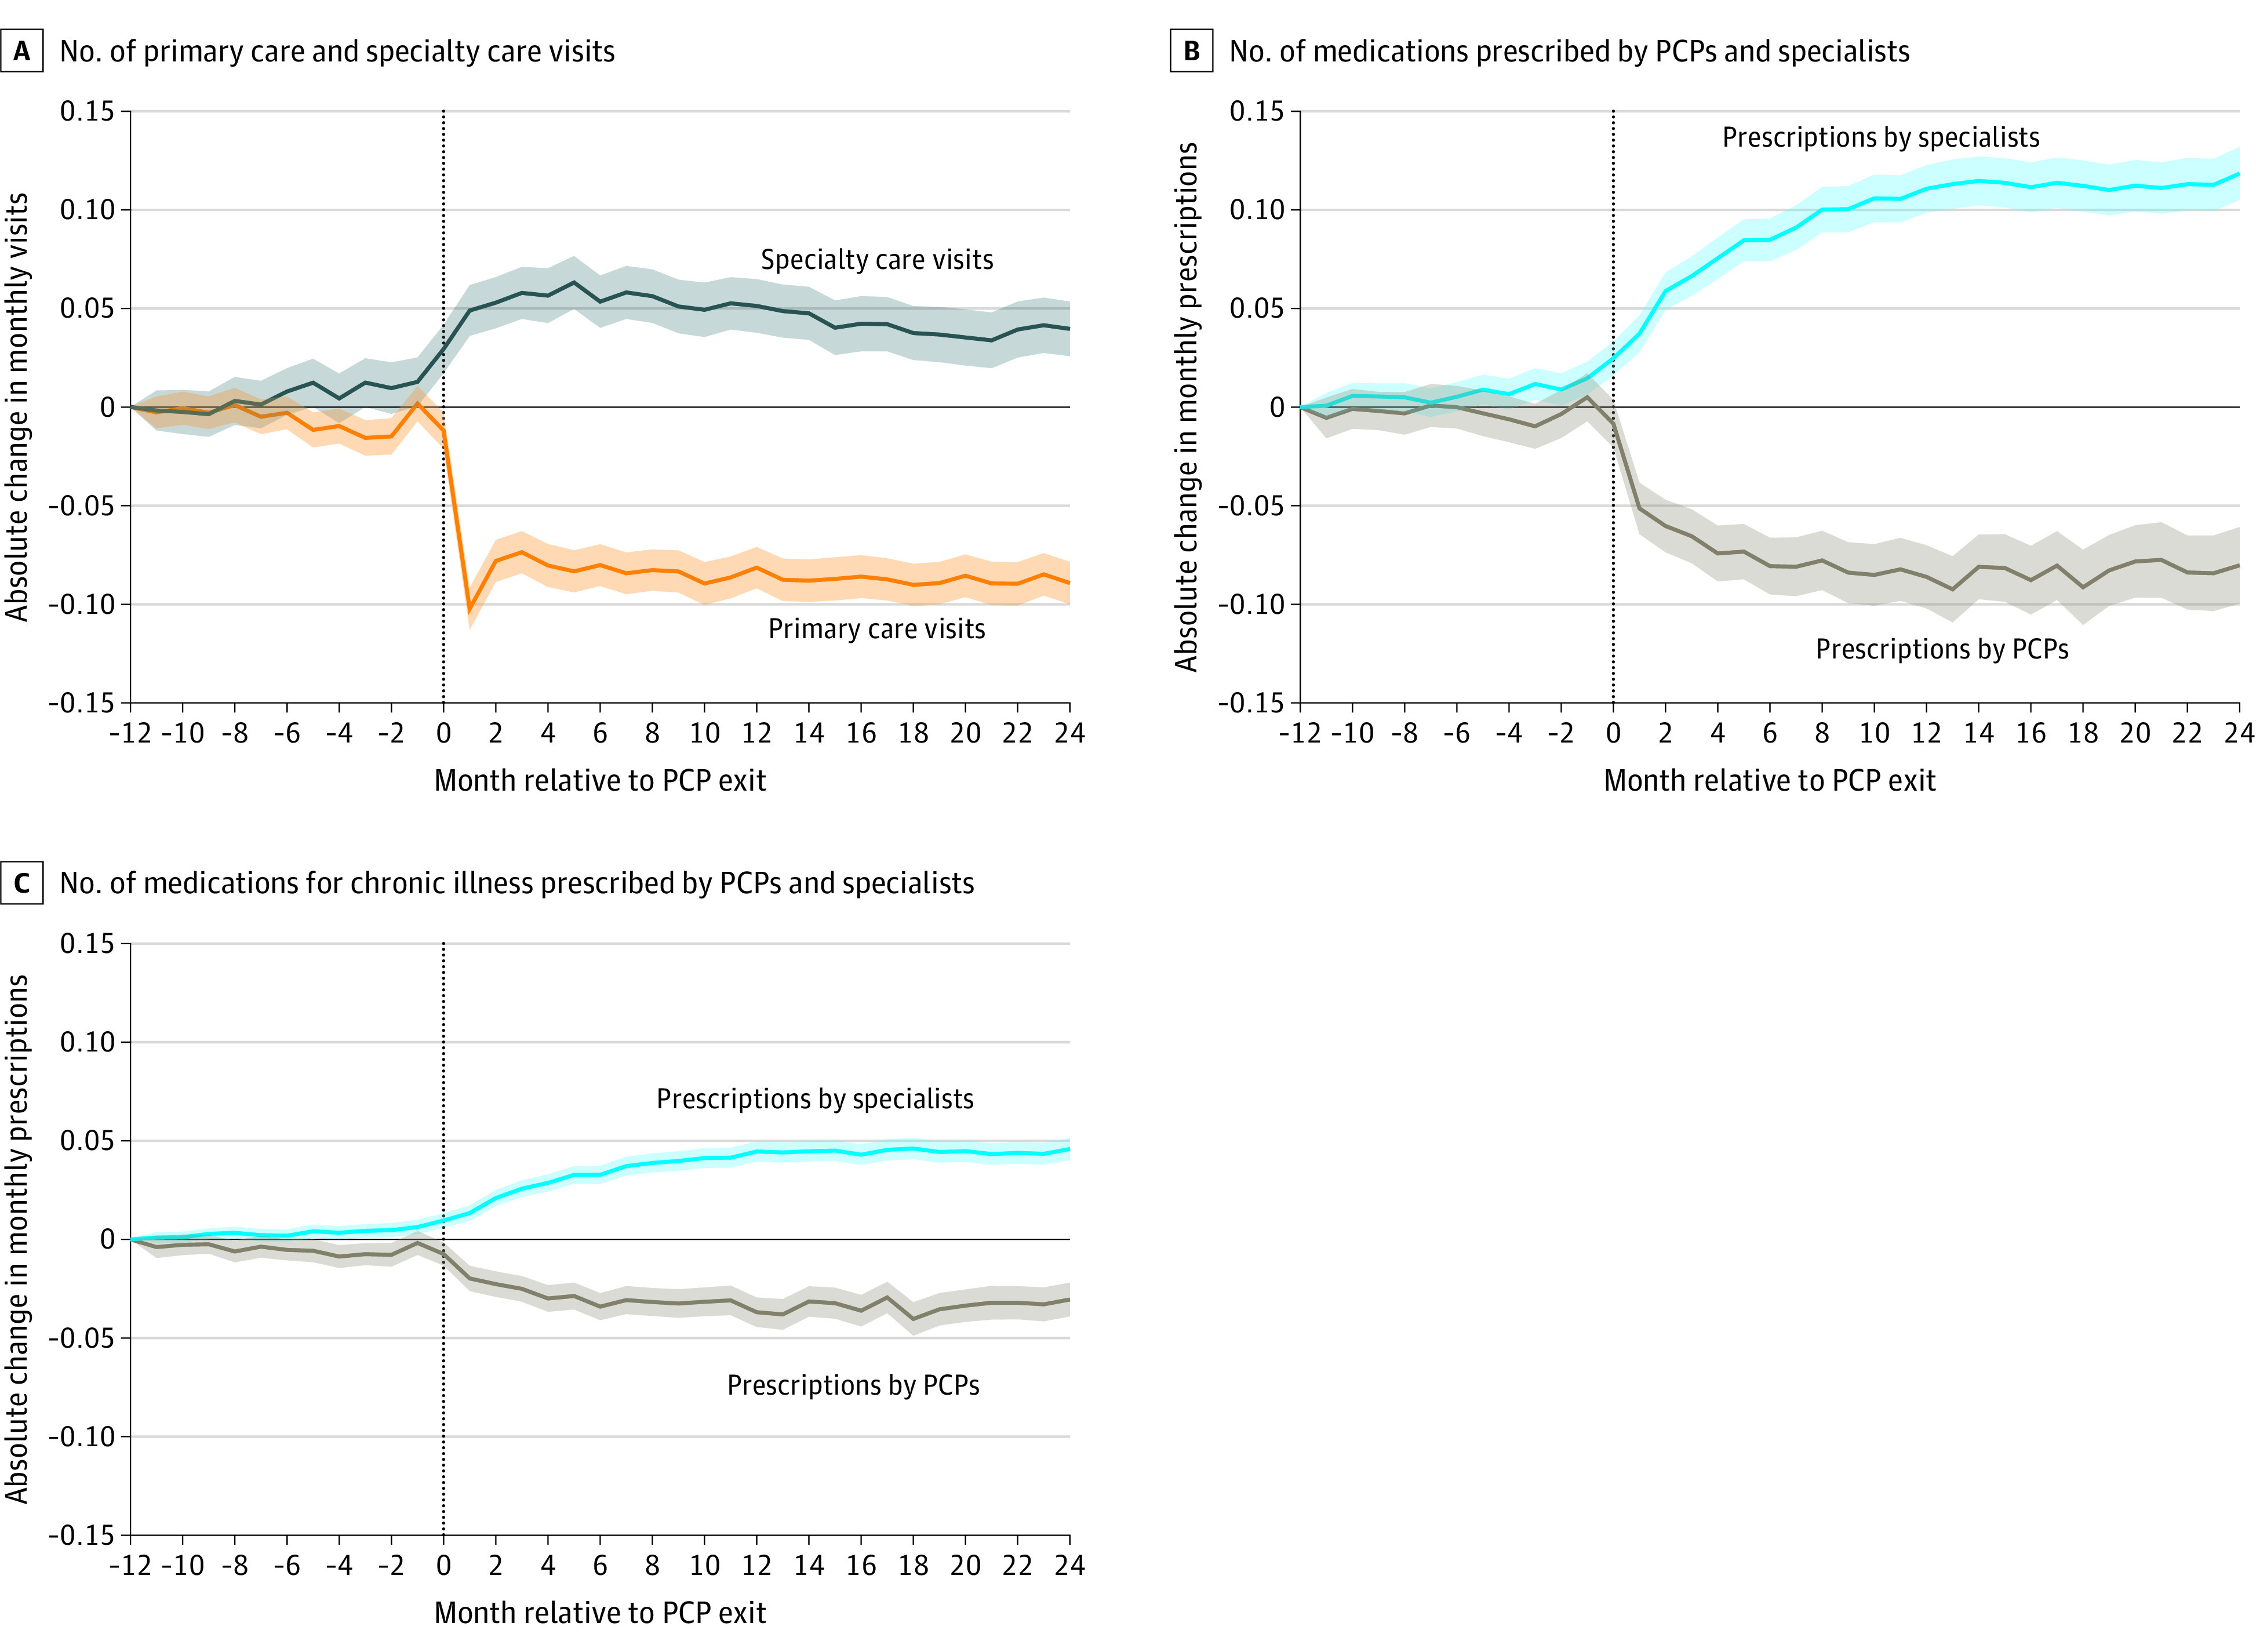
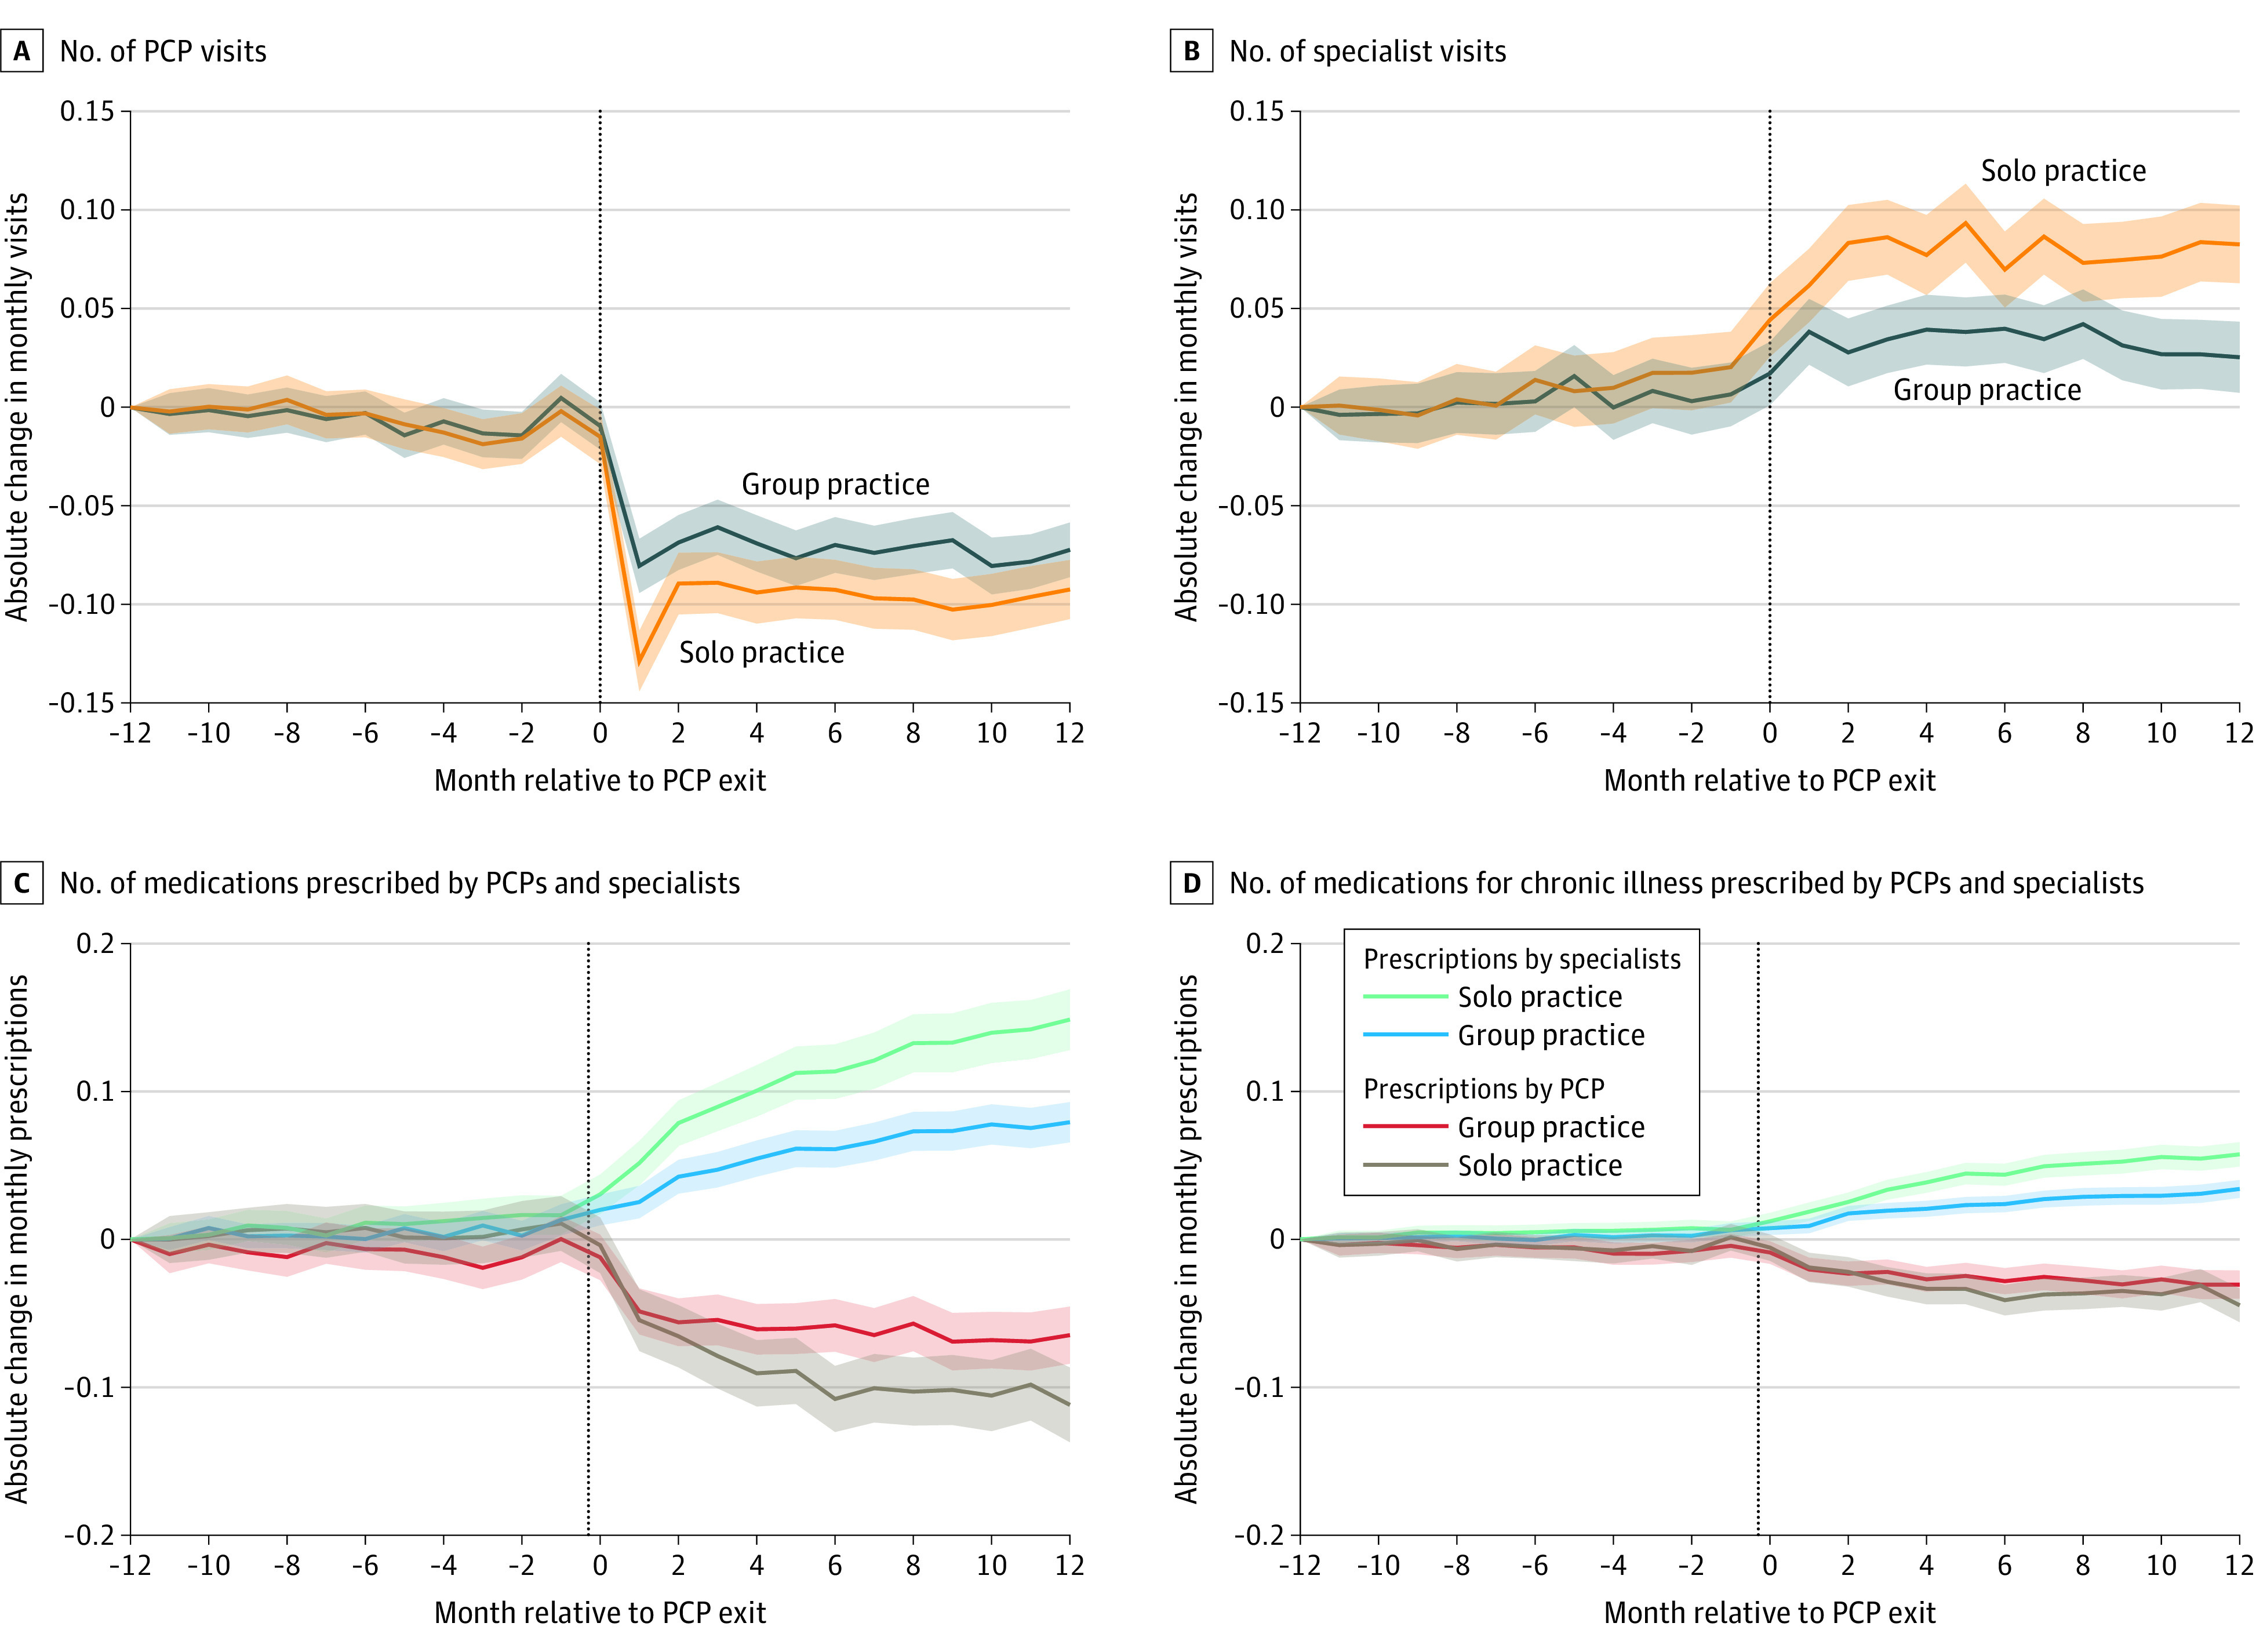
Results: During the study period, 9491 of 90 953 PCPs (10.4%) exited Medicare. We matched 169 870 beneficiaries whose PCP exited (37.2% women; mean [SD] age, 71.4 [6.1] years) with 189 600 beneficiaries whose PCP did not exit (36.9% women; mean [SD] age, 72.0 [5.0] years). The year after PCP exit, beneficiaries whose PCP exited had 18.4% (95% CI, -19.8% to -16.9%) fewer primary care visits and 6.2% (95% CI, 5.4%-7.0%) more specialty care visits compared with beneficiaries who did not lose a PCP. This outcome persisted 2 years after PCP exit. Beneficiaries whose PCP exited also had 17.8% (95% CI, 6.0%-29.7%) more urgent care visits, 3.1% (95% CI, 1.6%-4.6%) more emergency department visits, and greater spending ($189 [95% CI, $30-$347]) per beneficiary-year after PCP exit. These shifts were most pronounced for patients of exiting PCPs in solo practice, whose beneficiaries had 21.5% (95% CI, -23.8% to -19.3%) fewer primary care visits, 8.8% (95% CI, 7.6%-10.0%) more specialty care visits, 4.4% more emergency department visits (95% CI, 2.1%-6.7%), and $260 (95% CI, $12-$509) in increased spending.

Conclusions and relevance: Loss of a PCP was associated with lower use of primary care and increased use of specialty, urgent, and emergency care among Medicare beneficiaries. Interrupting primary care relationships may negatively impact health outcomes and future engagement with primary care.


Conflict of interest statement

Conflict of Interest Disclosures: Dr Jena reported receiving consulting fees unrelated to this work from Pfizer, Hill Rom Services, Bristol Myers Squibb, Novartis, Amgen, Eli Lilly, Vertex Pharmaceuticals, AstraZeneca, Celgene, Tesaro, Sanofi Aventis, Biogen, Precision Health Economics, and Analysis Group. No other disclosures were reported.

Figures

Figure 1.
Figure 1.. Overall Monthly Trends in Outpatient Visits and Prescriptions After Loss of a Primary Care Physician (PCP)
A, Absolute change in monthly primary care and specialty care visits among patients whose PCP exited vs those whose PCP did not exit. B, Absolute change in number of medications prescribed among patients whose PCP exited vs those whose PCP did not exit. C, Absolute change in number of medications prescribed for chronic illness among patients whose PCP exited vs those whose PCP did not exit. Absolute risk differences are relative to 12 months before PCP exit. Exiting PCPs were matched to nonexiting PCPs as described in the Methods. Month 0 (vertical dotted line) includes the last month an exiting PCP was observed practicing. Graphs of outpatient, primary care, specialist, emergency department, and inpatient visit pretrends are shown in eMethods 3 in the Supplement. Overall, beneficiaries had a mean of 0.4 primary care visits, 0.8 specialty visits, 1.5 filled prescriptions, and 0.6 filled prescriptions for chronic illness per month at baseline (Table 2). Shaded areas indicate 95% CIs.
Figure 2.
Figure 2.. Monthly Trends in Outpatient Visits and Prescriptions After Loss of a Primary Care Physician (PCP), by Solo vs Group Practice
A, Absolute change in monthly PCP visits among patients whose PCP exited vs those whose PCP did not exit, stratified into those in a solo or group PCP practice. B, Absolute change in monthly specialist visits among patients whose PCP exited vs those whose PCP did not exit, stratified into those in a solo or group PCP practice. C, Absolute change in number of medications prescribed among patients whose PCP exited vs those whose PCP did not exit, stratified into those in a solo or group PCP practice. D, Absolute change in number of medications for chronic illness prescribed among patients whose PCP exited vs those whose PCP did not exit, stratified into those in a solo or group PCP practice. Absolute risk differences are relative to 12 months before PCP exit. Exiting PCPs were matched to nonexiting PCPs as described in the Methods. Month 0 (vertical dotted line) includes the last month an exiting PCP was observed practicing. Overall, beneficiaries had a mean of 0.4 primary care visits, 0.8 specialty visits, 1.5 filled prescriptions, and 0.6 filled prescriptions for chronic illness per month at baseline (Table 2). Shaded areas indicate 95% CIs.

References

    1. Rodriguez KL, Bayliss NK, Alexander SC, et al. Effect of patient and patient-oncologist relationship characteristics on communication about health-related quality of life. Psychooncology. 2011;20(9):935-942. doi: 10.1002/pon.1829 - DOI - PMC - PubMed
    1. Chanfreau-Coffinier C, Washington DL, Chuang E, et al. Exploring the association of care fragmentation and patient ratings of care quality: a mediation analysis of women veterans’ experience with VA care. Health Serv Res. 2019;54(4):816-826. doi: 10.1111/1475-6773.13153 - DOI - PMC - PubMed
    1. Rodriguez HP, Rogers WH, Marshall RE, Safran DG. The effects of primary care physician visit continuity on patients’ experiences with care. J Gen Intern Med. 2007;22(6):787-793. doi: 10.1007/s11606-007-0182-8 - DOI - PMC - PubMed
    1. Mainous AG III, Kern D, Hainer B, Kneuper-Hall R, Stephens J, Geesey ME. The relationship between continuity of care and trust with stage of cancer at diagnosis. Fam Med. 2004;36(1):35-39. - PubMed
    1. Katz DA, McCoy K, Sarrazin MV. Does improved continuity of primary care affect clinician-patient communication in VA? J Gen Intern Med. 2014;29(suppl 2):S682-S688. doi: 10.1007/s11606-013-2633-8 - DOI - PMC - PubMed

Publication types

MeSH terms