. 2021:2230:169-198.
doi: 10.1007/978-1-0716-1028-2_11.

MicroCT for Scanning and Analysis of Mouse Bones

Affiliations

MicroCT for Scanning and Analysis of Mouse Bones

Yung Kim et al. Methods Mol Biol. 2021.

Abstract

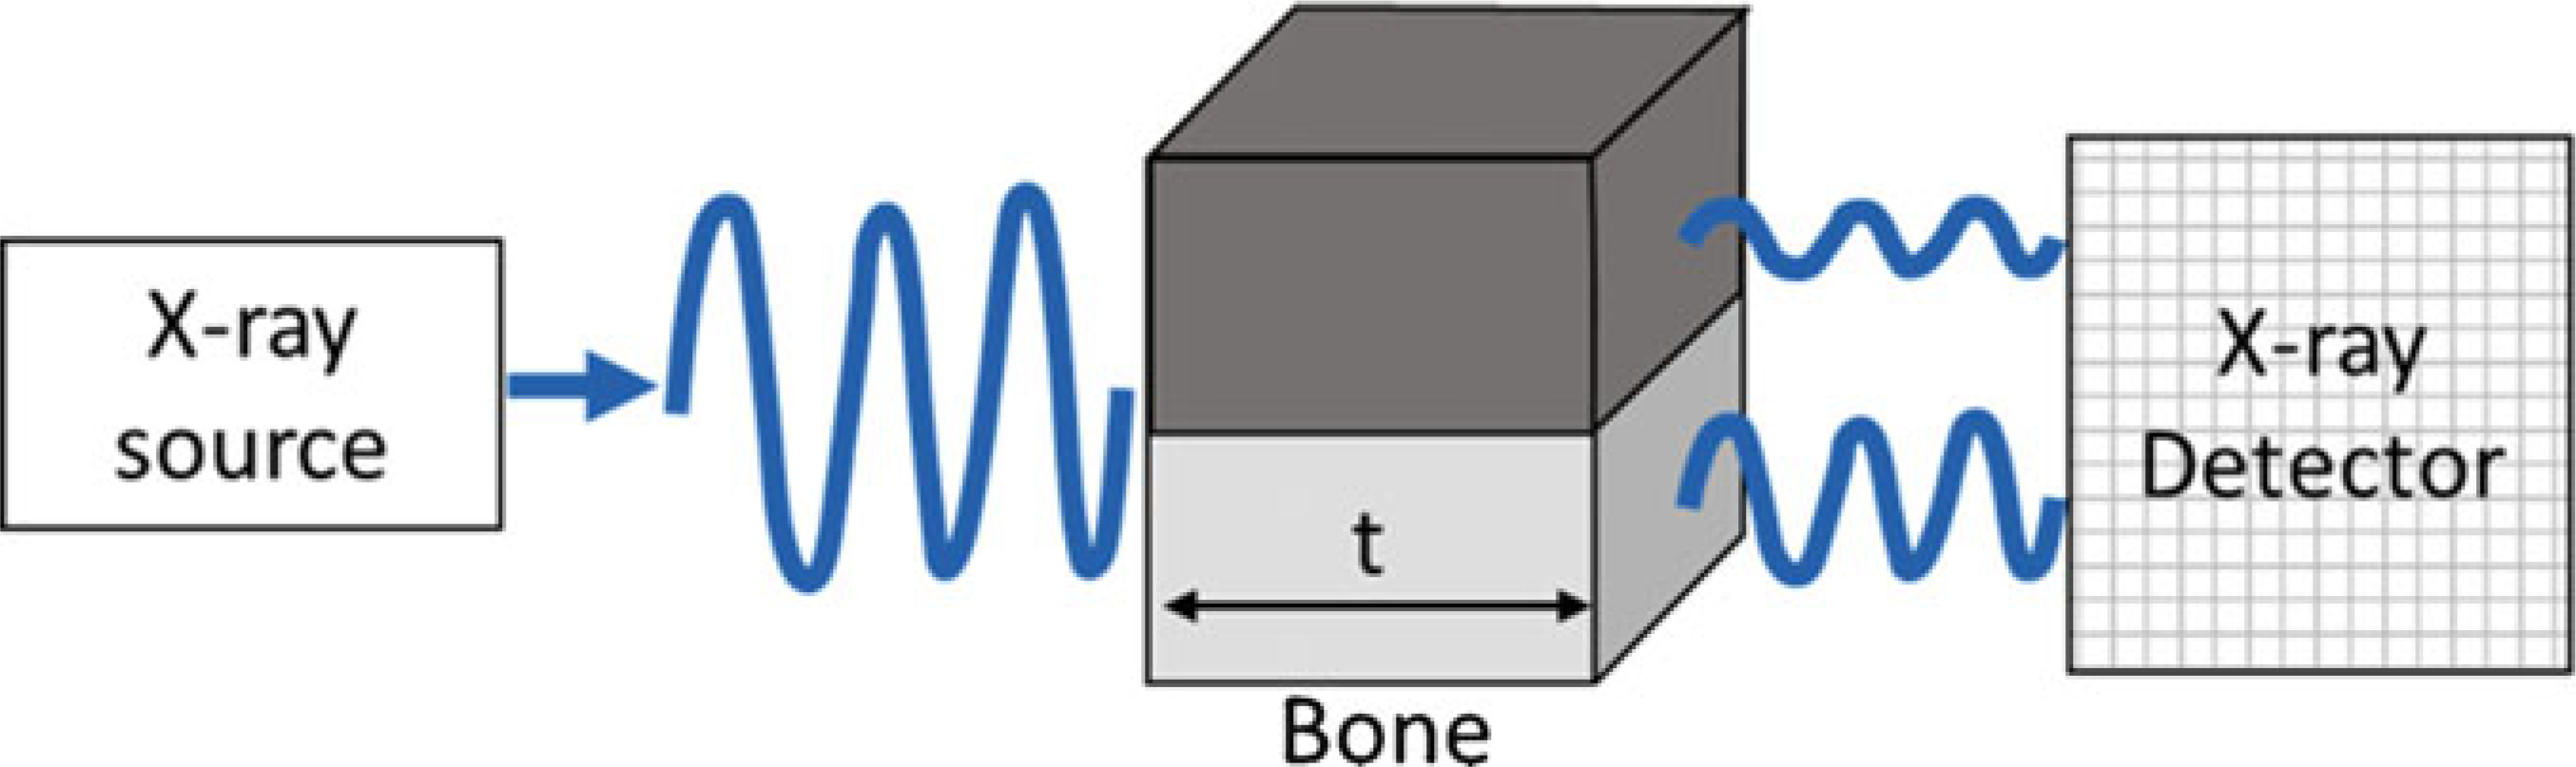
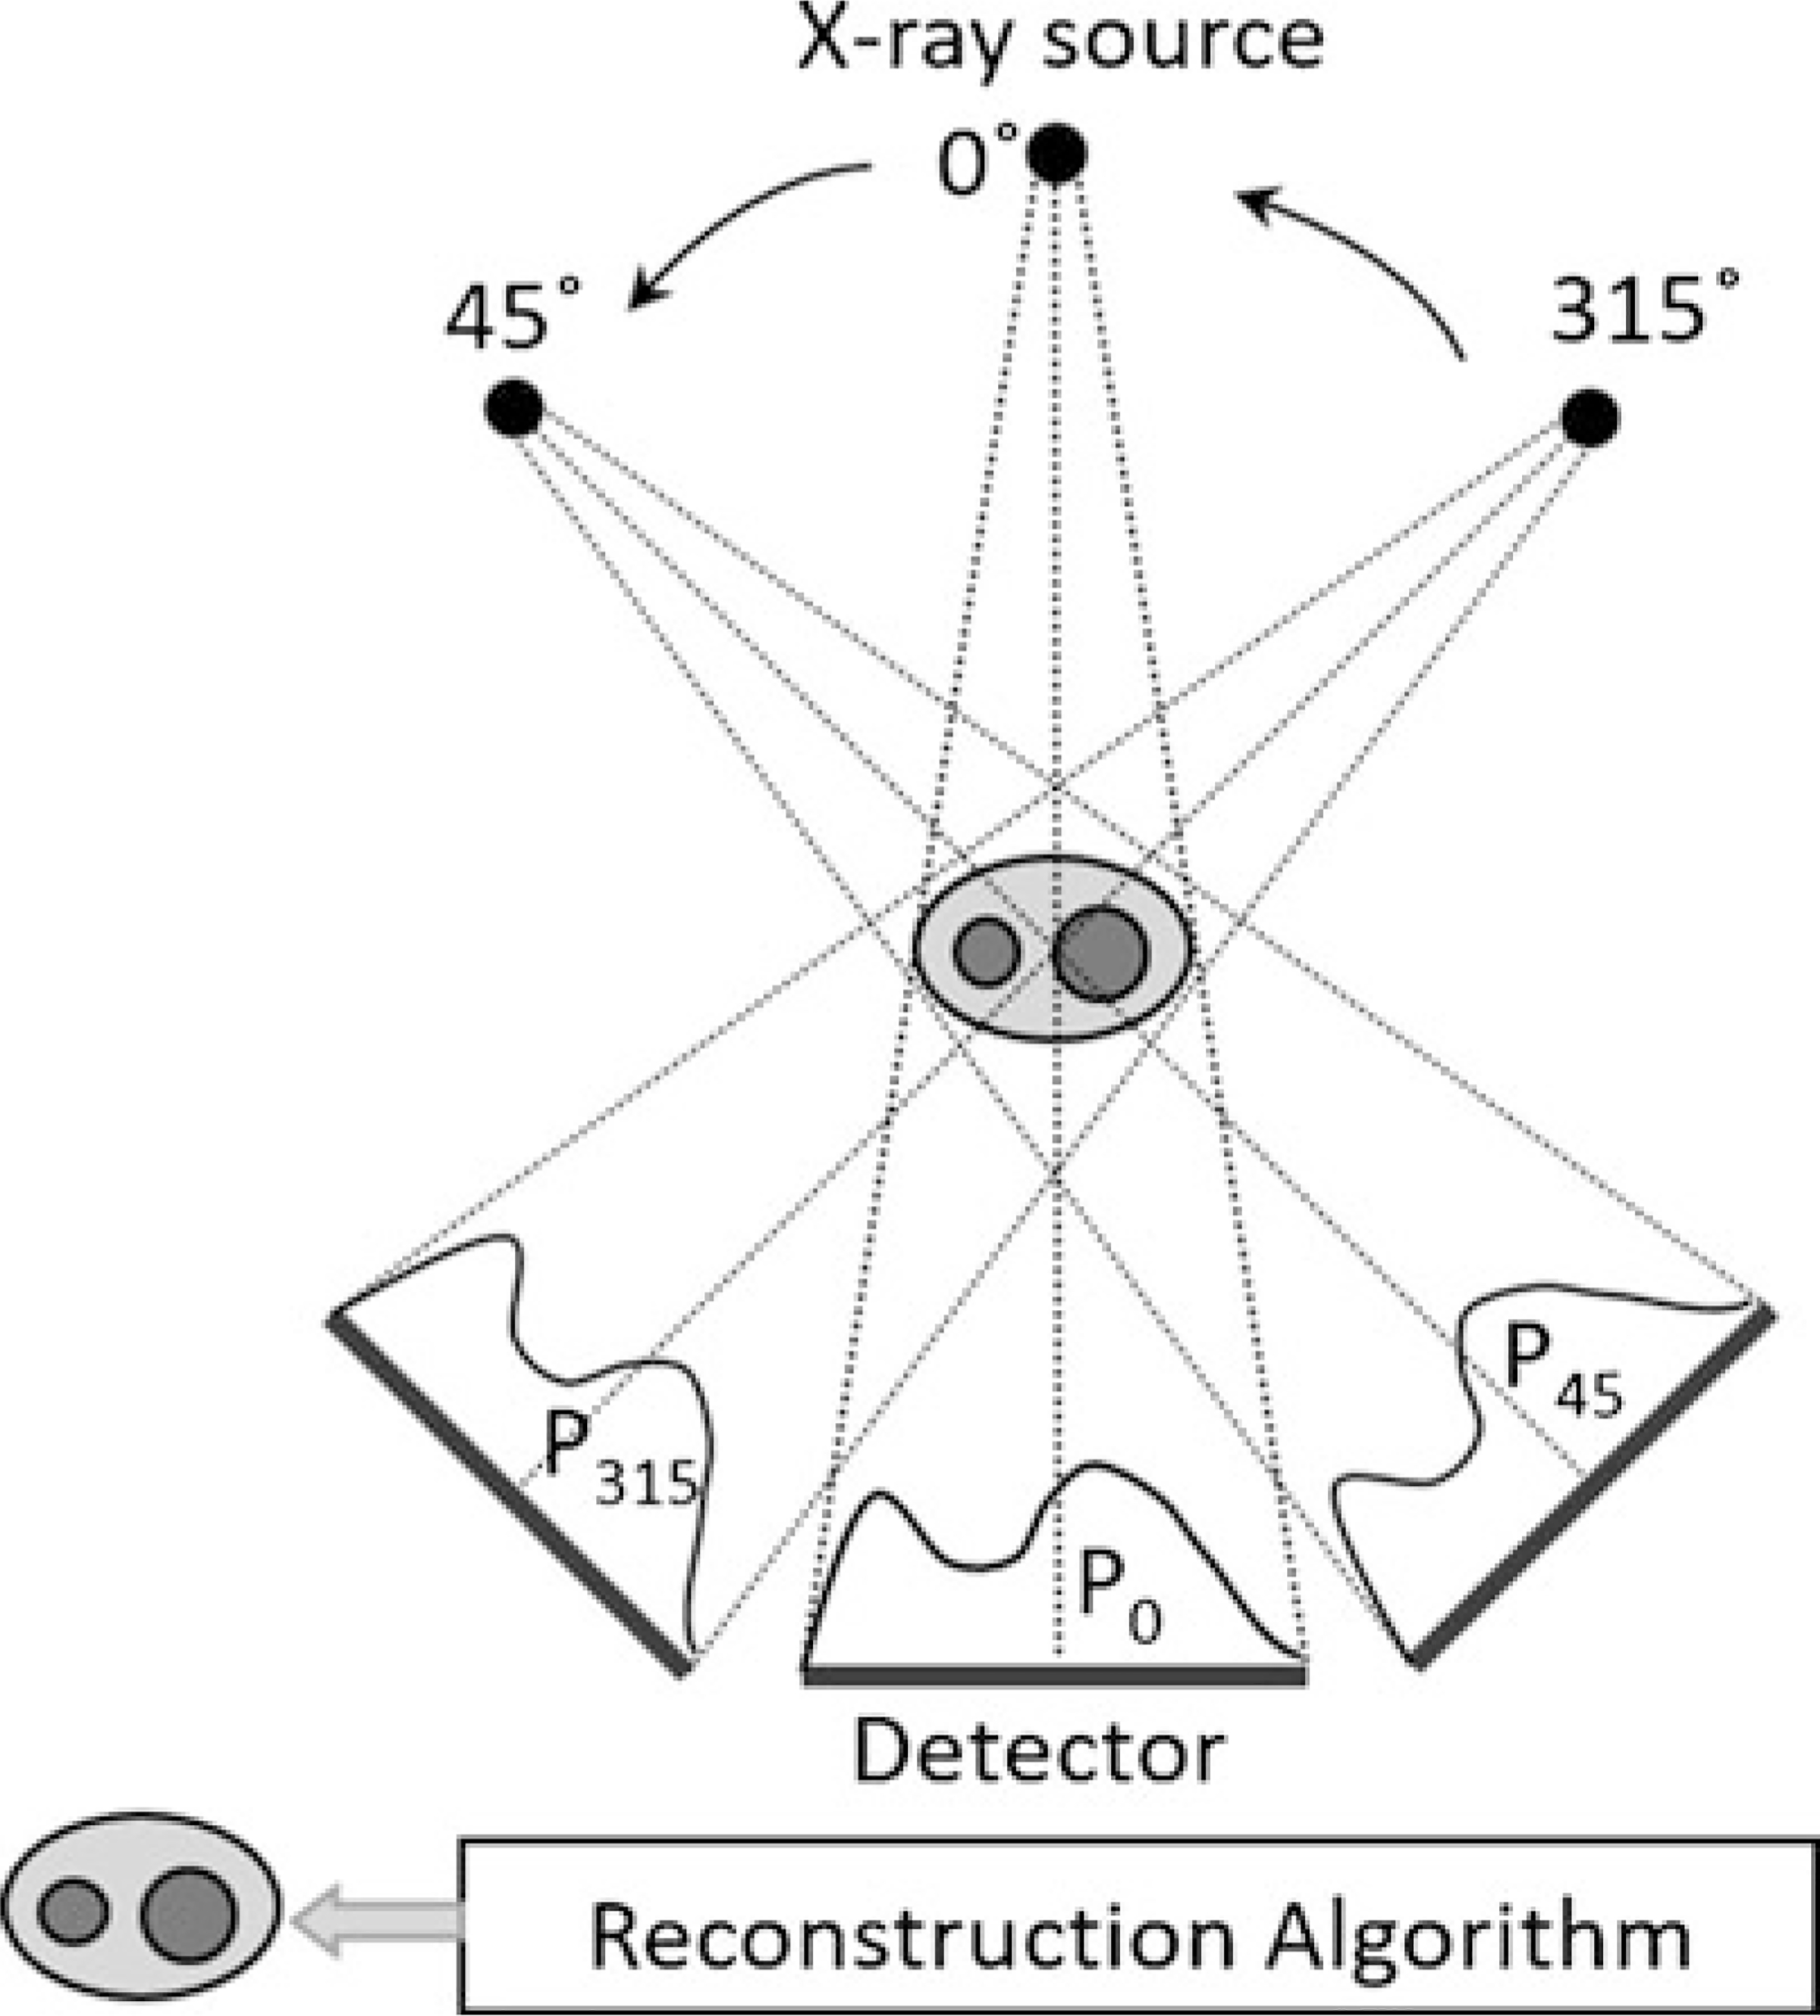
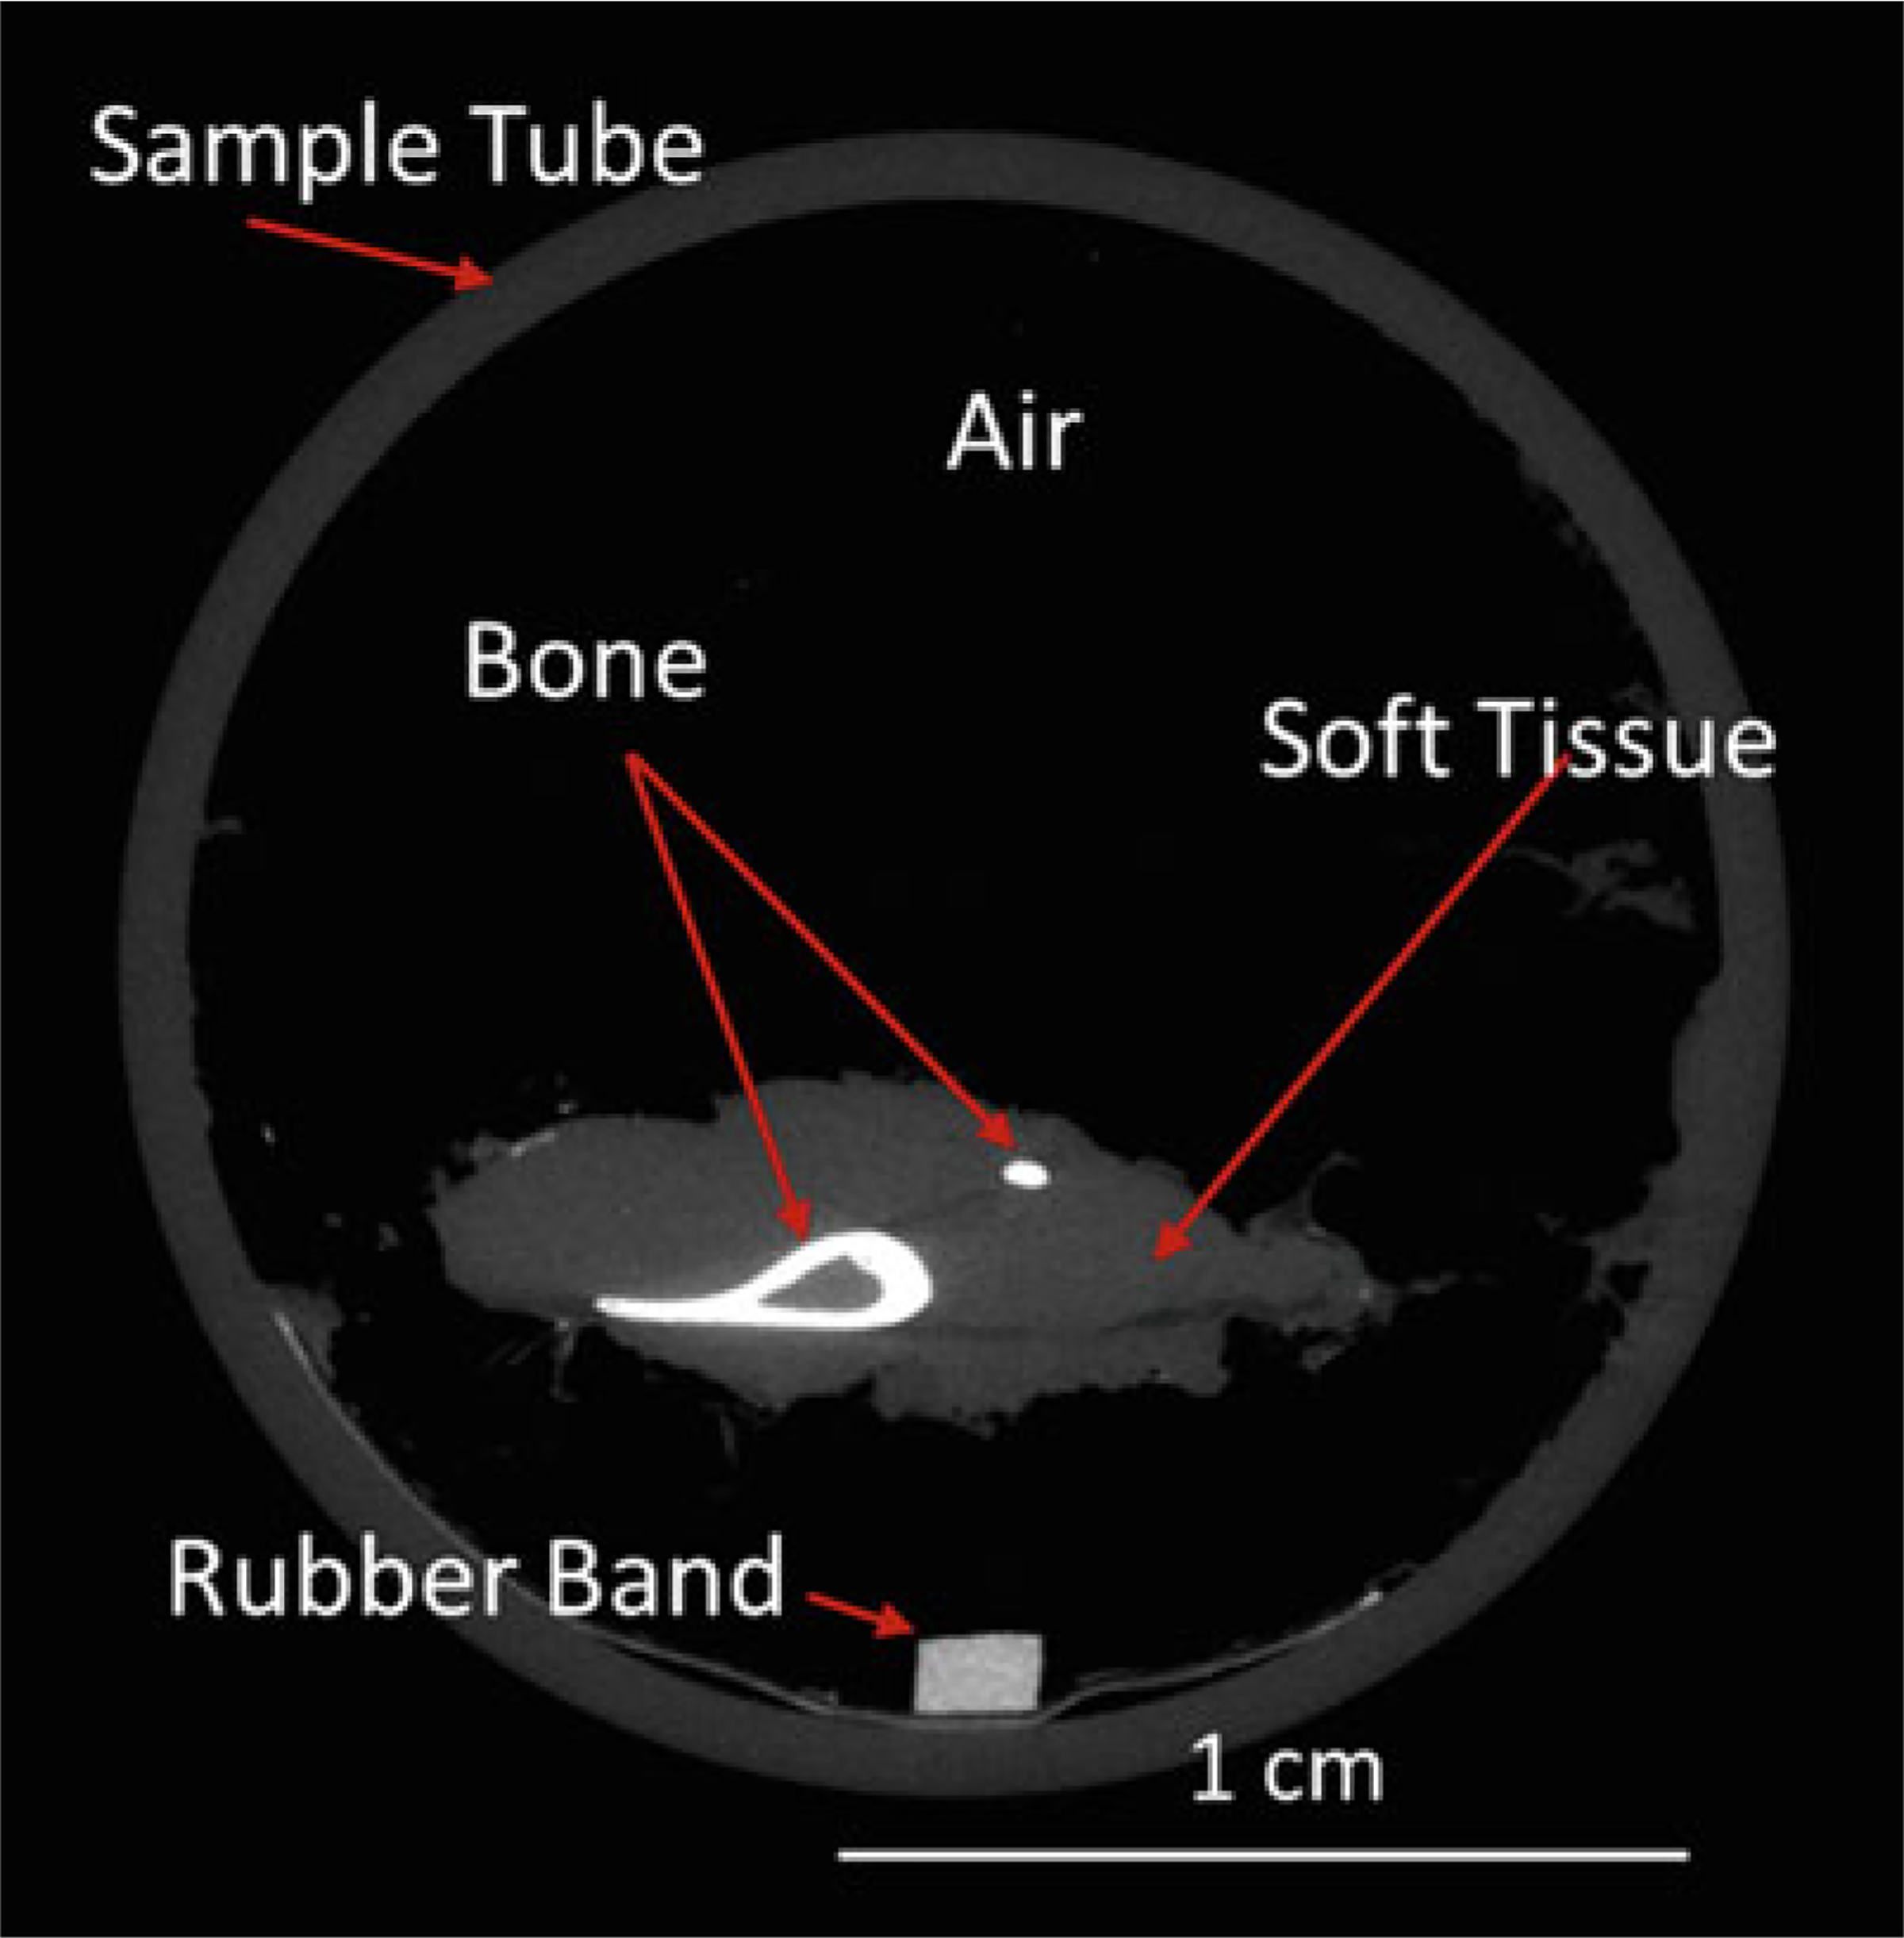
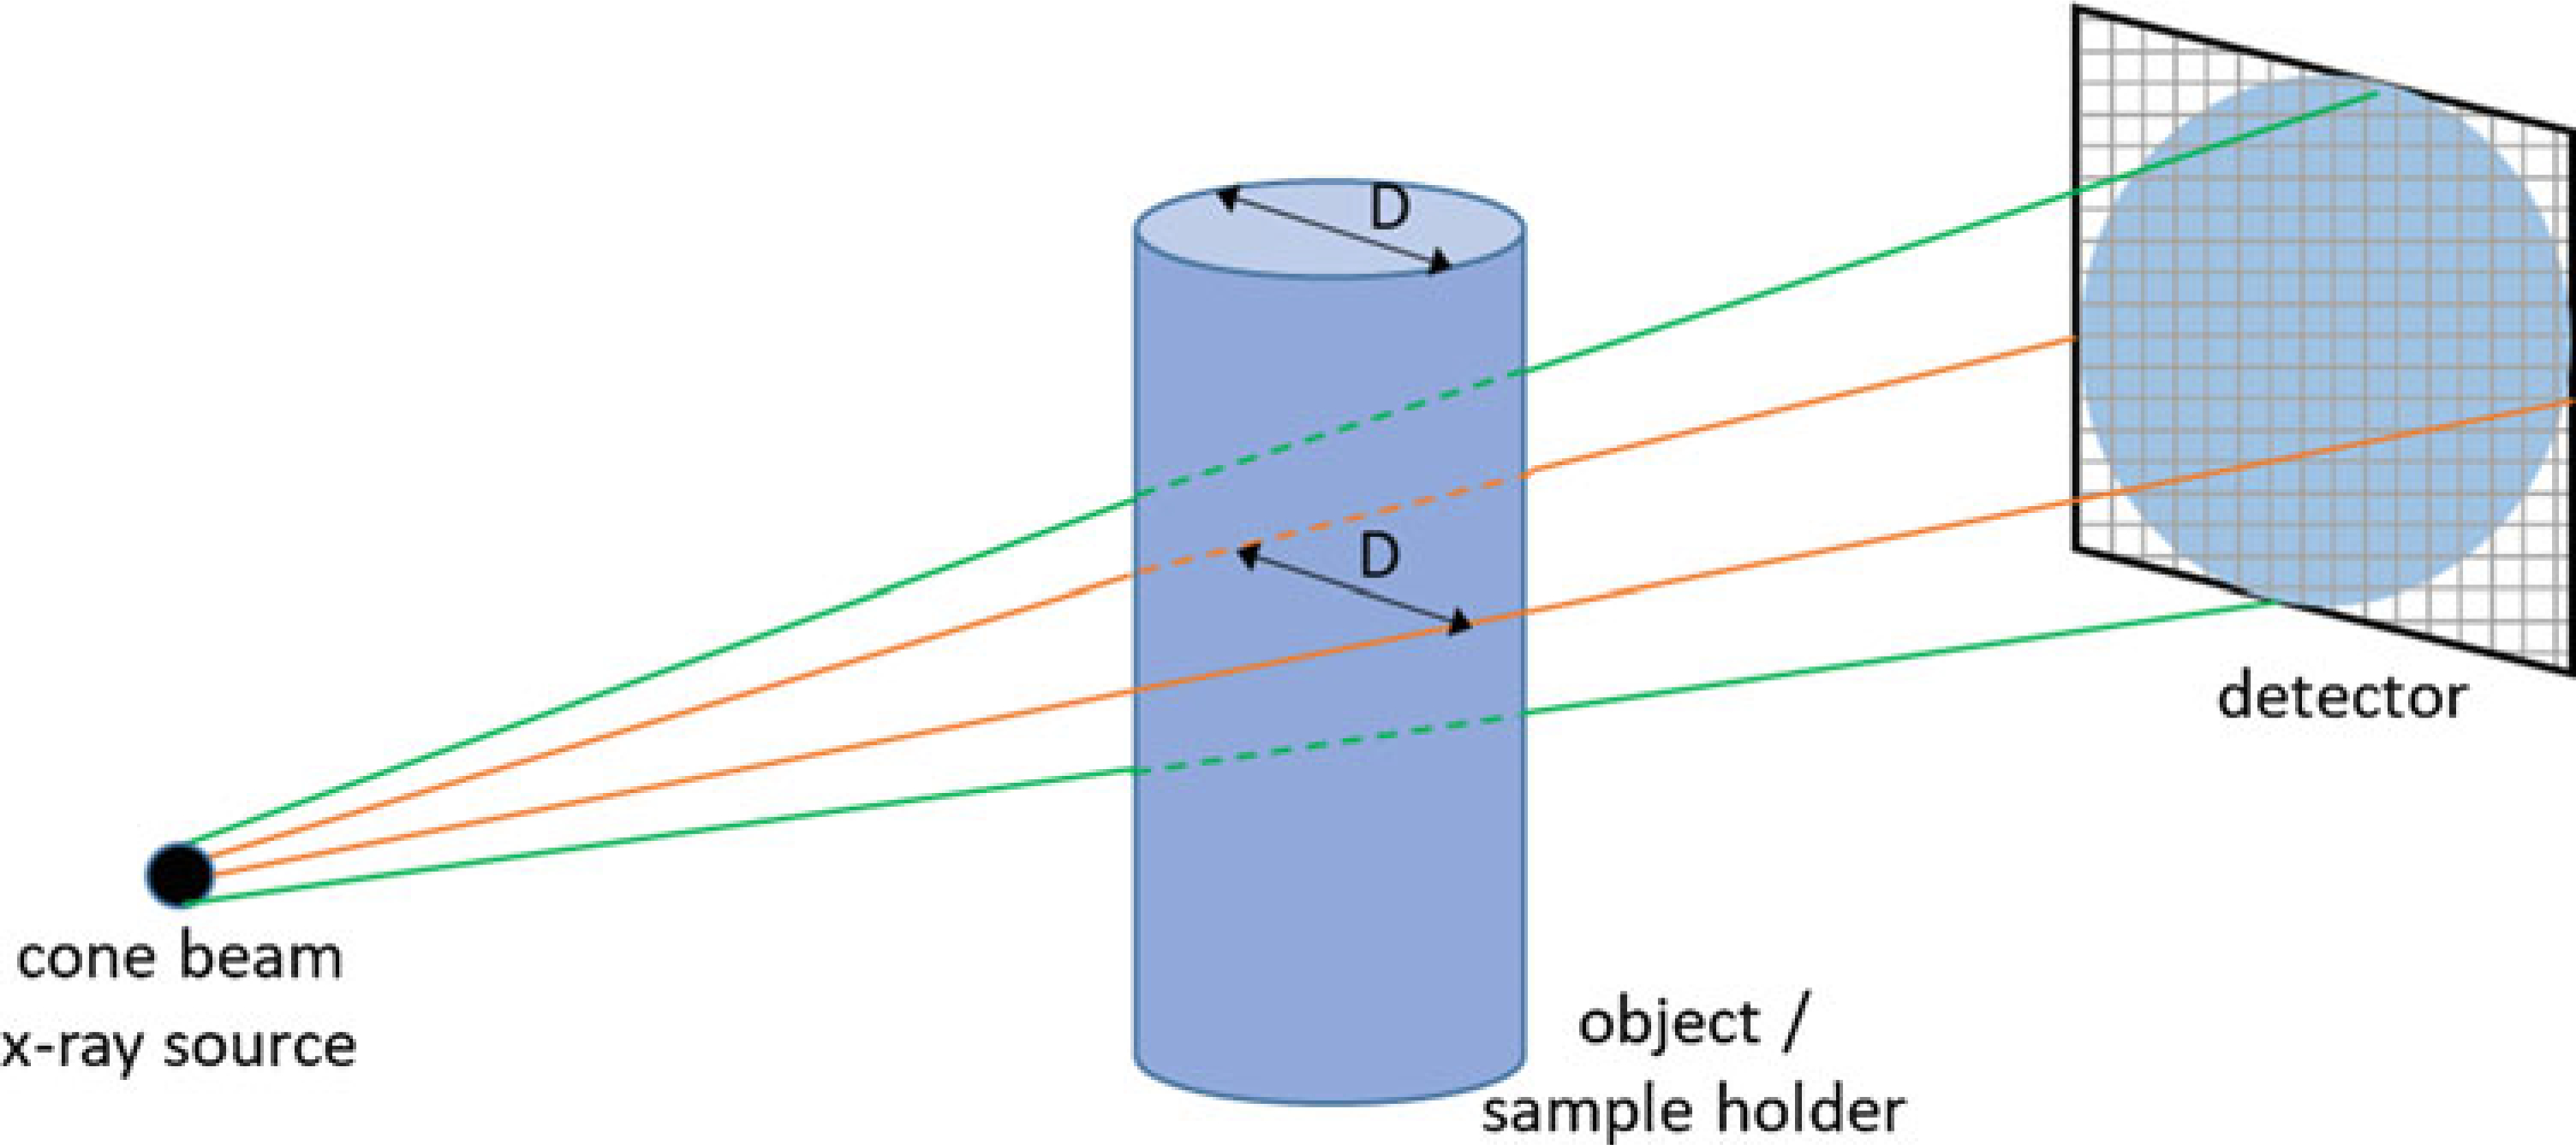
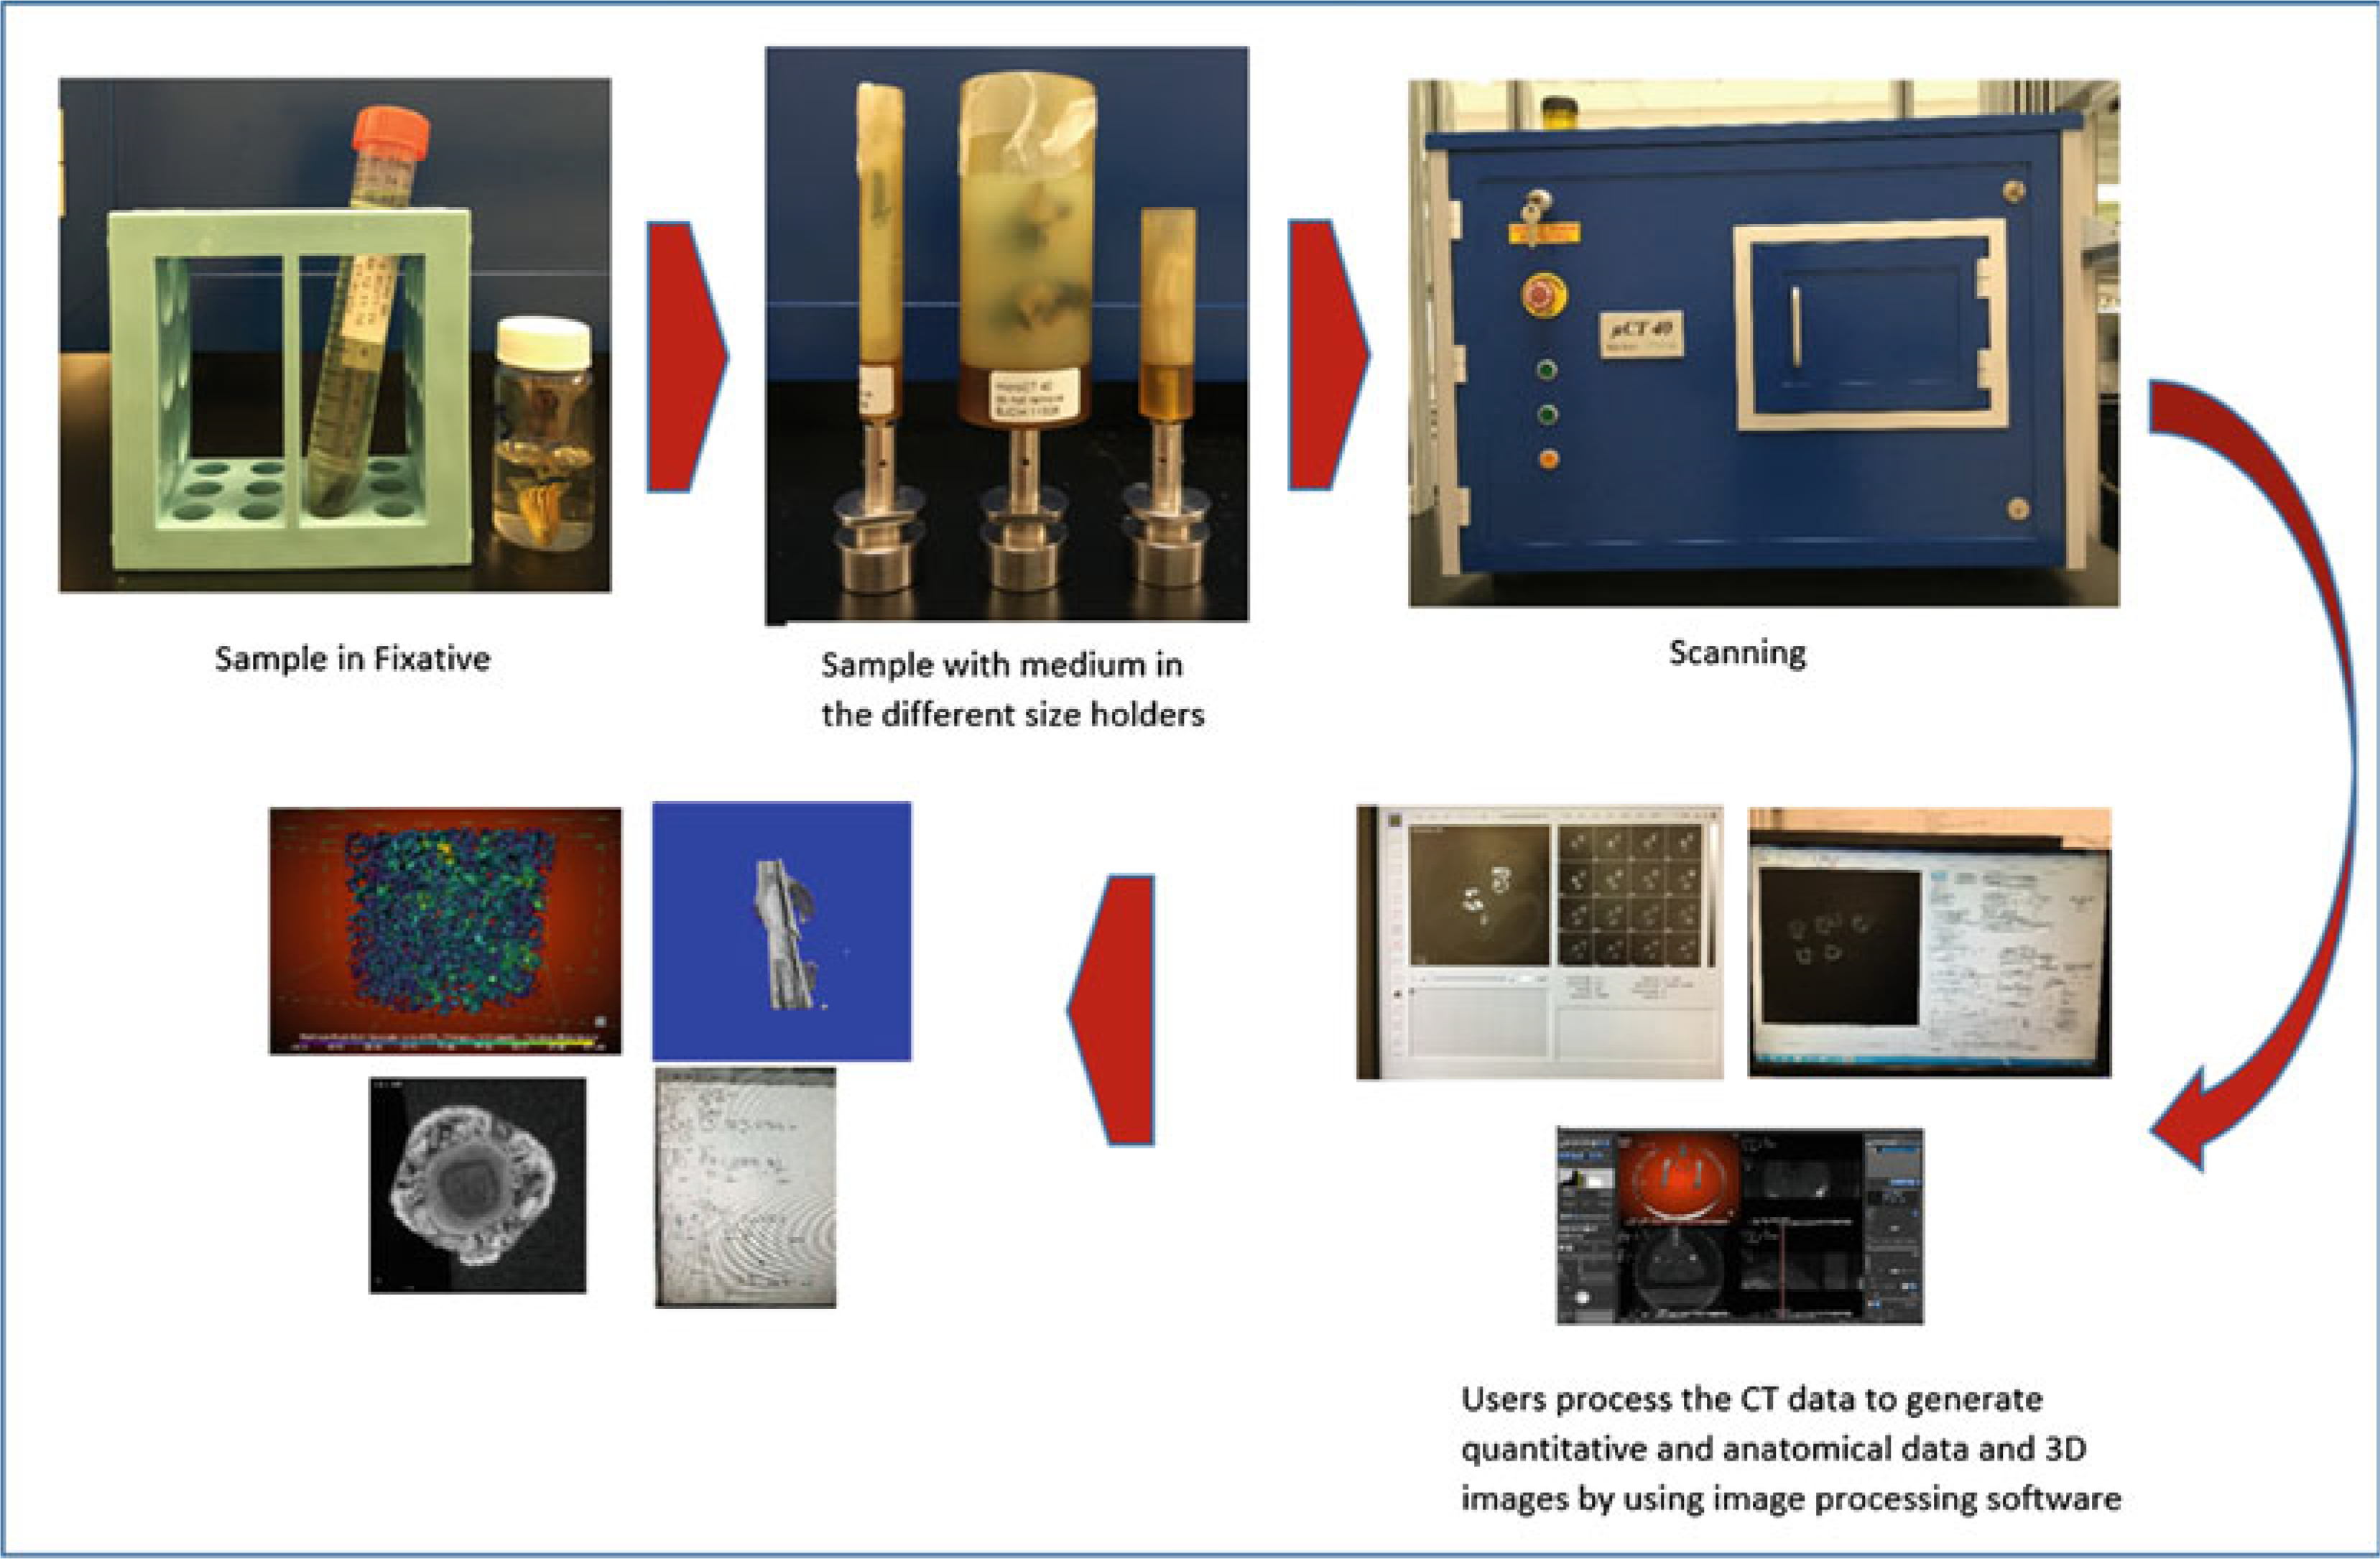
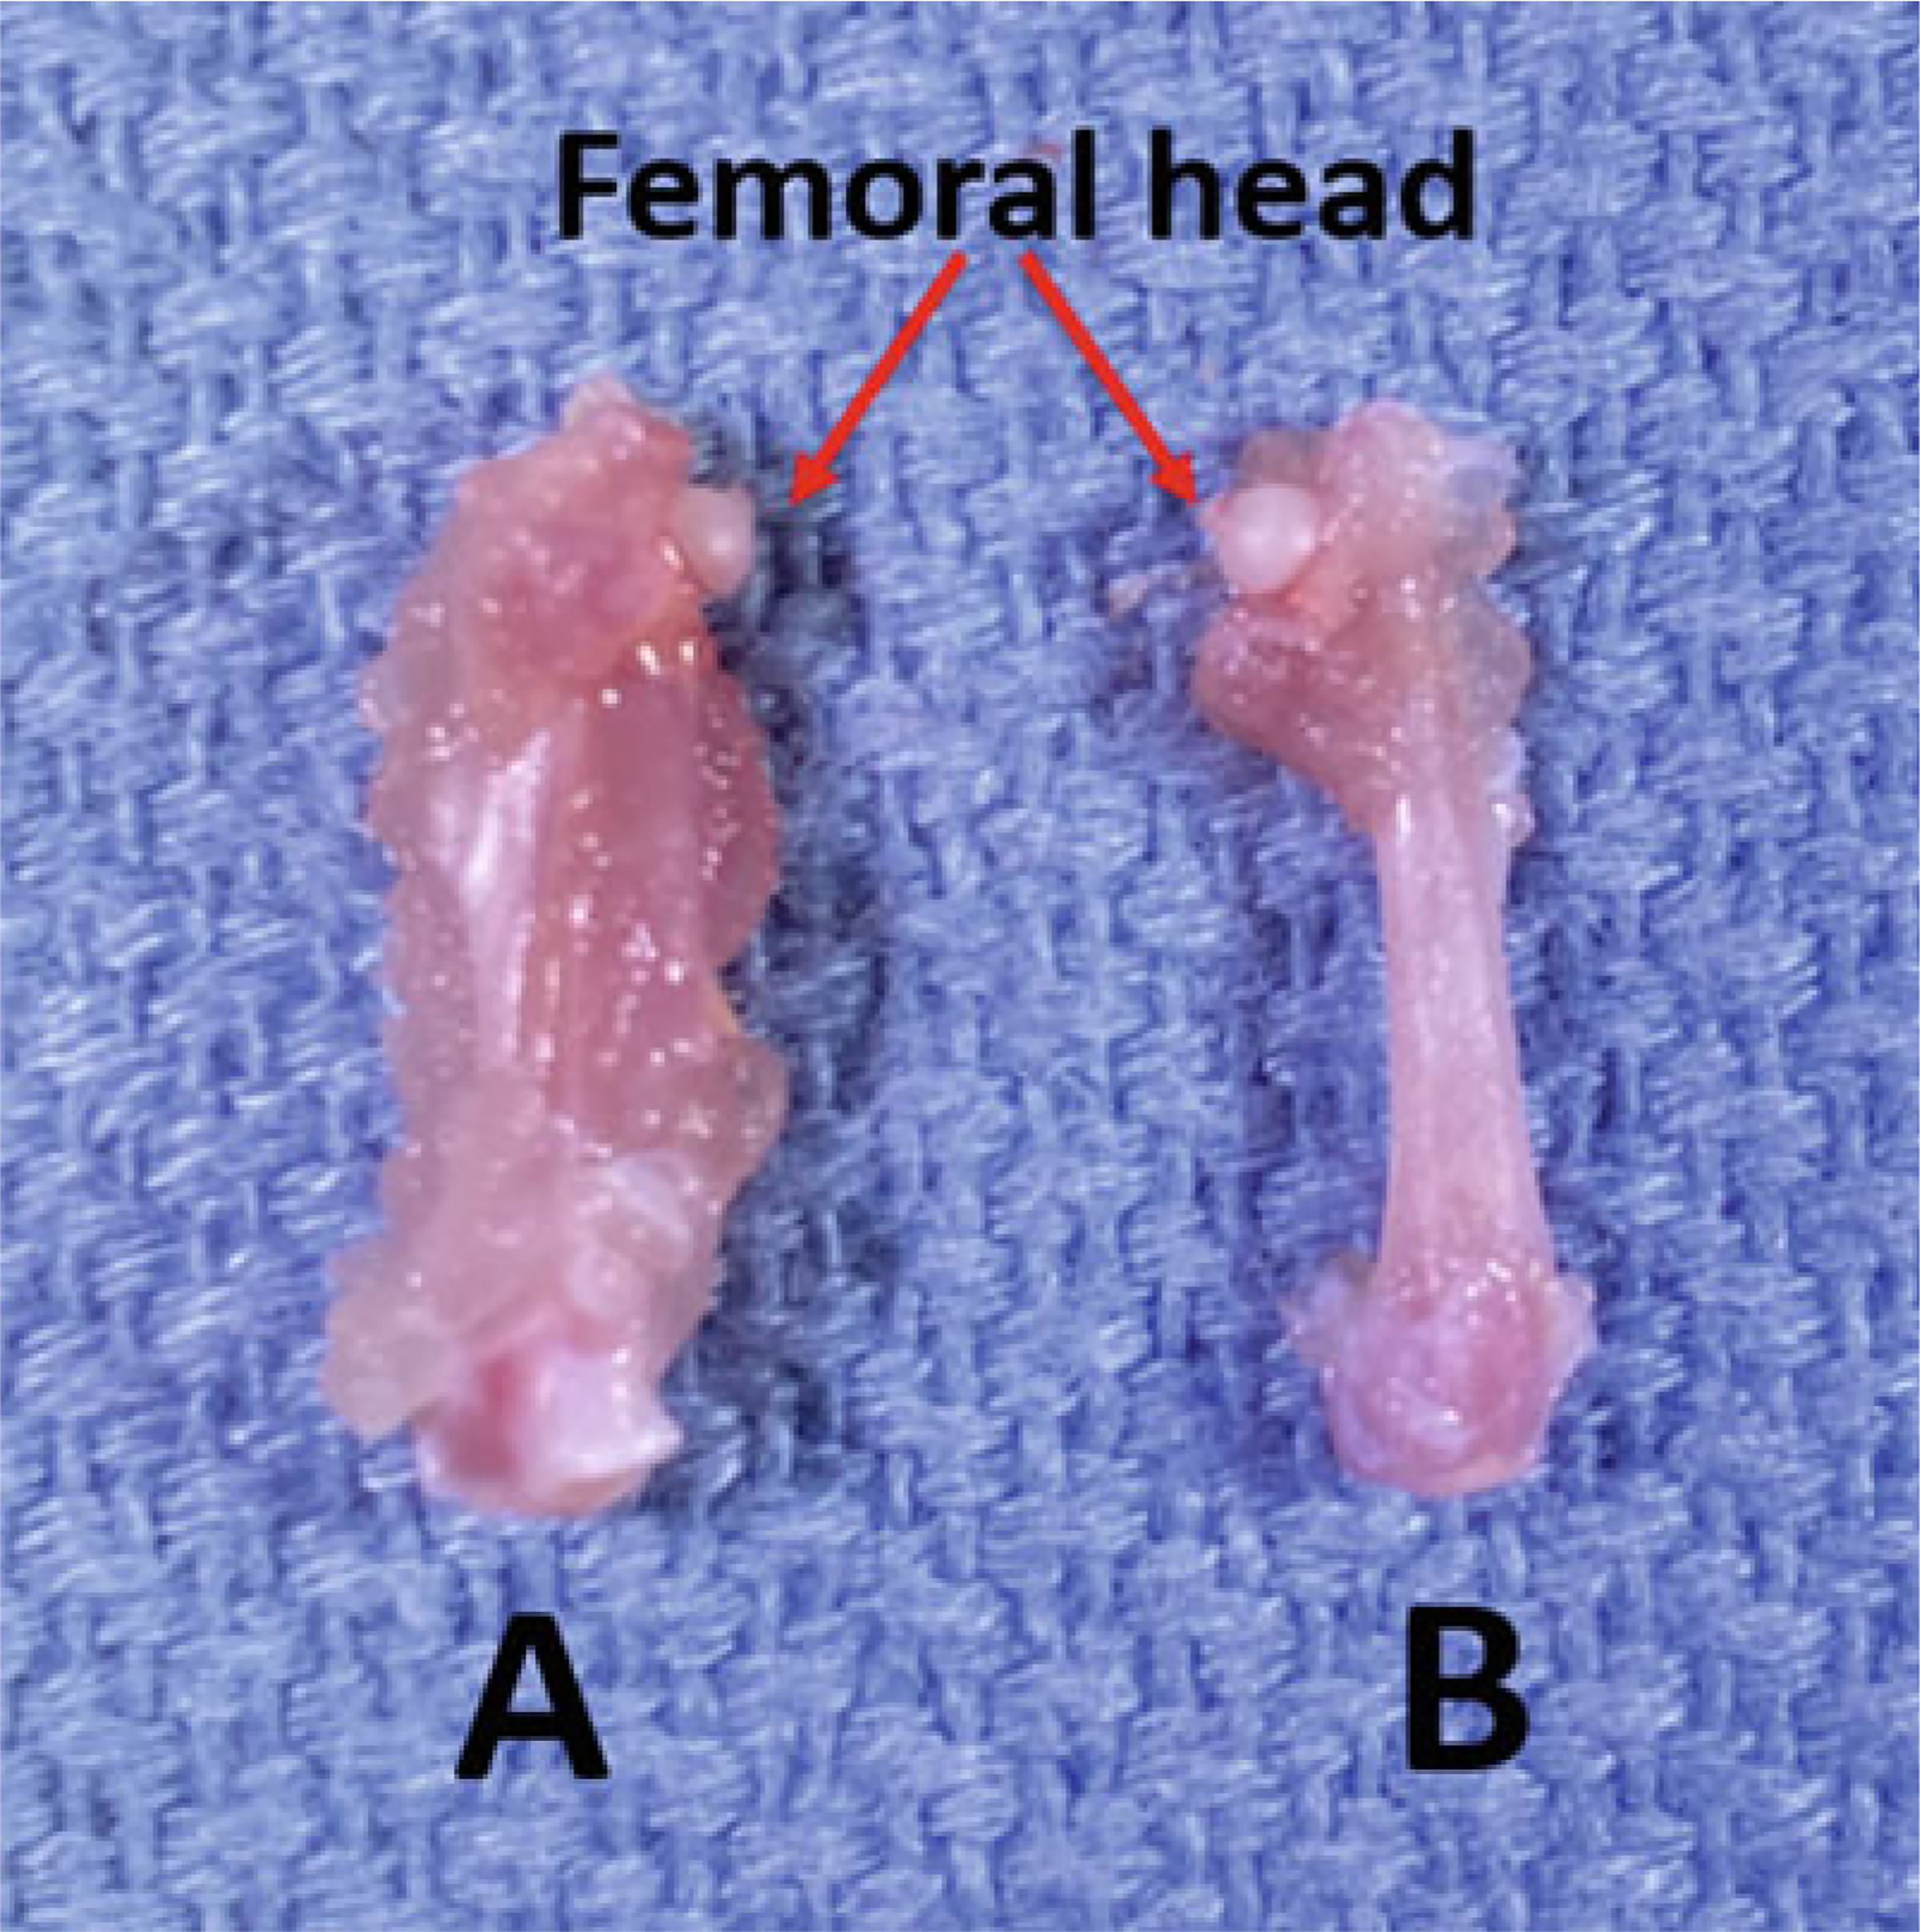
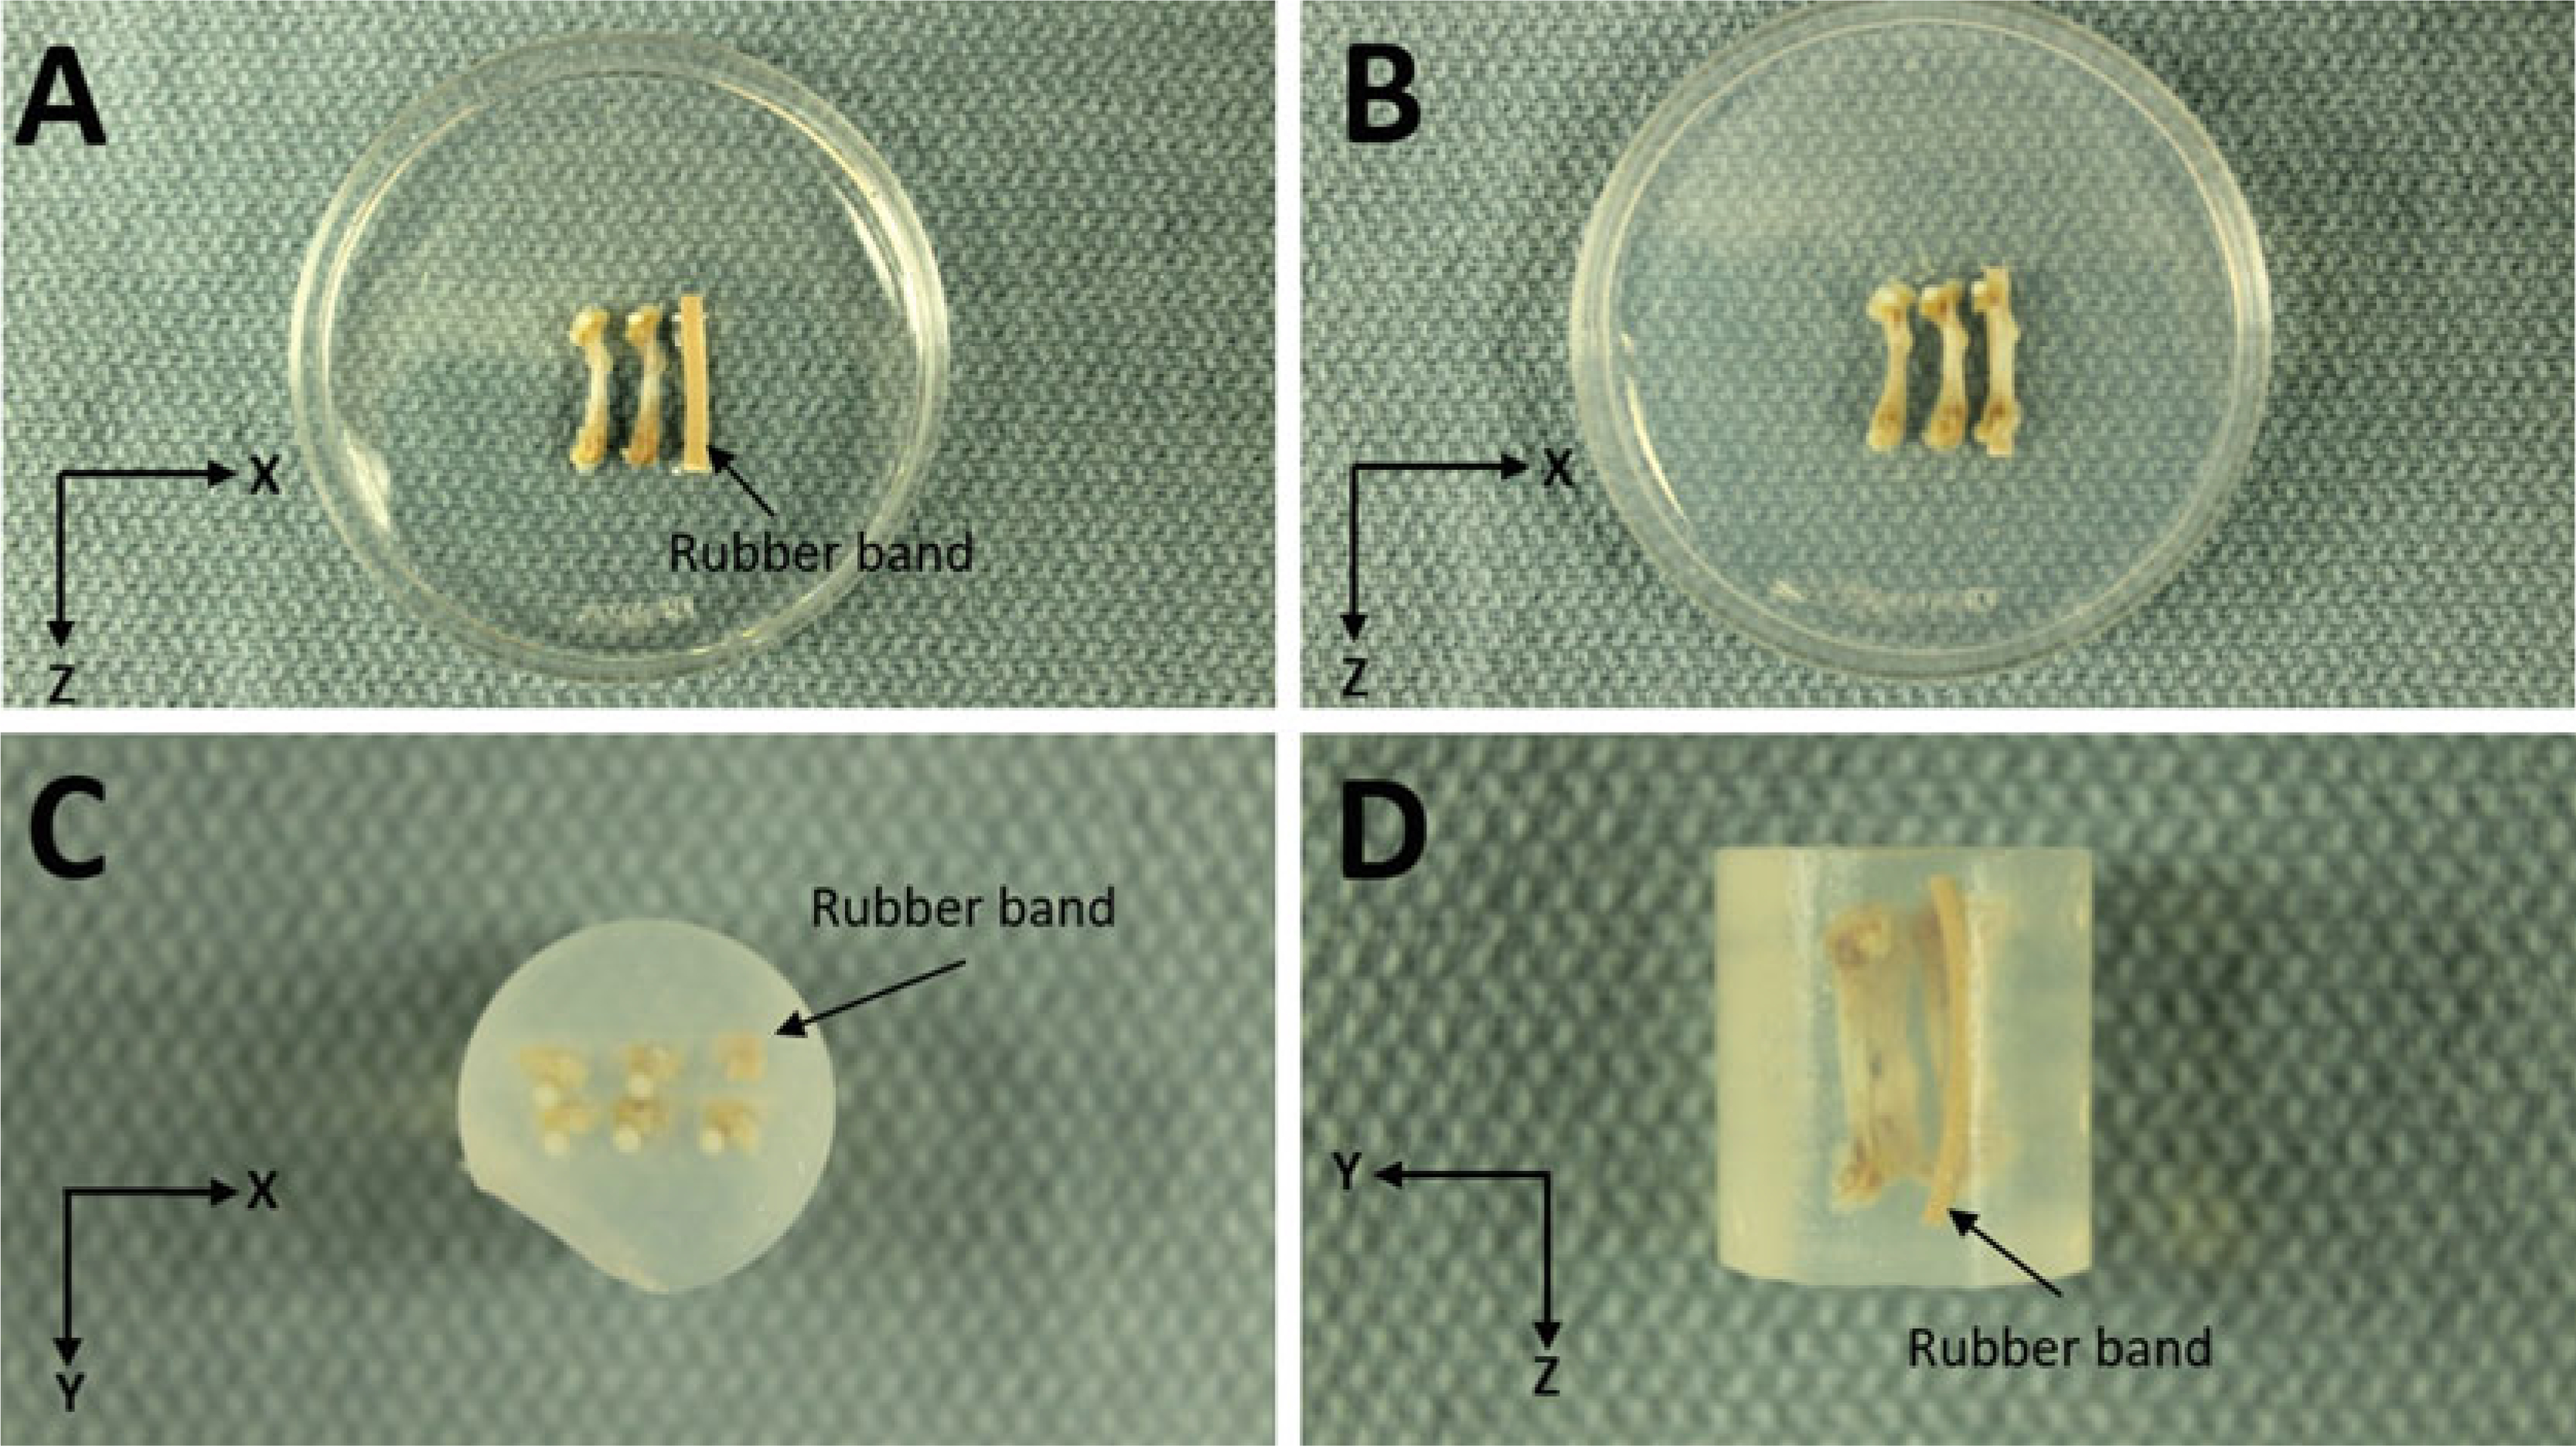
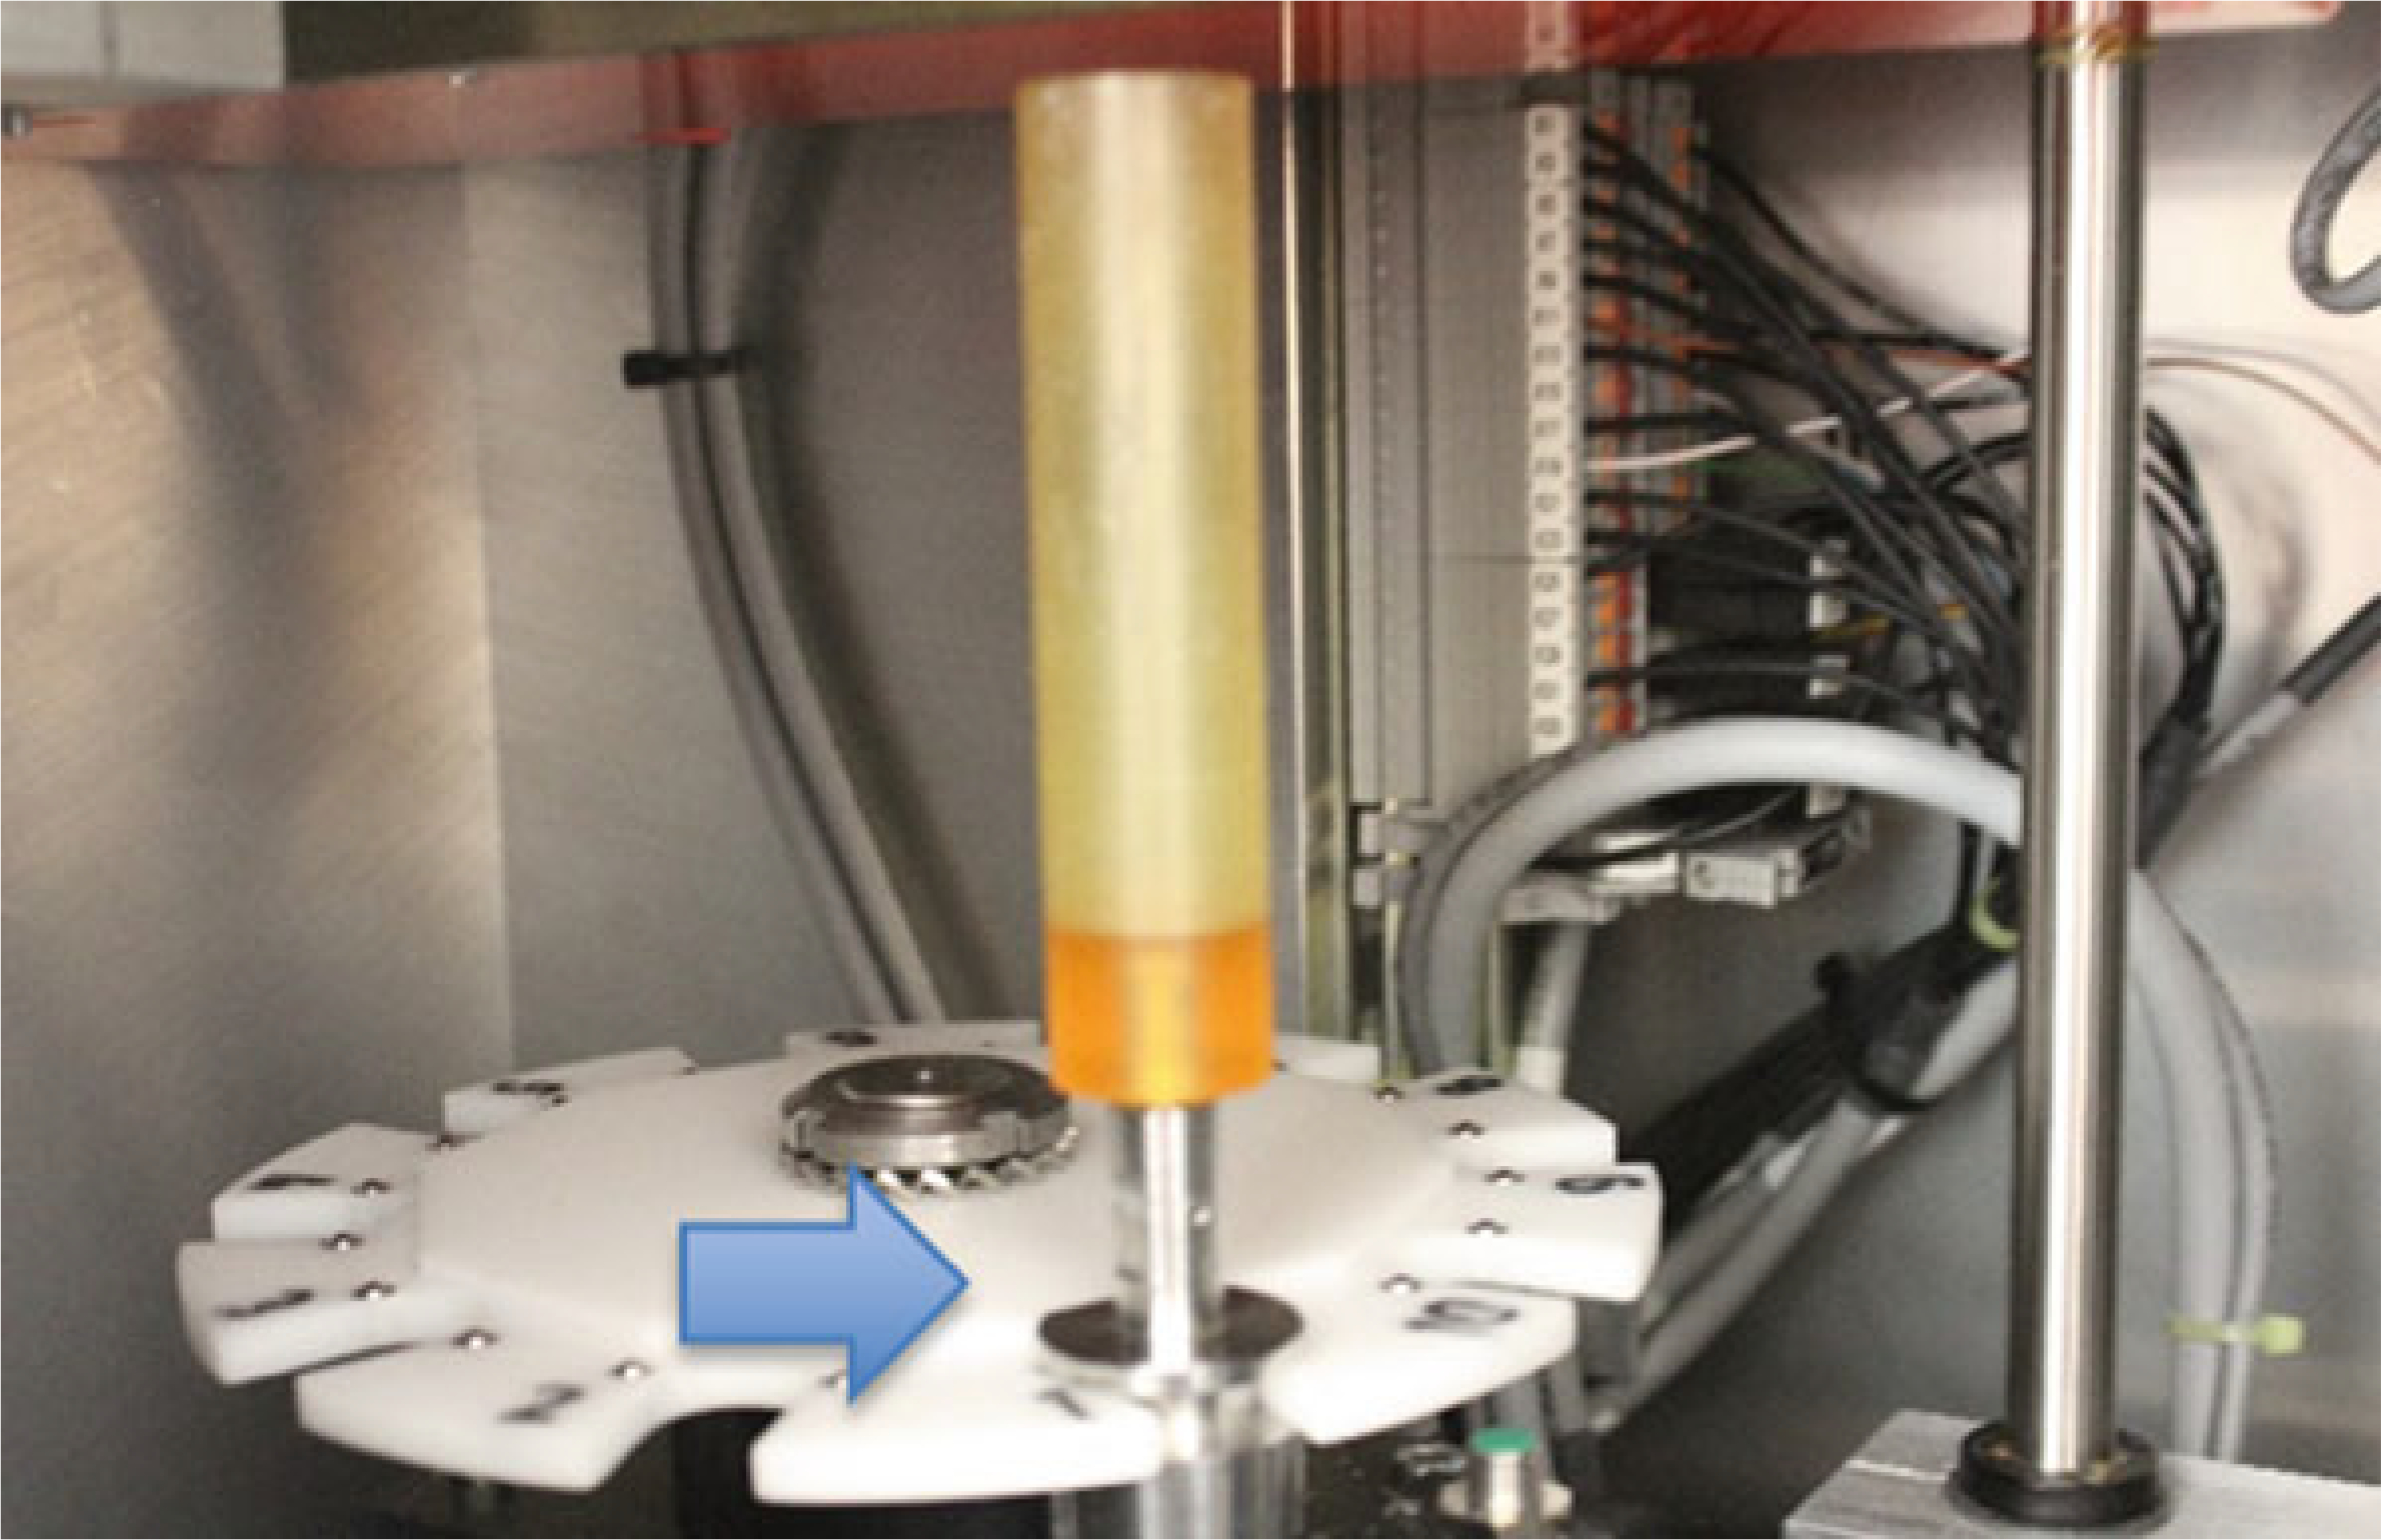
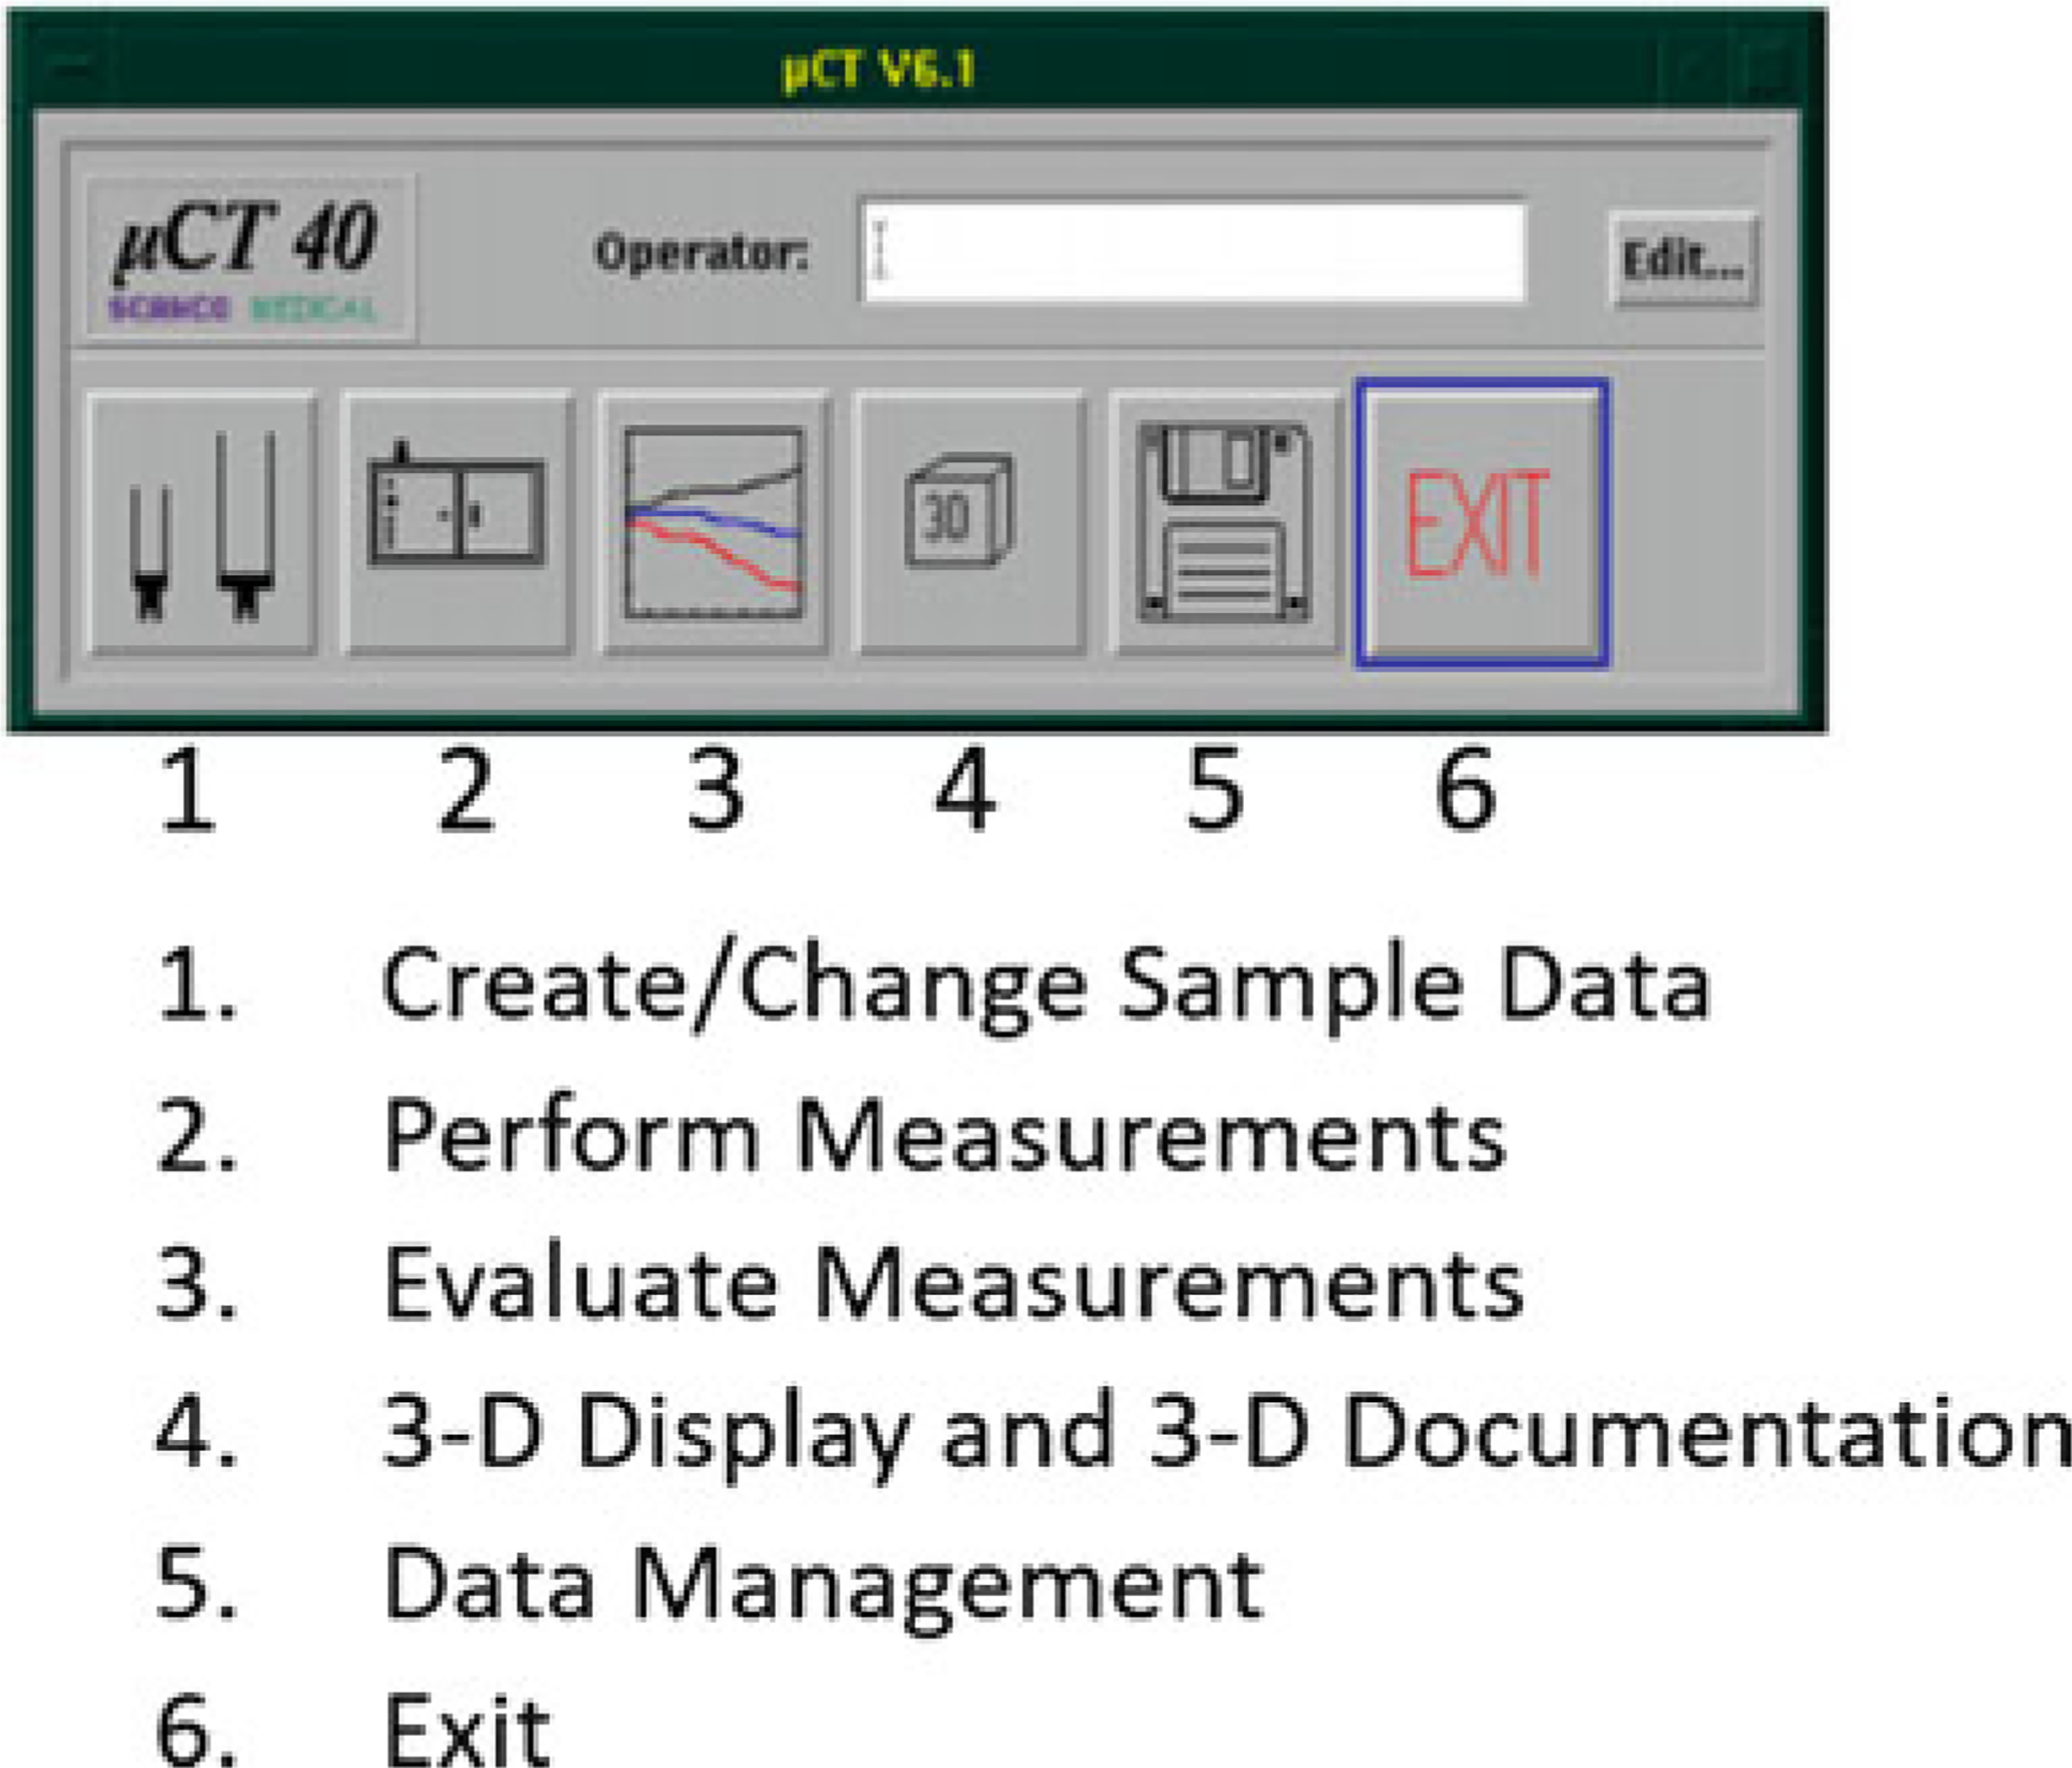
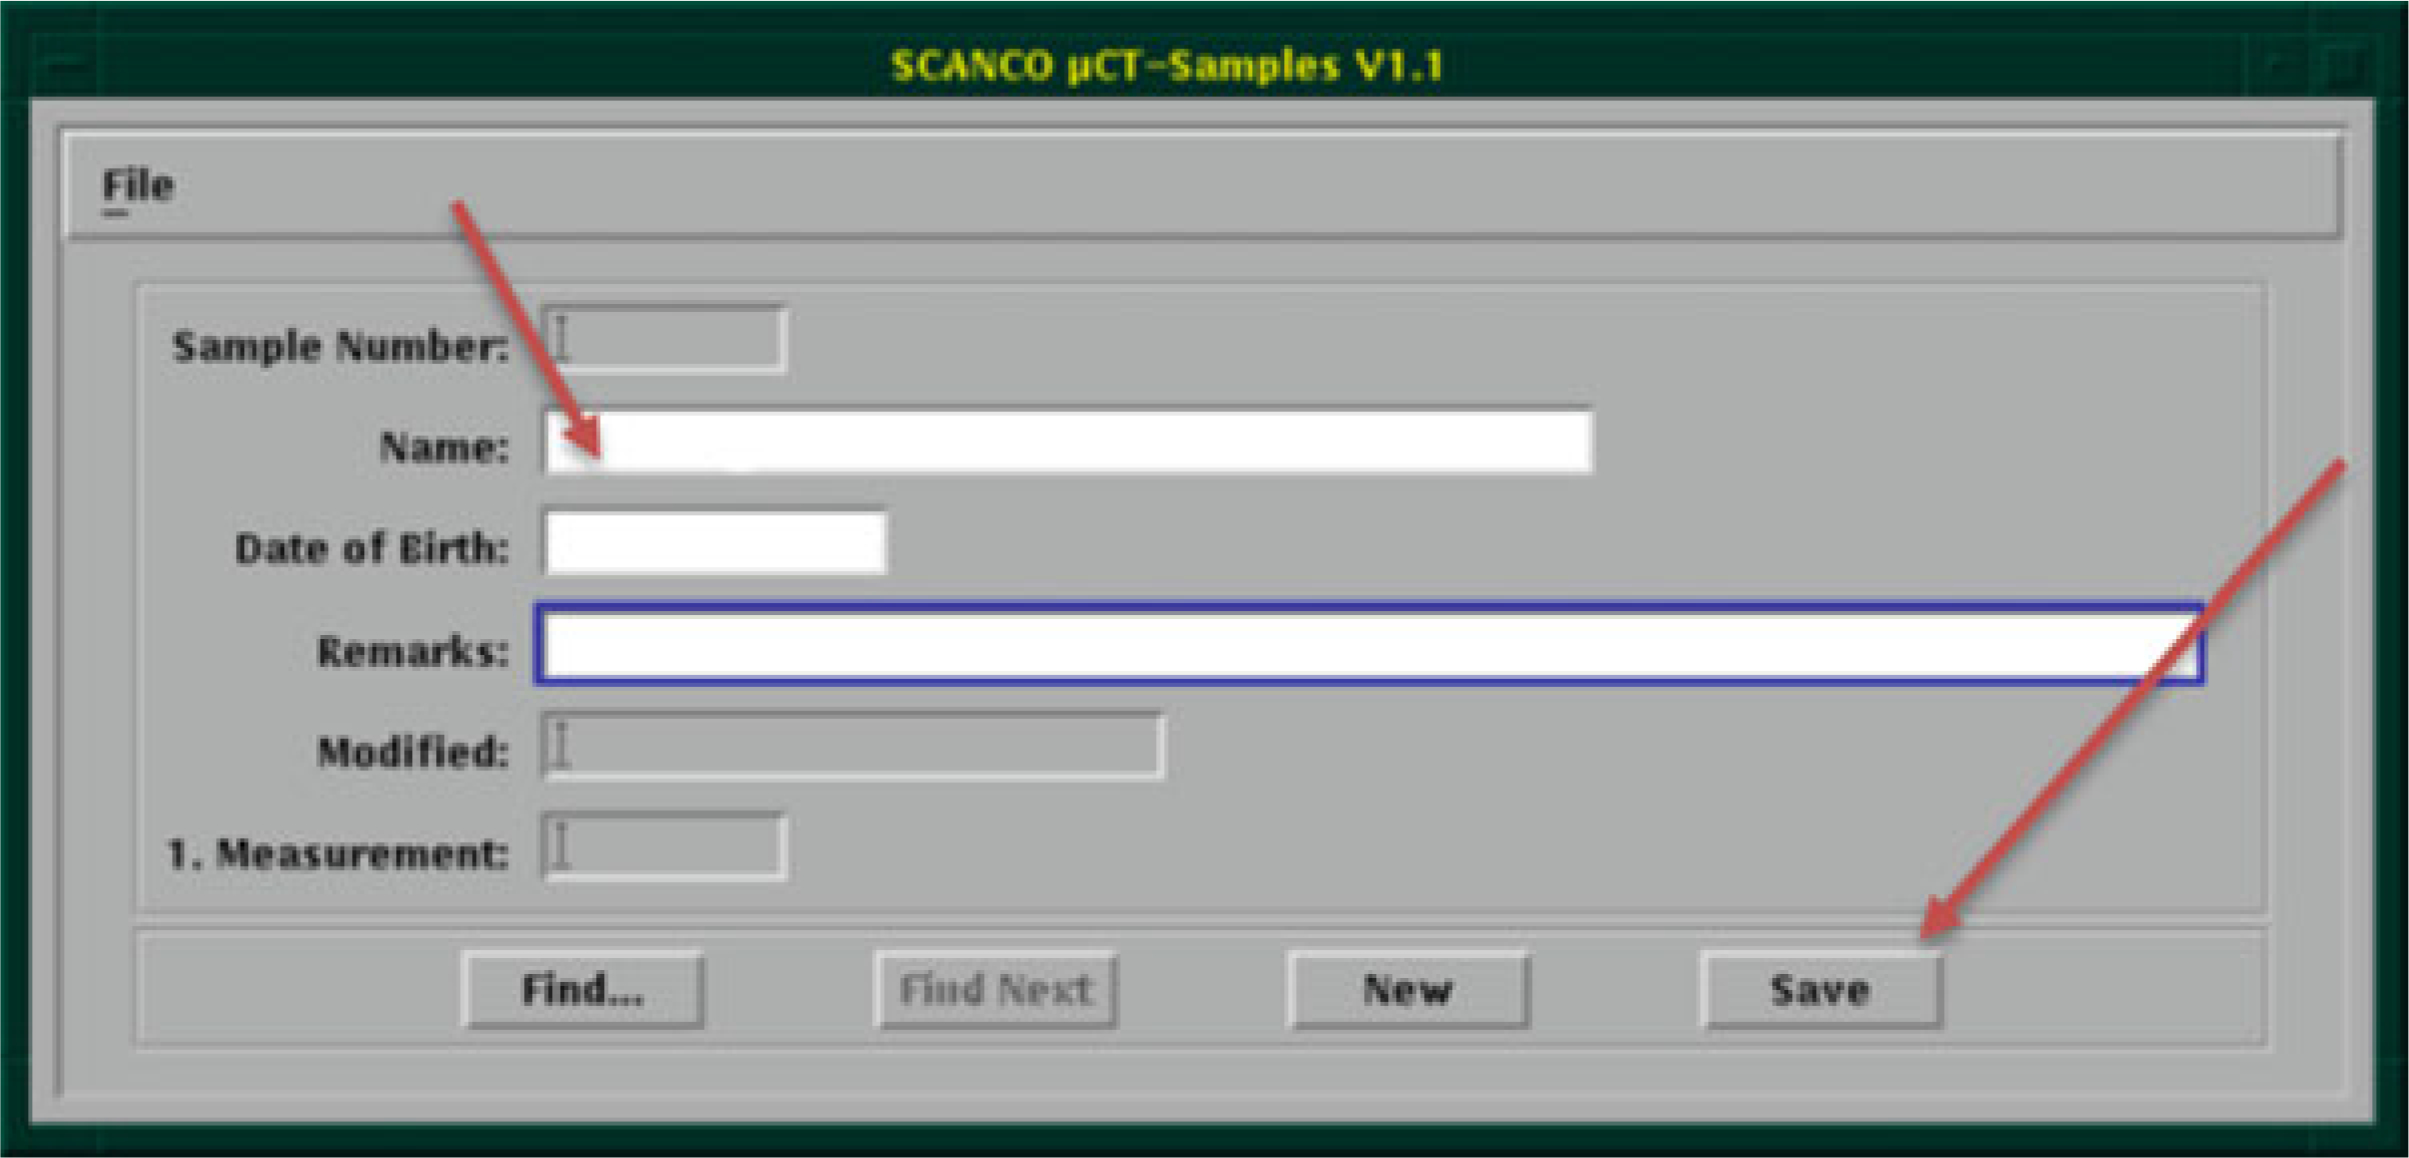
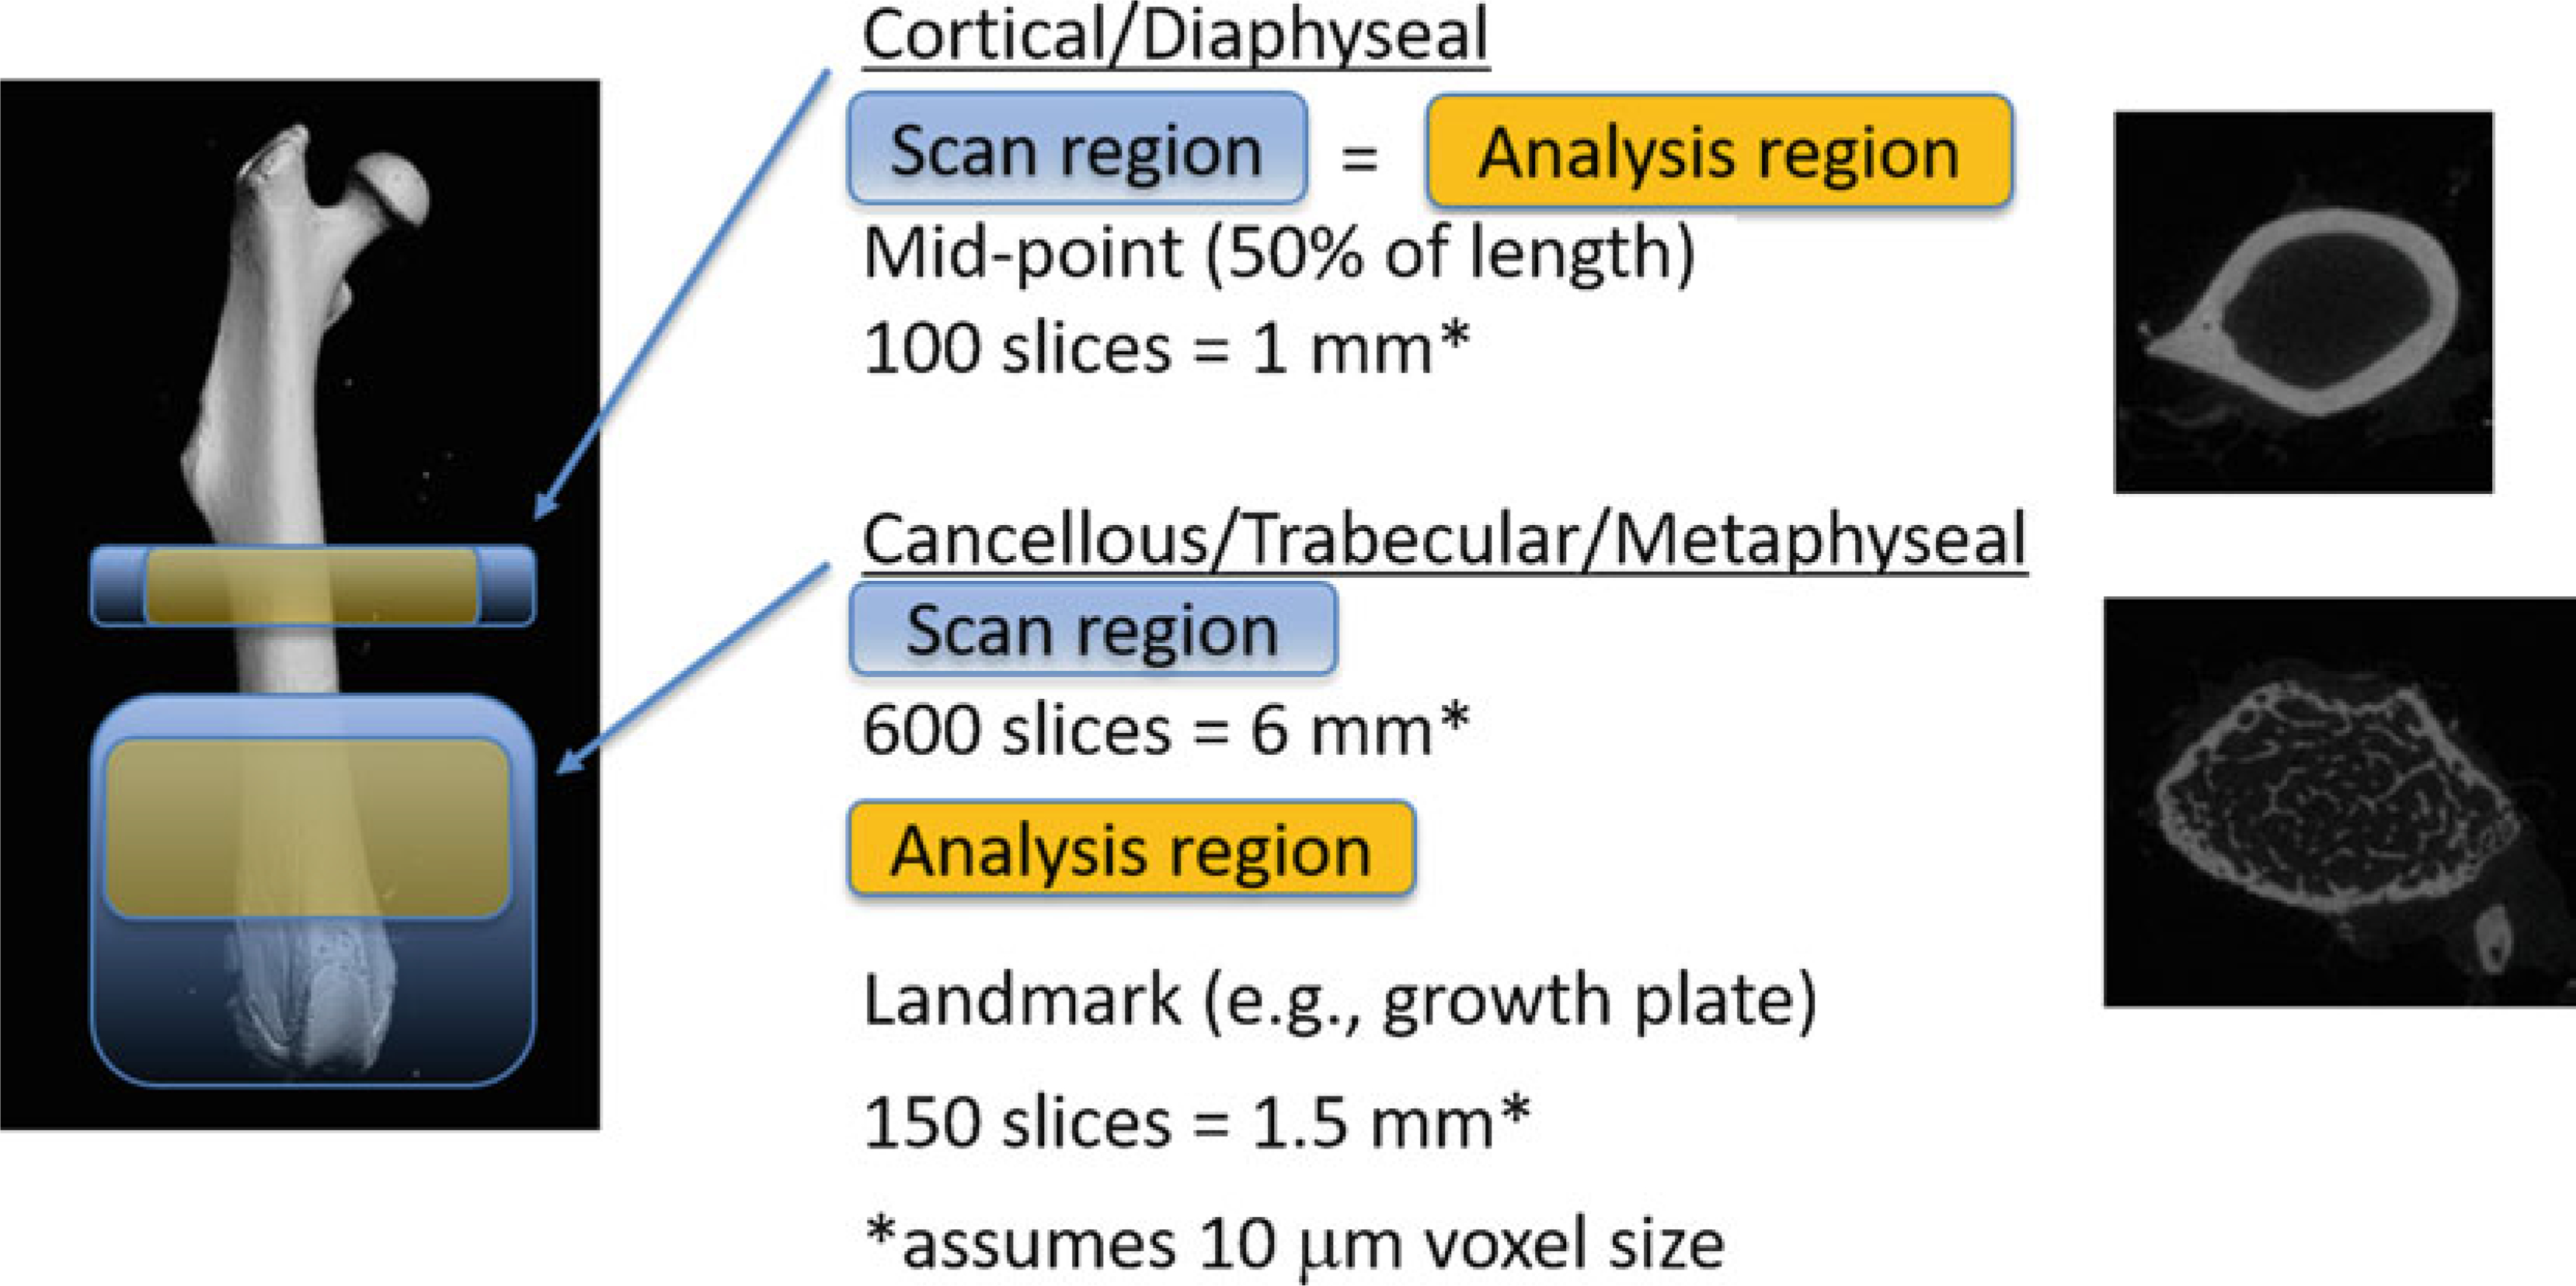
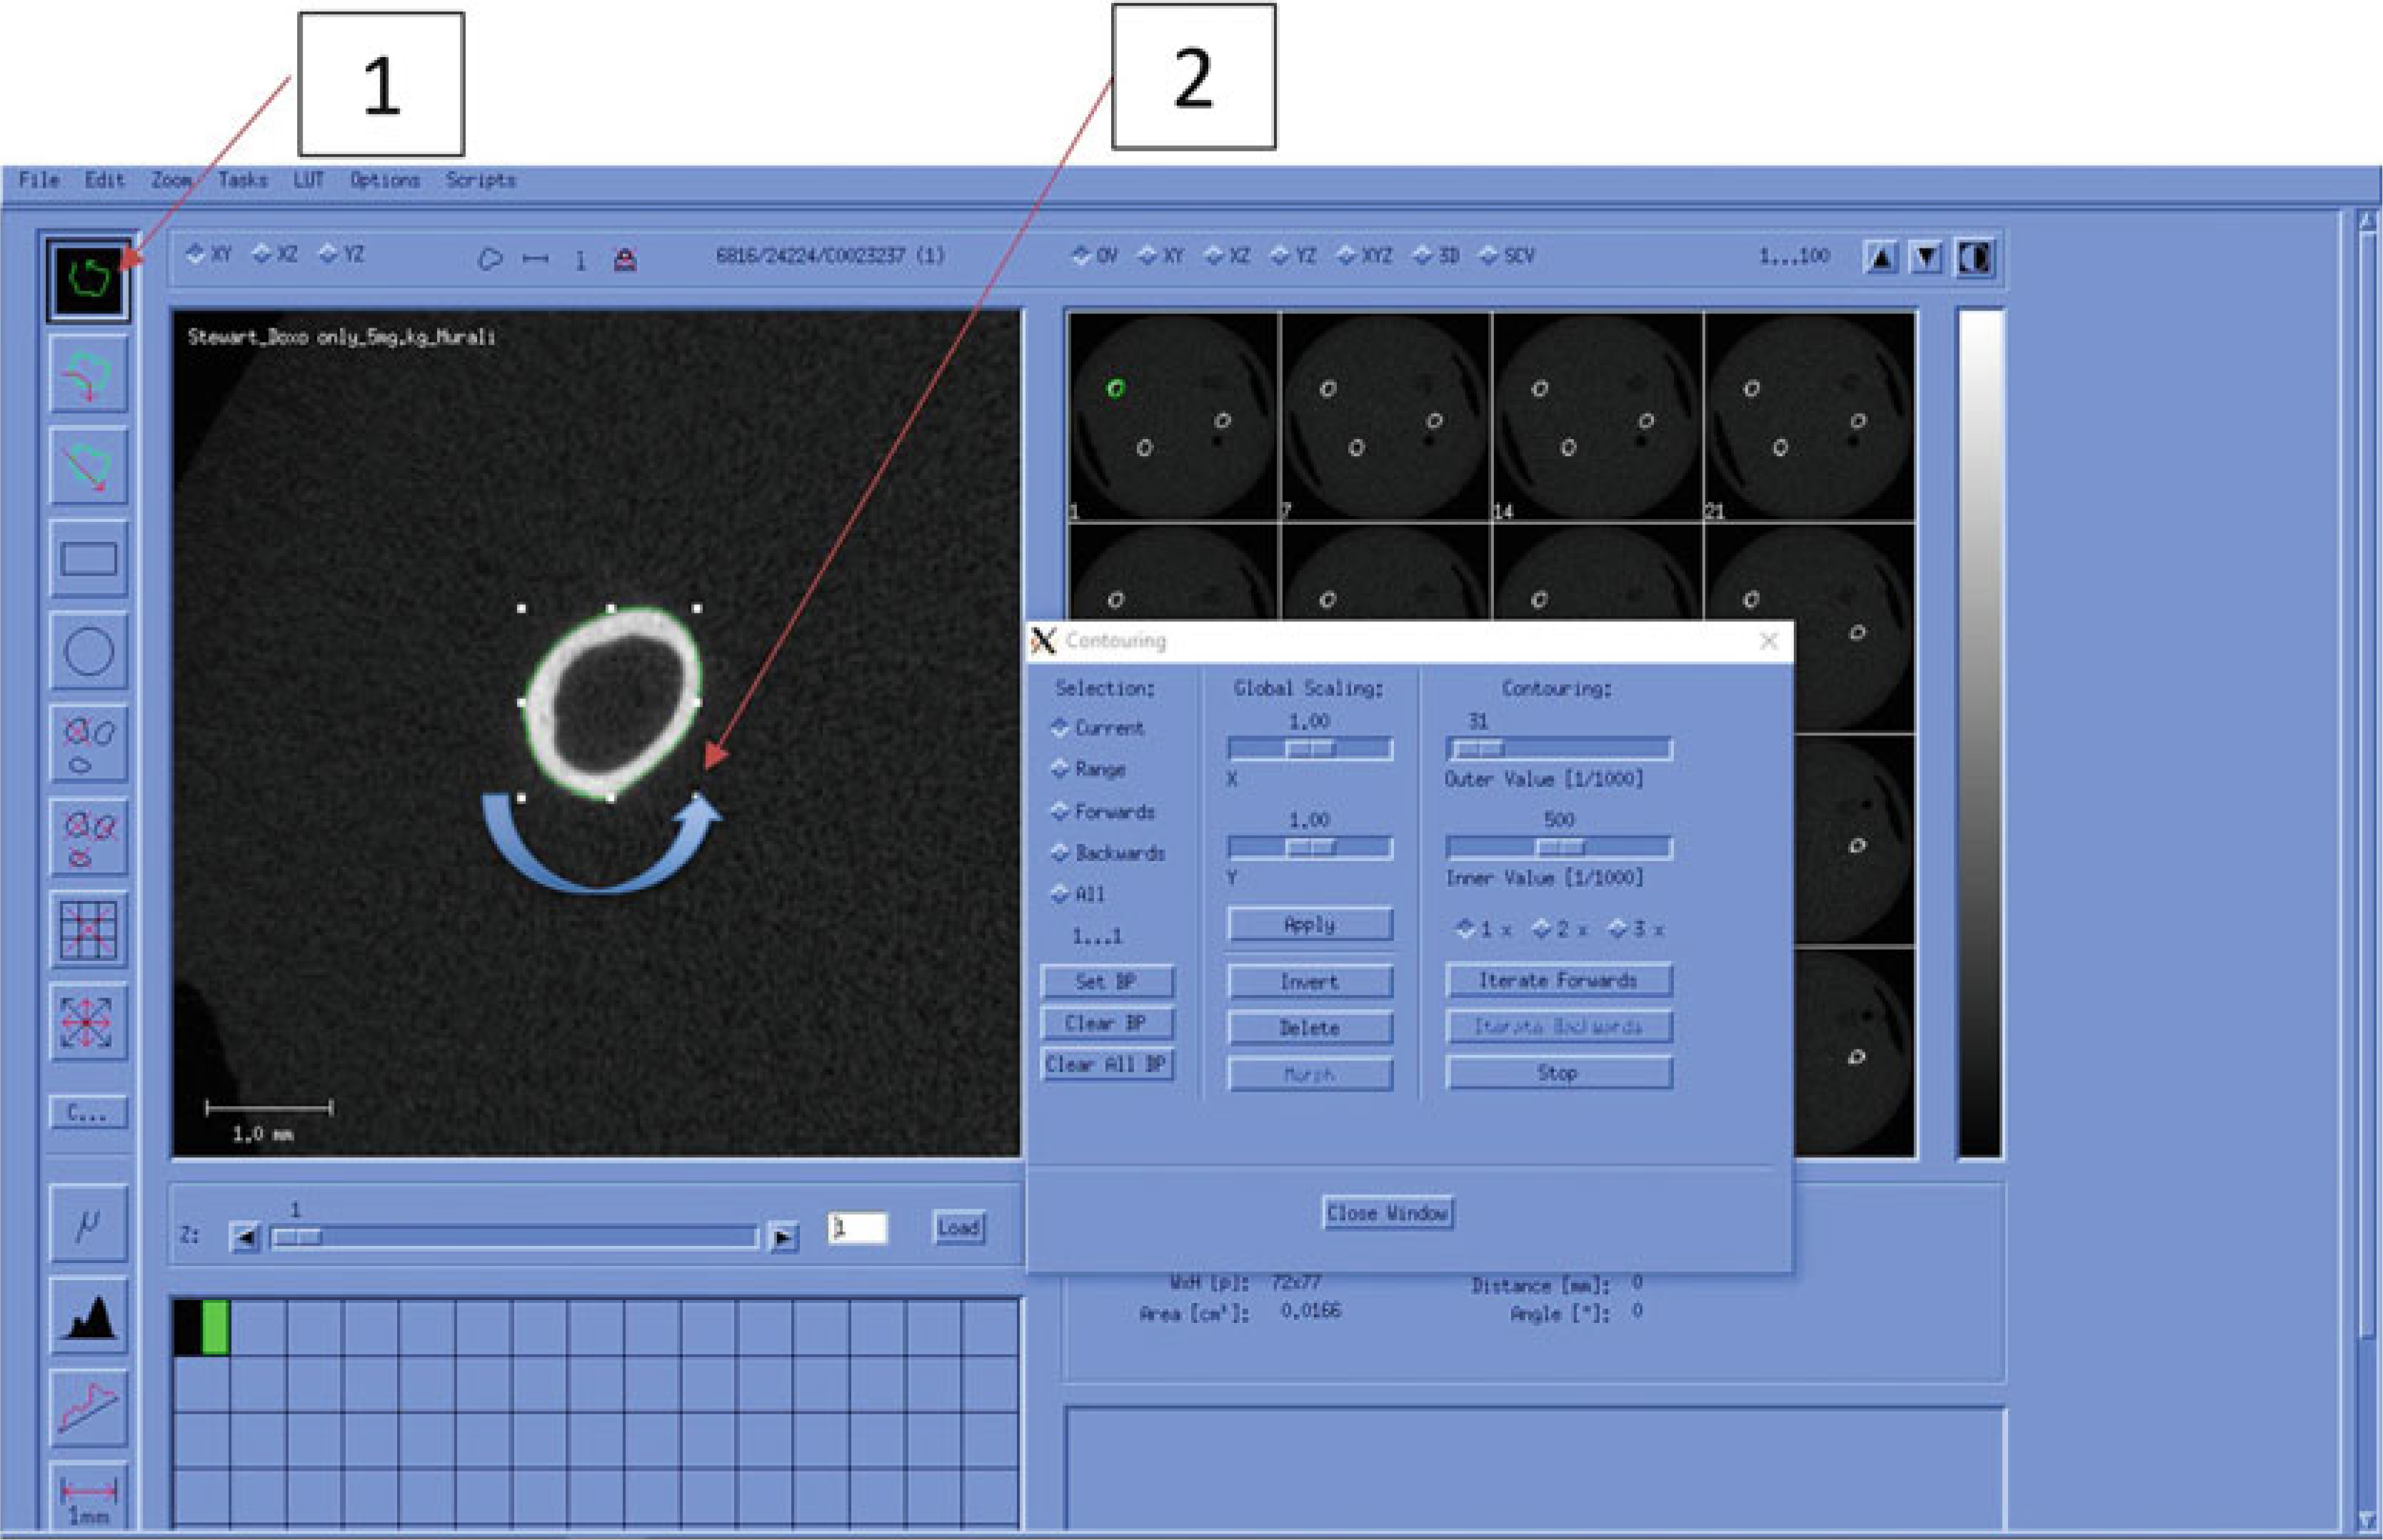
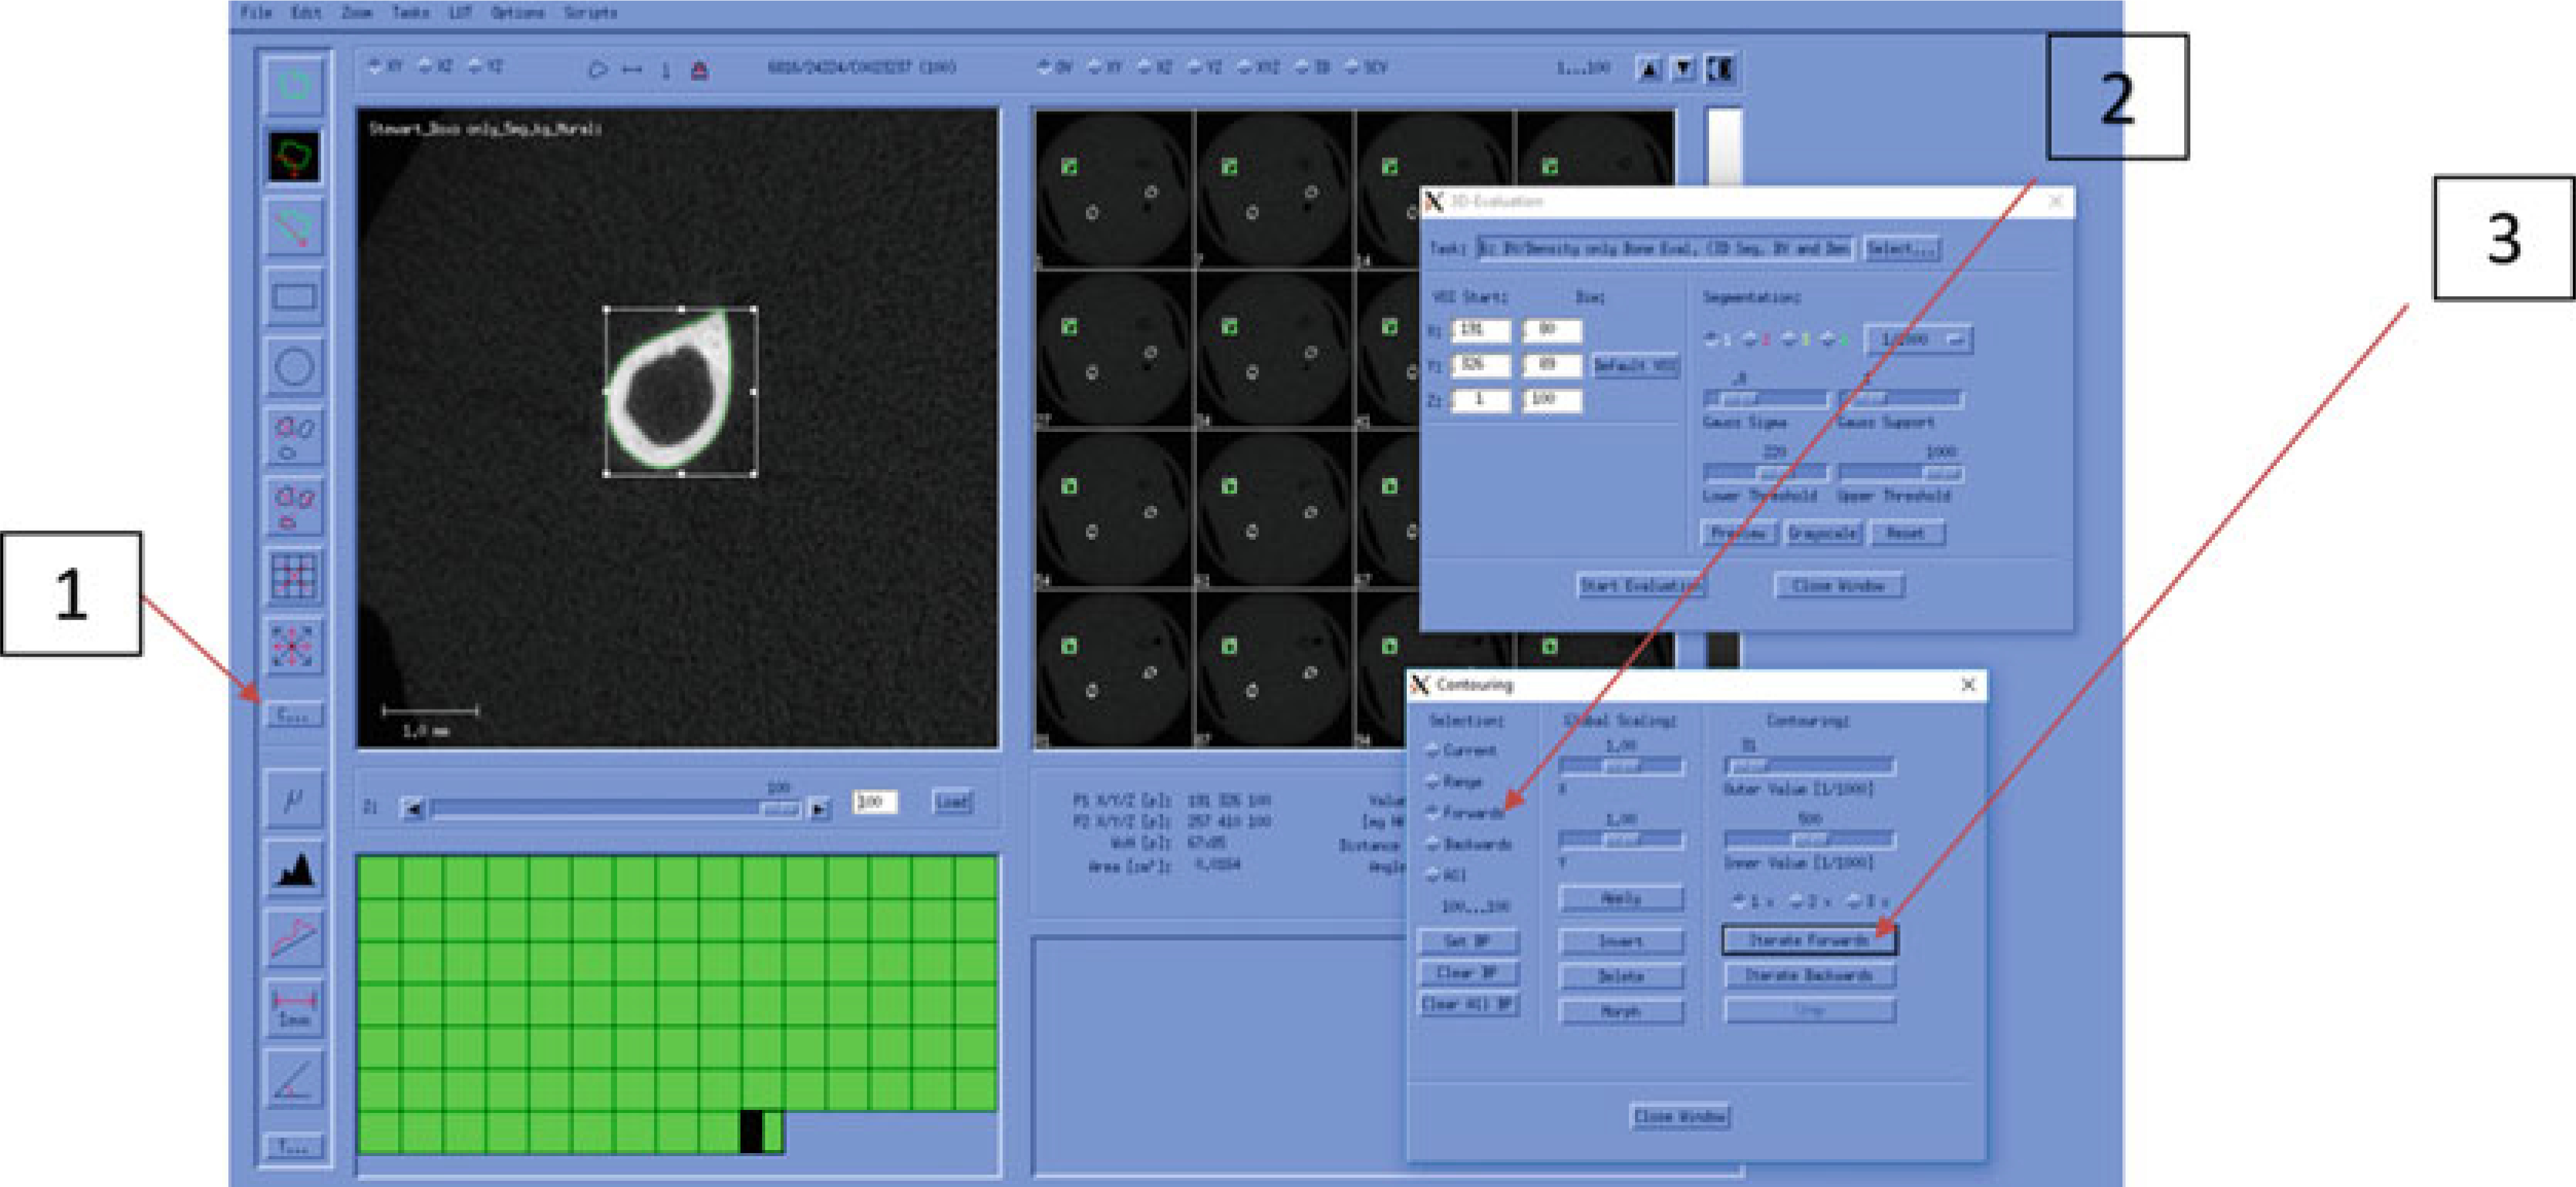
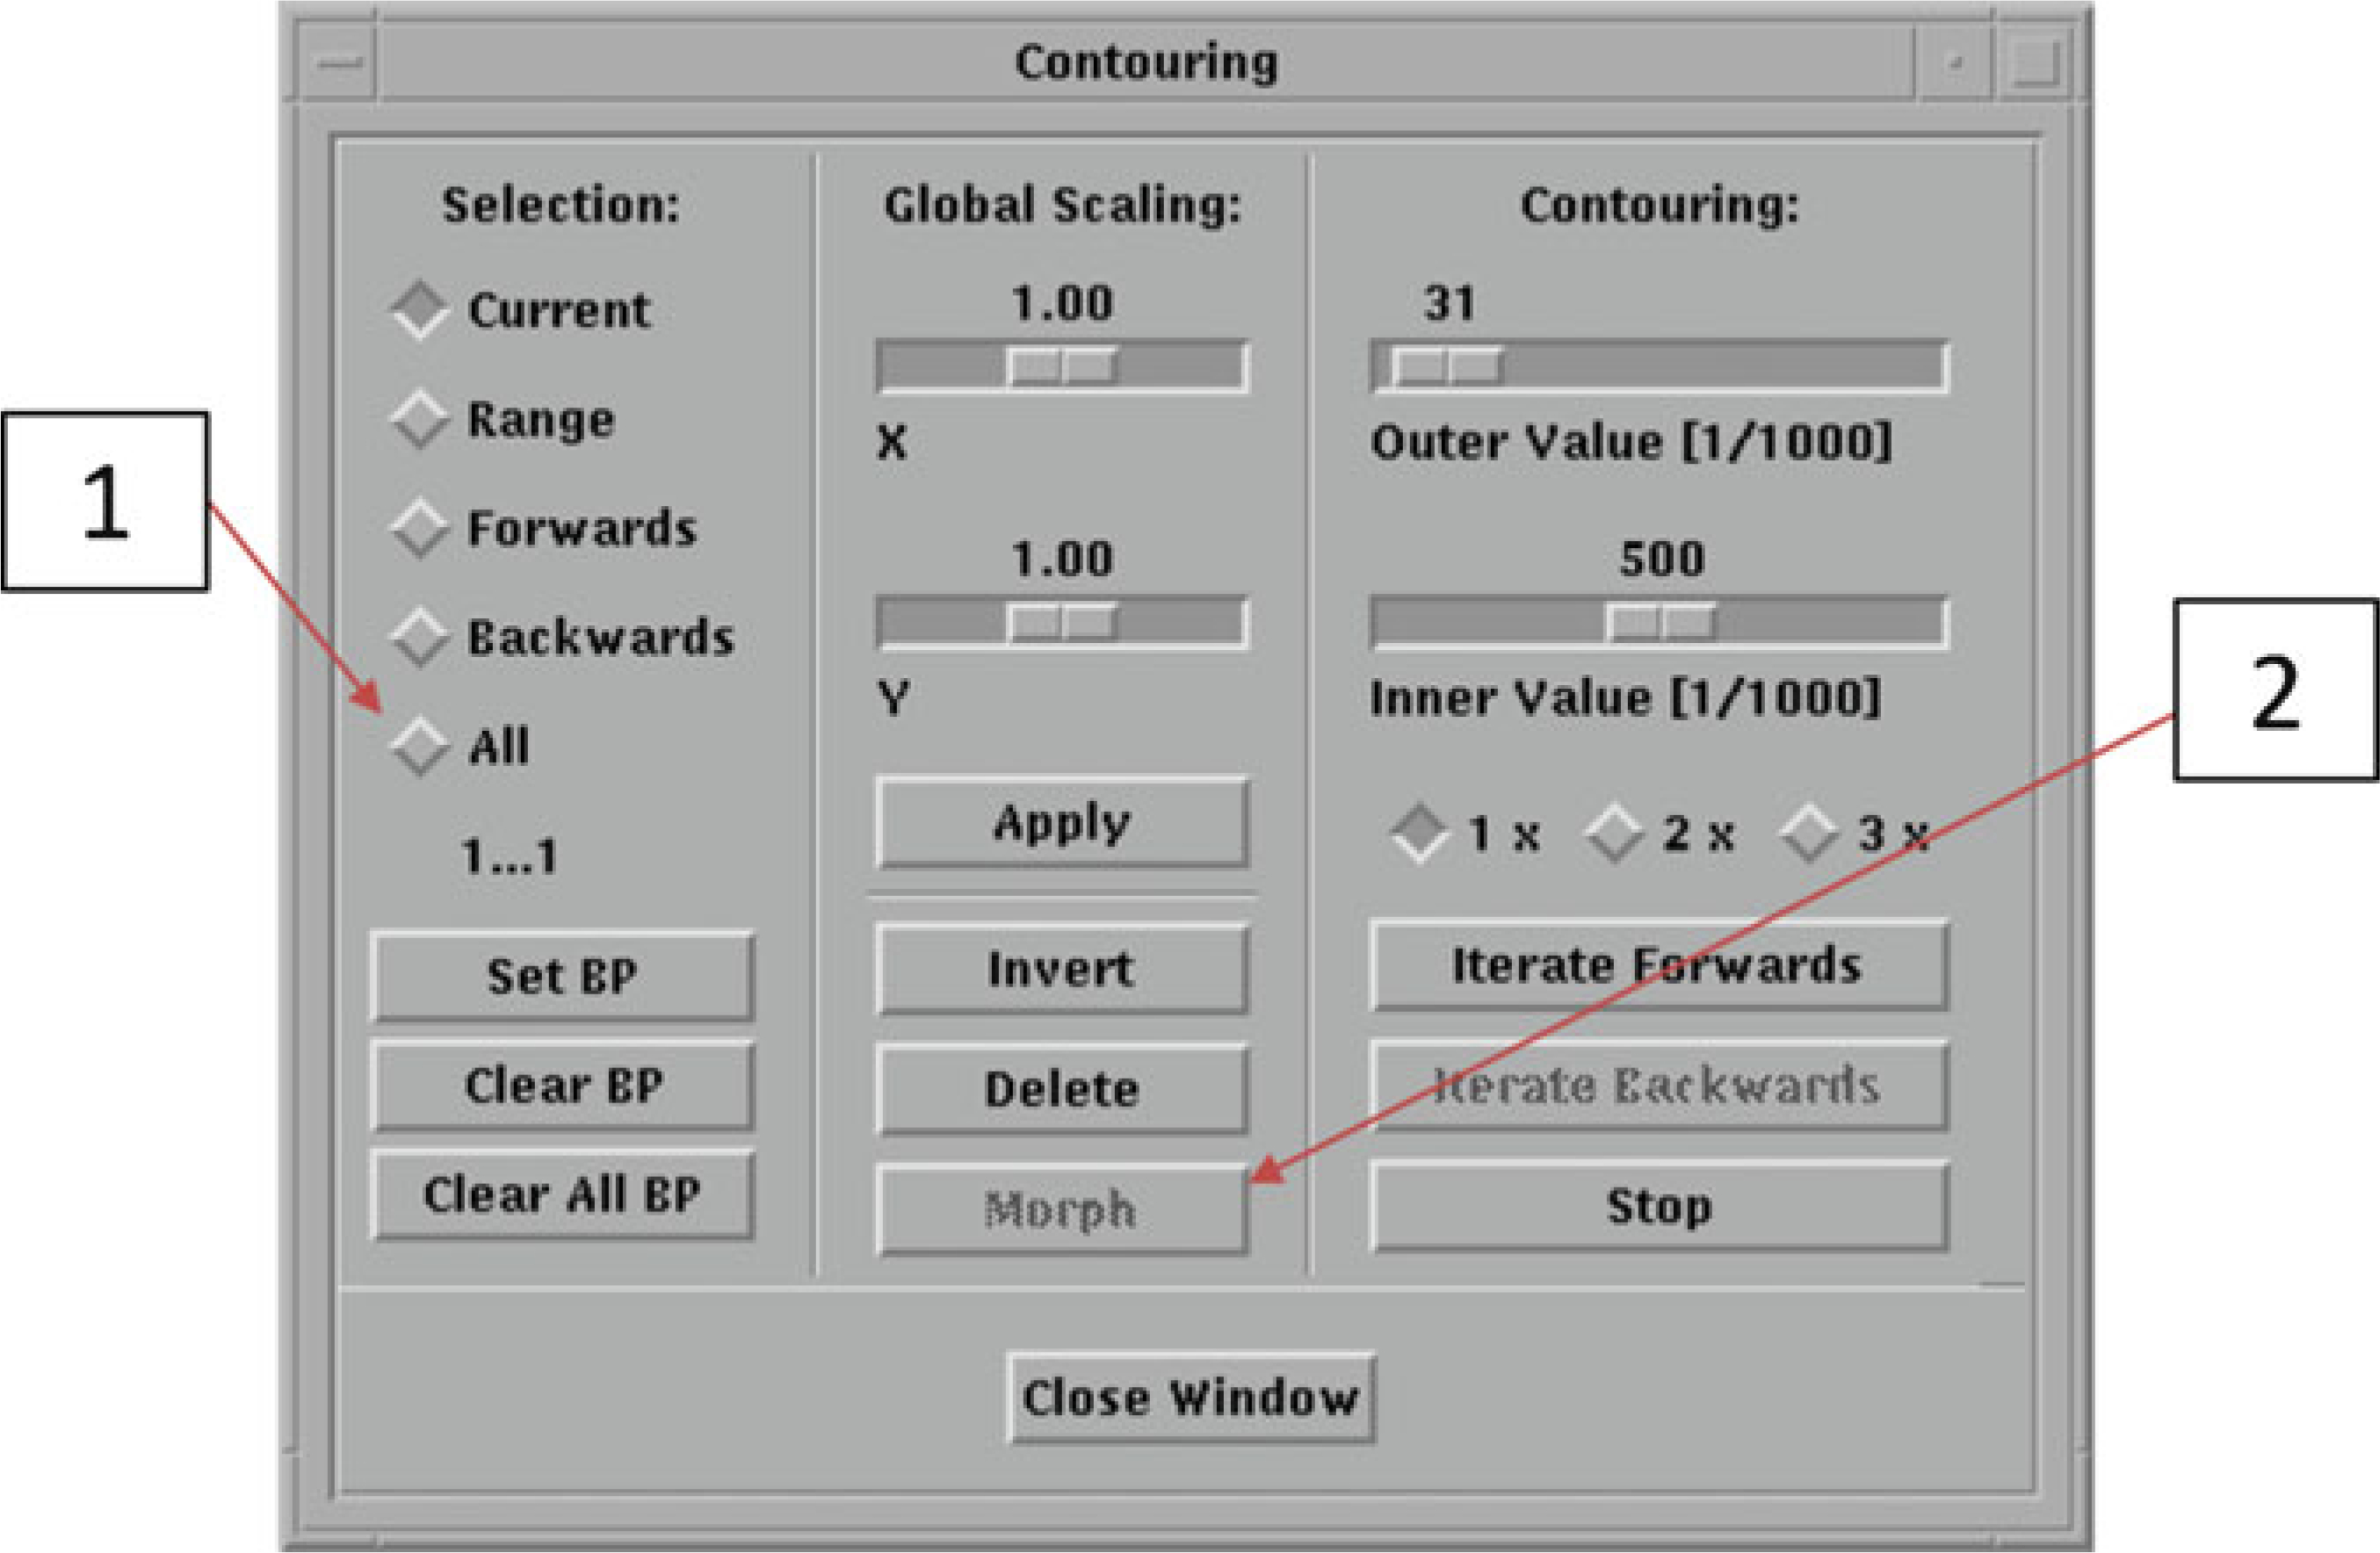
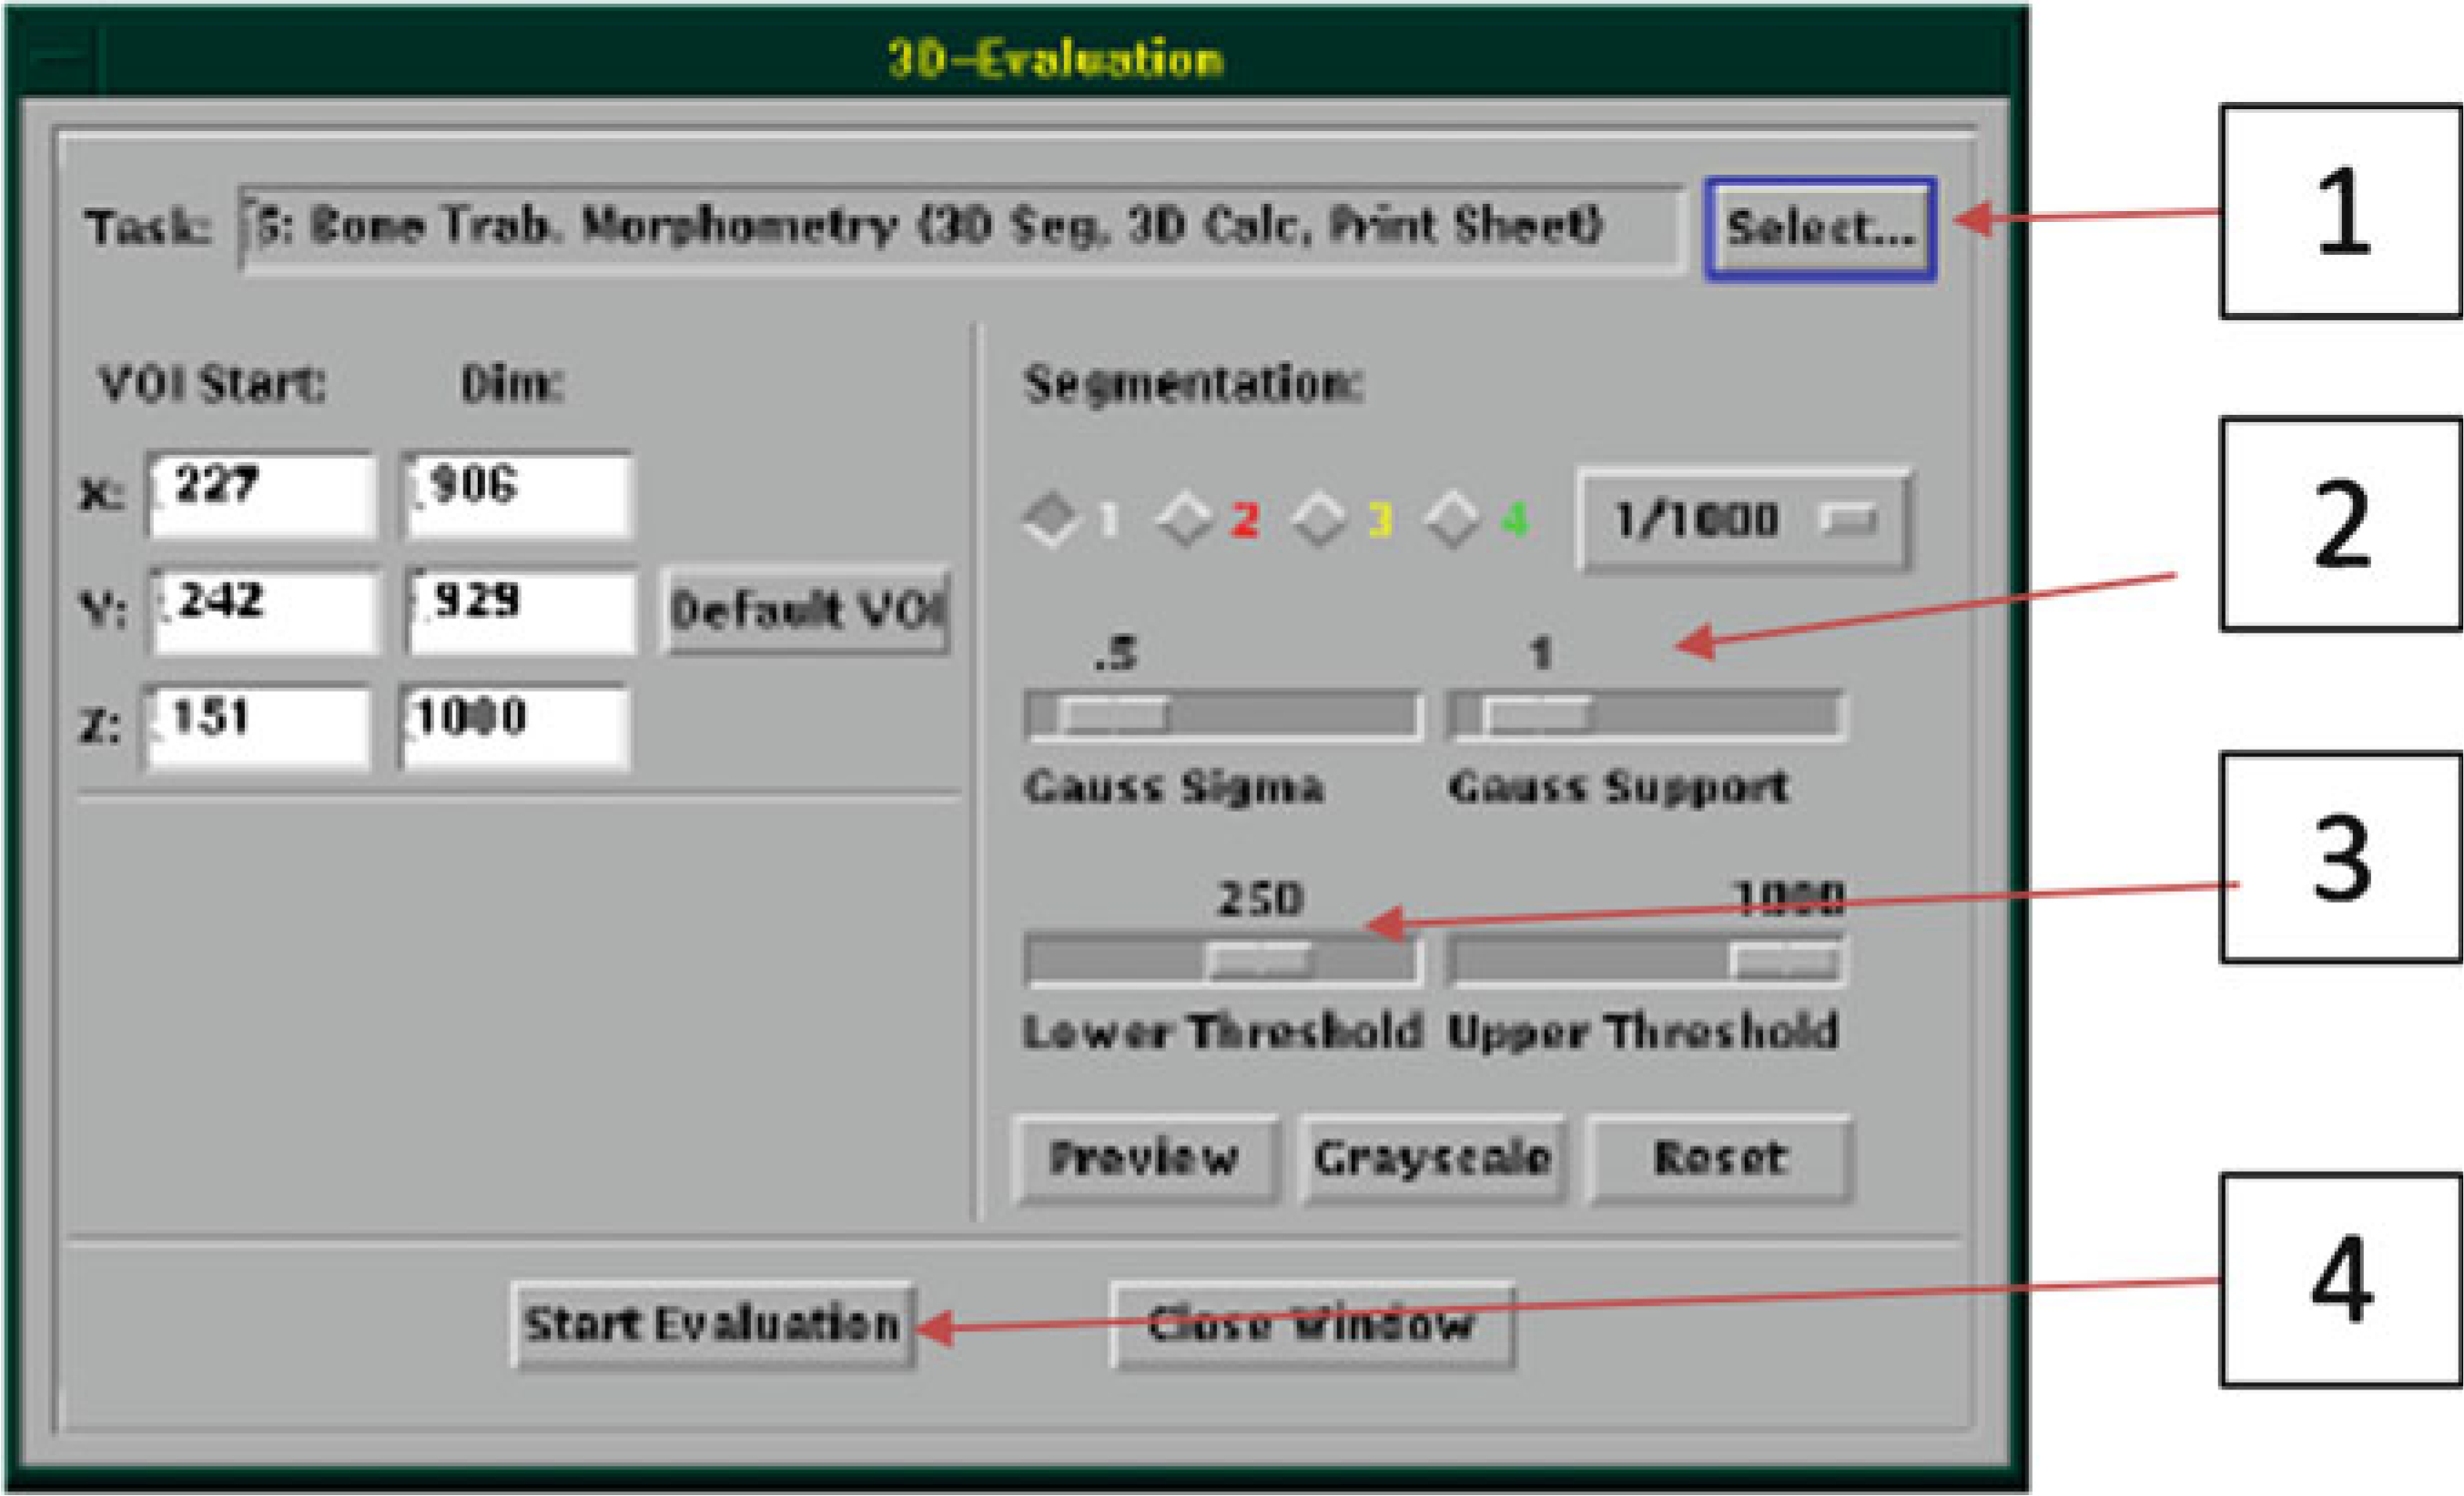
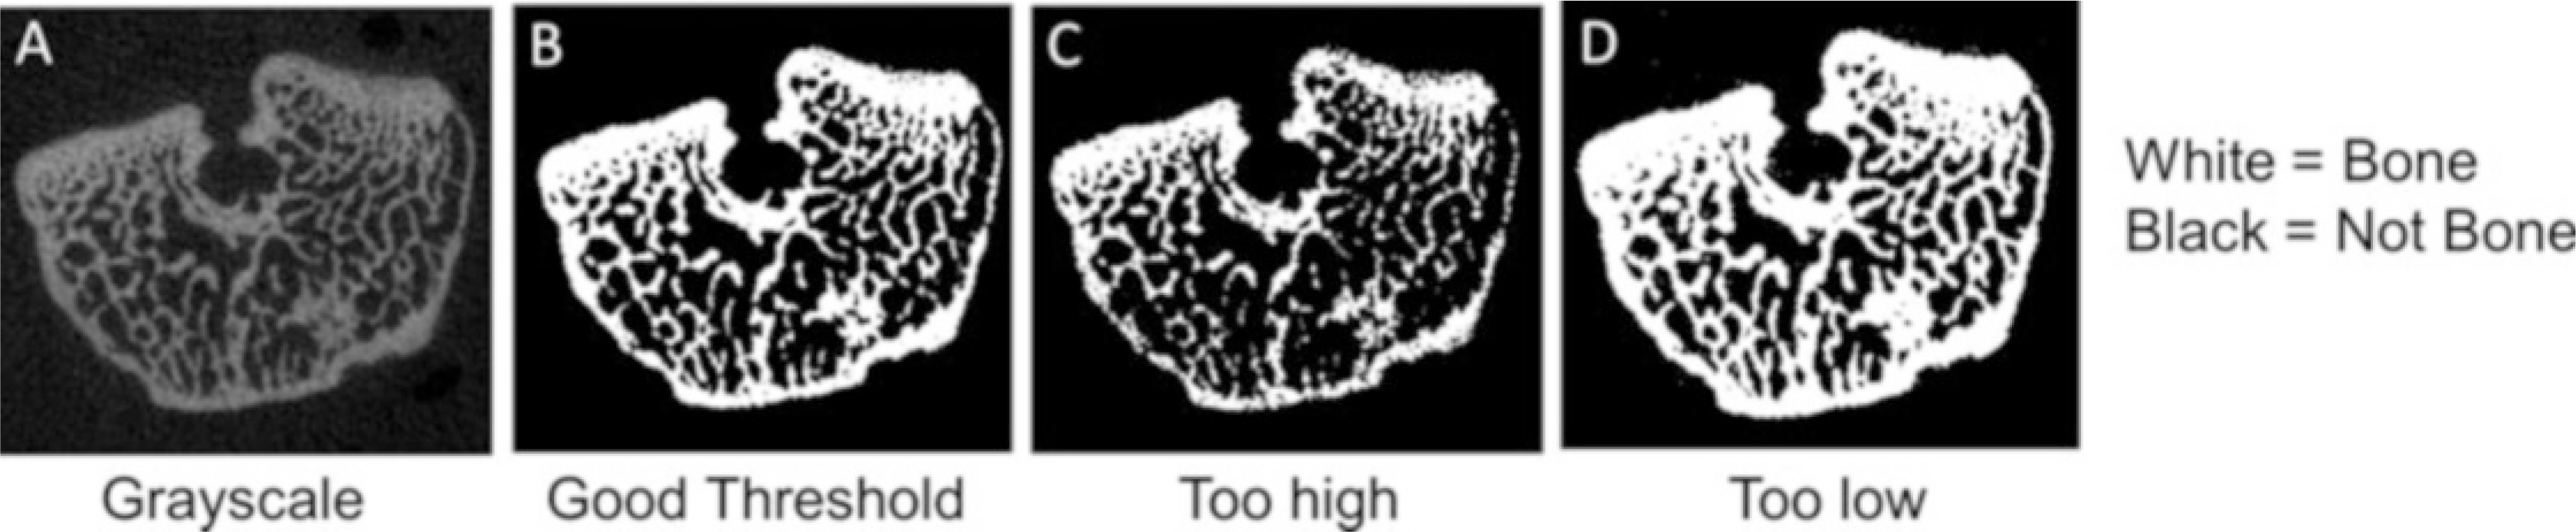
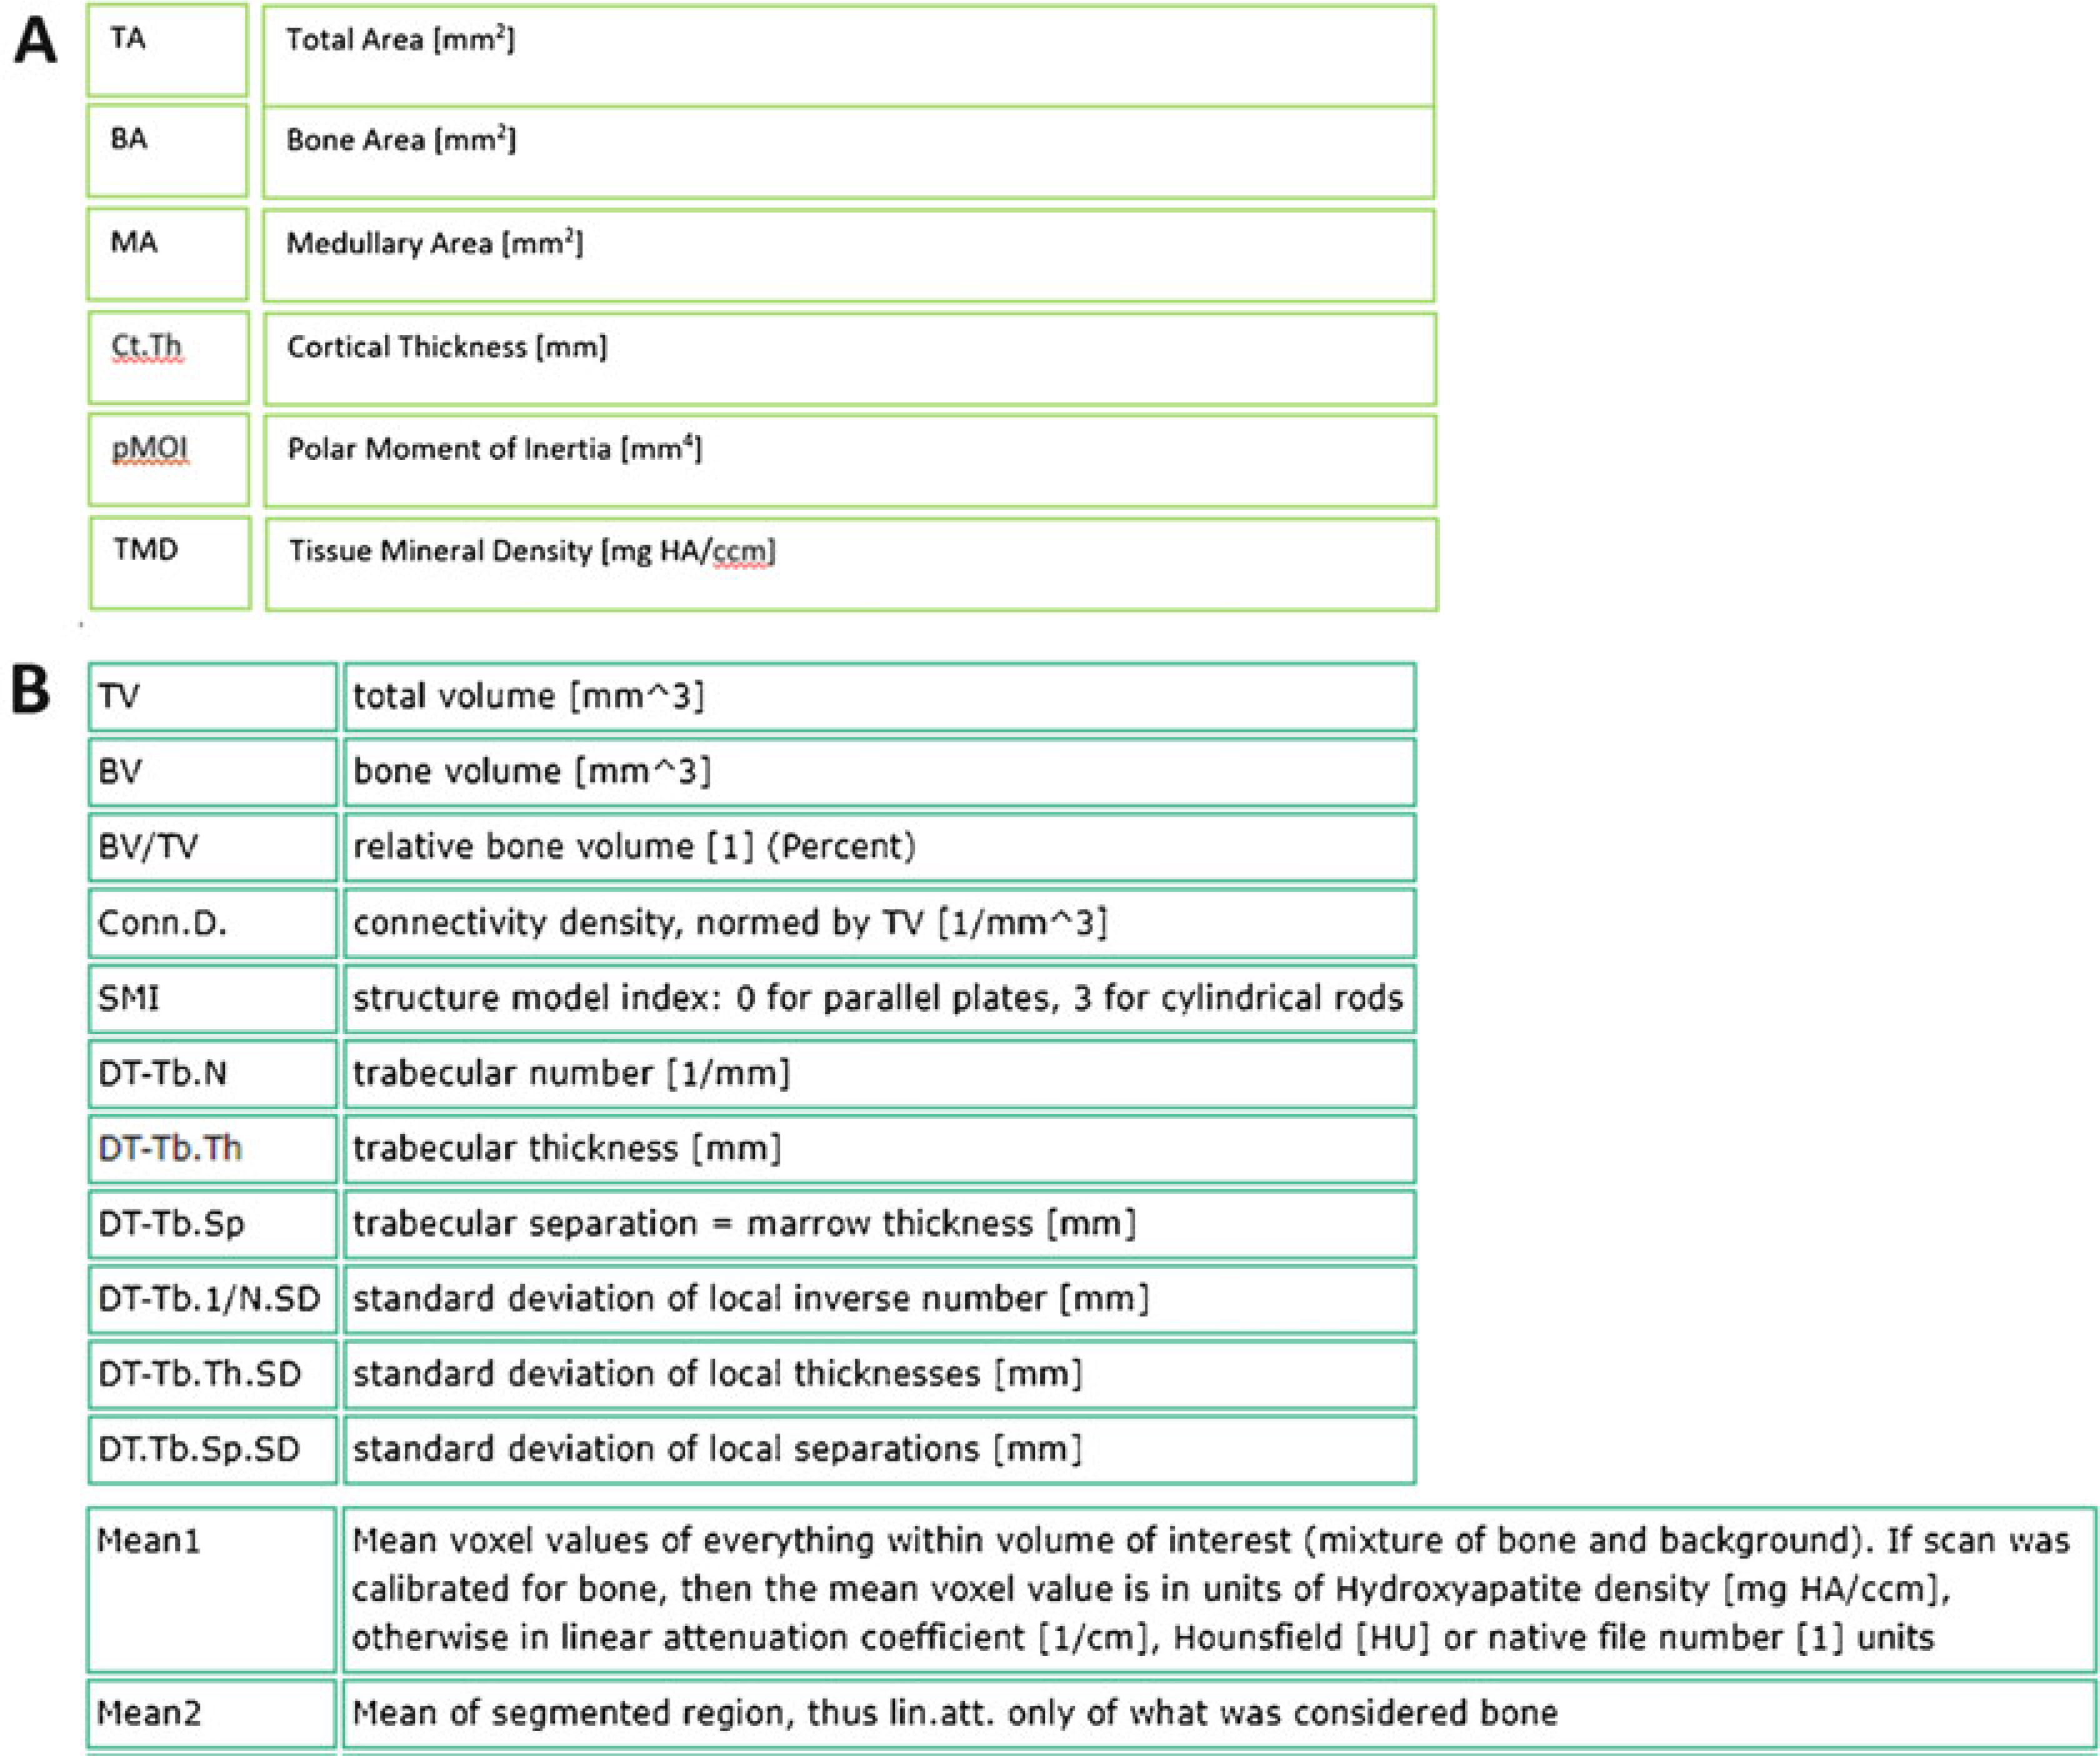
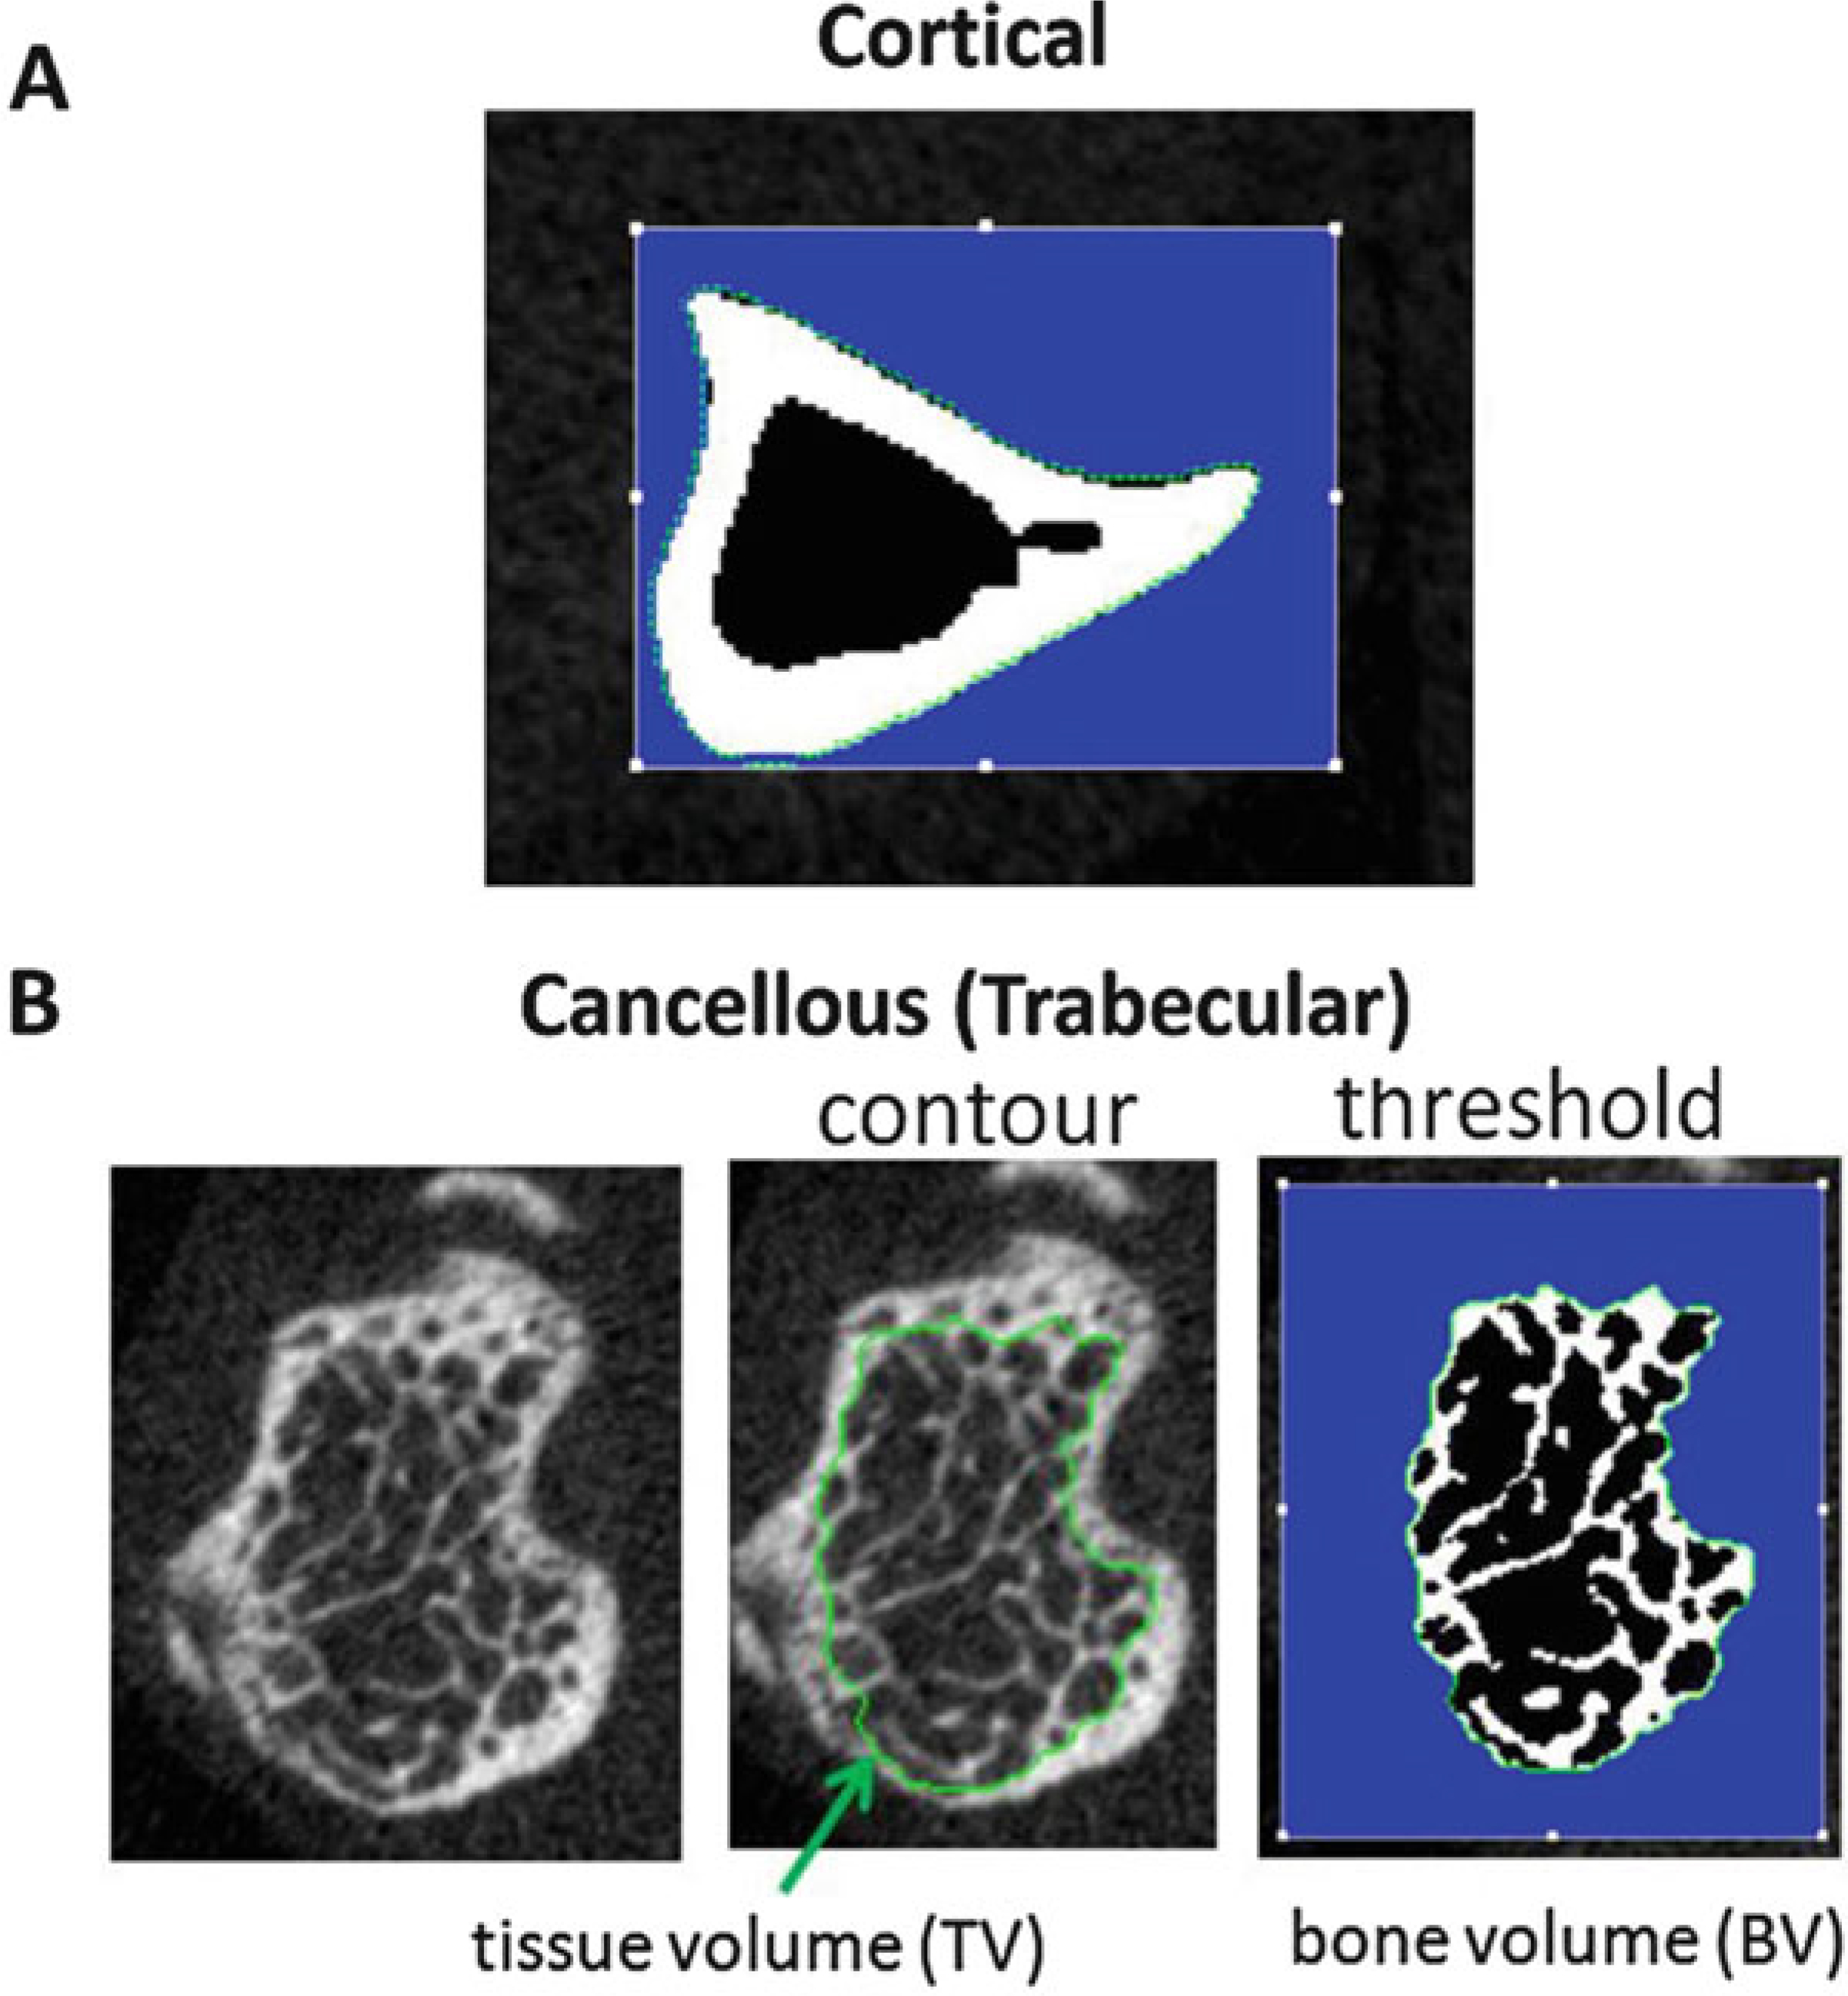
The purpose of this Chapter is to present a detailed description of methods for performing bone Micro-Computed Tomography (microCT) scanning and analysis. MicroCT is an x-ray imaging method capable of visualizing bone at the micro-structural scale, that is, 1-100 µm resolution. MicroCT is the gold-standard method for assessment of 3D bone morphology in studies of small animals. As applied to the small bones of mice or rats, microCT can efficiently and accurately assess bone structure (e.g., cortical bone area [Ct.Ar]) and micro-structure (e.g., trabecular bone volume fraction [Tb.BV/TV]). The particular application described herein is for post mortem mouse femur specimens. The material presented should be generally applicable to many commercially available laboratory microCT systems, although some details are specific to the system used in our lab (Scanco mCT 40; SCANCO Medical AG, Bruttisellen, Switzerland).

Keywords: Bone imaging; Bone morphology; Mouse femur; microCT.


Figures

Fig. 1
Fig. 1
Attenuation of X-ray energy through bone depends on thickness (t) and mineral density. The thicker and denser the object, the greater the attenuation (loss)
Fig. 2
Fig. 2
At each position, the detector acquires a projection (P) of the object (e.g., forearm). The CT reconstruction algorithm essentially averages the intensities of these multiple projections at each spot on the detector array, and generates a 2D tomogram (slice) which is like a density map. Note that for clinical CT and in vivo microCT, the source and detector rotate around the subject, as shown above. By contrast, for specimen microCT, multiple projections are acquired by rotating the object while the source and detector are fixed
Fig. 3
Fig. 3
MicroCT slice through sample tube containing a mouse lower leg. This grayscale image illustrates the differing attenuations of mineralized bone (tibia and fibula) compared to surrounding nonmineralized soft tissue and air (background). (Brightness of this image was increased to more easily visualize the soft tissue.) By convention the higher attenuating material is shown as brighter (whiter), although this can be inverted or even reassigned to color. A rubber band was placed with the sample in the tube as a position landmark
Fig. 4
Fig. 4
Schematic illustrating source–object–detector geometry. The field-of-view size is the diameter (“D”) of the sample holder (tube). The nominal voxel size is the field-of-view divided by the matrix size of the detector array. Thus, using the smallest sample holder that will contain your samples is recommended to give the best resolution, that is, smallest voxel size. Similarly, selecting a larger matrix size will improve resolution, although at the cost of larger file sizes and slower reconstruction times
Fig. 5
Fig. 5
MicroCT workflow
Fig. 6
Fig. 6
Dissected mouse femurs (a) with and (b) without muscle
Fig. 7
Fig. 7
Scanco PEI (polyetherimide) sample tube. Outer diameter is 20 mm; inner diameter is 18.5 mm. Stainless steel pin aligns tube in the scanner
Fig. 8
Fig. 8
Sketch illustrates asymmetric positioning for five femurs in a single stack, allowing for multiple bones to be scanned simultaneously in a single measurement. Additional stacks can be placed in the sample holder and scanned as additional measurements in batch mode. Further, if your system is equipped with a sample changer, you can load up to 10 holders for batch mode scanning
Fig. 9
Fig. 9
Agarose Embedding. (a) First layer with rubber band marker and two femurs. (b) Second layer with three femurs. (c) Top view looking down on femoral heads. (d) Side View
Fig. 10
Fig. 10
Placing the sample holder in the scanner. Here the holder is in position 1 of the sample changer (carousel). This changer can hold up to 10 sample tubes
Fig. 11
Fig. 11
Scanco software main menu
Fig. 12
Fig. 12
Create new sample number with descriptive name (see Note 9)
Fig. 13
Fig. 13
(a) Start a new measurement. (b) Enter sample number created in previous step
Fig. 14
Fig. 14
Carousel Position. Example shows holders in positions 5 and 7 (green)
Fig. 15
Fig. 15
Controlfile settings
Fig. 16
Fig. 16
(a) Measurement main window; selecting Scout View. (b) Scout-View window. (c) Scout-view of a bone biopsy with reference line (green) selections (Scanco Medical)
Fig. 17
Fig. 17
Scan and Analysis Regions for Cortical and Cancellous/Trabecular regions
Fig. 18
Fig. 18
Overview of Evaluation Program (Scanco Medical)
Fig. 19
Fig. 19
Example CT slice showing mid-diaphyseal cross-sections of five femurs, with rubber band fiducial marker. Orientation of bones relative to rubber band is as shown in Fig. 8. Dashed box illustrates zoom selection of femur A for analysis
Fig. 20
Fig. 20
Contouring menu
Fig. 21
Fig. 21
Manual Contouring (Cortical Bone)
Fig. 22
Fig. 22
Automatic Contouring (Cortical Bone)
Fig. 23
Fig. 23
Automatic Contouring Window (Trabecular Bone)
Fig. 24
Fig. 24
3D-Evaluation Window
Fig. 25
Fig. 25
Choosing the threshold (adapted from Bouxsein et al. [1]). (a) Grayscale image of femur metaphysis. (b) A good threshold value results in a segmented image that closely matches the grayscale. (c) Too high a threshold results in erosion of bone and underestimating bone volume. (d) Too low a threshold results in excessive bone
Fig. 26
Fig. 26
Session Manager Window
Fig. 27
Fig. 27
Structural and densitometric indices of bone from (a) Cortical bone analysis, and (b) Trabecular bone analysis. For trabecular analysis, the ‘VOX’ parameters are the most straightforward, as they are based simply on counting voxels; the ‘DT’ parameters are based on distance transformation analysis which is the only method recommended for these analyses. (Scanco Medical)
Fig. 28
Fig. 28
(a) Cortical Bone Slice. The green contour defines the periosteal surface. (b) Cancellous (Trabecular) Bone Slice. The green contour defines the cancellous region, inside the cortical shell. After thresholding/segmentation, the bone voxels are white, and the nonbone voxels (marrow) are black. The blue region is outside the contour and not part of the ROI
Fig. 29
Fig. 29
Main screen of 3D display
Fig. 30
Fig. 30
(a) Scanco Phantom Block. (b) CT slice of phantom shows the five rods of different densities. (c) Regression line from QC scan showing excellent agreement between known phantom density values, and values measured in the QC scan

References

    1. Bouxsein ML, Boyd SK, Christiansen BA, Guldberg RE, Jepsen KJ, Muller R (2010) Guidelines for assessment of bone microstructure in rodents using micro-computed tomography. J Bone Miner Res 25(7):1468–1486. 10.1002/jbmr.141 - DOI - PubMed
    1. Alexander JM, Bab I, Fish S, Muller R, Uchiyama T, Gronowicz G, Nahounou M, Zhao Q, White DW, Chorev M, Gazit D, Rosenblatt M (2001) Human parathyroid hormone 1–34 reverses bone loss in ovariectomized mice. J Bone Miner Res 16(9):1665–1673. 10.1359/jbmr.2001.16.9.1665 - DOI - PubMed
    1. Bonnet N, Laroche N, Vico L, Dolleans E, Courteix D, Benhamou CL (2009) Assessment of trabecular bone microarchitecture by two different x-ray microcomputed tomographs: a comparative study of the rat distal tibia using Skyscan and Scanco devices. Med Phys 36 (4):1286–1297. 10.1118/1.3096605 - DOI - PubMed
    1. Christiansen BA (2016) Effect of microcomputed tomography voxel size and segmentation method on trabecular bone microstructure measures in mice. Bone Rep 5:136–140. 10.1016/j.bonr.2016.05.006 - DOI - PMC - PubMed
    1. Nazarian A, Snyder BD, Zurakowski D, Muller R (2008) Quantitative micro-computed tomography: a non-invasive method to assess equivalent bone mineral density. Bone 43 (2):302–311. 10.1016/j.bone.2008.04.009 - DOI - PubMed

Publication types