. 2021 Mar;160(4):1224-1239.e30.
doi: 10.1053/j.gastro.2020.11.011. Epub 2020 Nov 14.

The Balance of Stromal BMP Signaling Mediated by GREM1 and ISLR Drives Colorectal Carcinogenesis

Affiliations

The Balance of Stromal BMP Signaling Mediated by GREM1 and ISLR Drives Colorectal Carcinogenesis

Hiroki Kobayashi et al. Gastroenterology. 2021 Mar.

Erratum in

  • Correction.
    [No authors listed] [No authors listed] Gastroenterology. 2021 Nov;161(5):1728. doi: 10.1053/j.gastro.2021.09.038. Epub 2021 Sep 22. Gastroenterology. 2021. PMID: 34562358 No abstract available.

Abstract

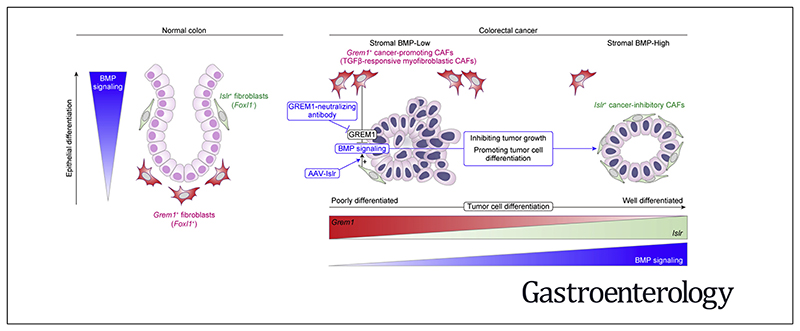
Background & aims: Cancer-associated fibroblasts (CAFs), key constituents of the tumor microenvironment, either promote or restrain tumor growth. Attempts to therapeutically target CAFs have been hampered by our incomplete understanding of these functionally heterogeneous cells. Key growth factors in the intestinal epithelial niche, bone morphogenetic proteins (BMPs), also play a critical role in colorectal cancer (CRC) progression. However, the crucial proteins regulating stromal BMP balance and the potential application of BMP signaling to manage CRC remain largely unexplored.

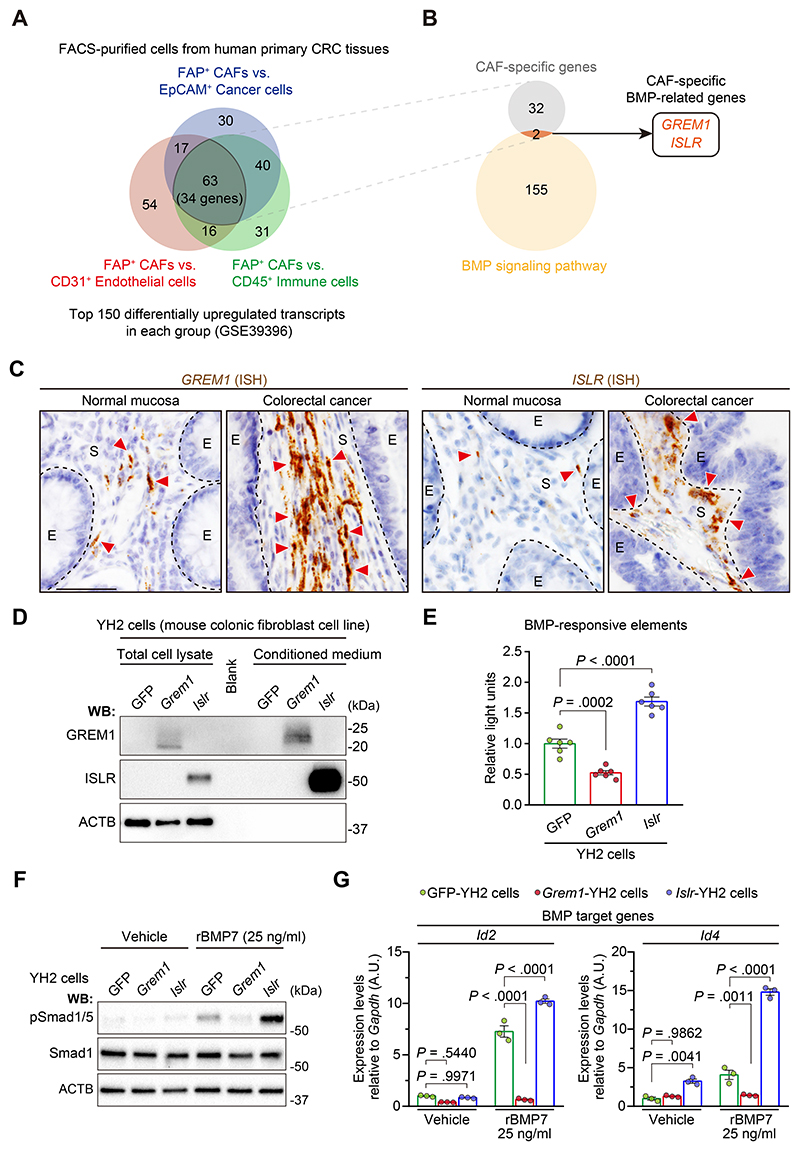
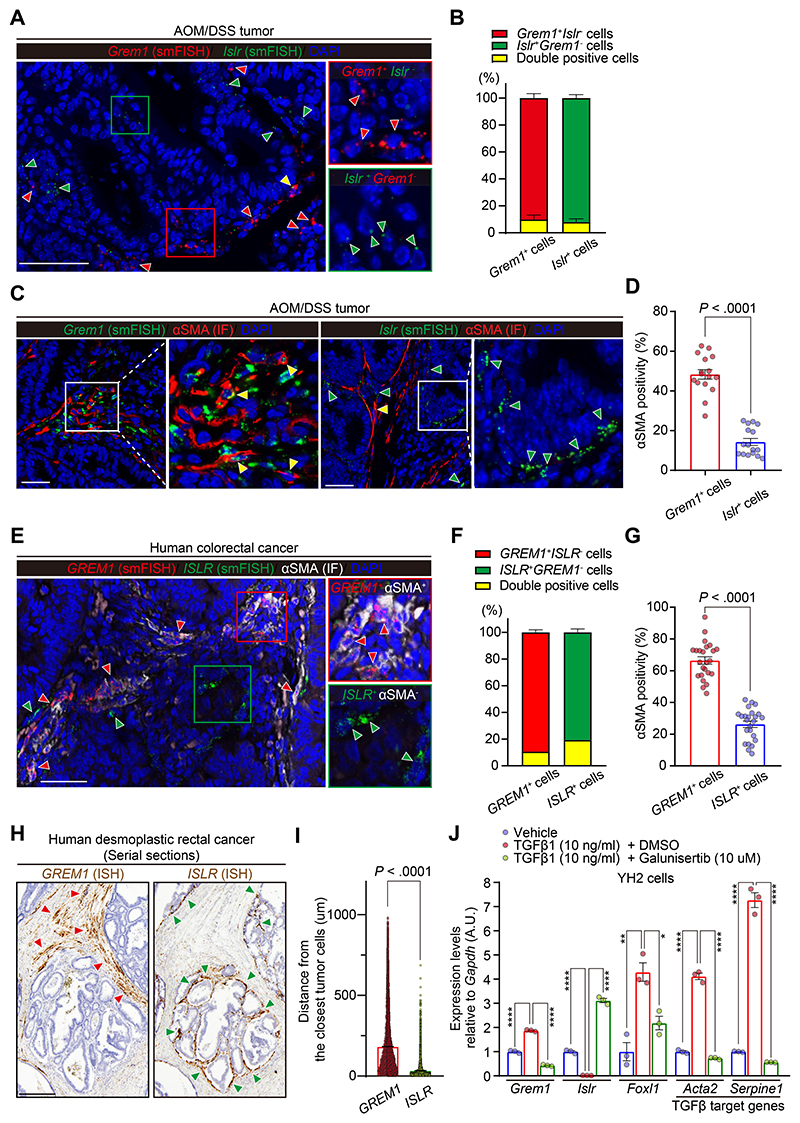
Methods: Using human CRC RNA expression data, we identified CAF-specific factors involved in BMP signaling, then verified and characterized their expression in the CRC stroma by in situ hybridization. CRC tumoroids and a mouse model of CRC hepatic metastasis were used to test approaches to modify BMP signaling and treat CRC.

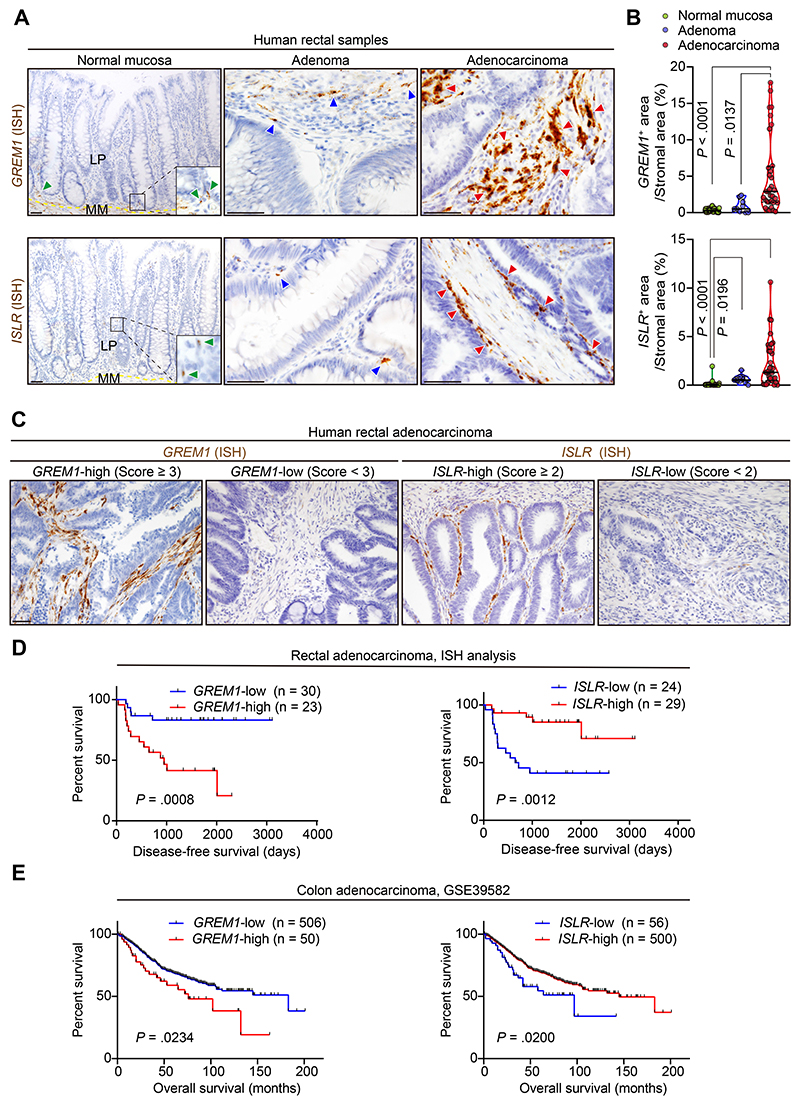
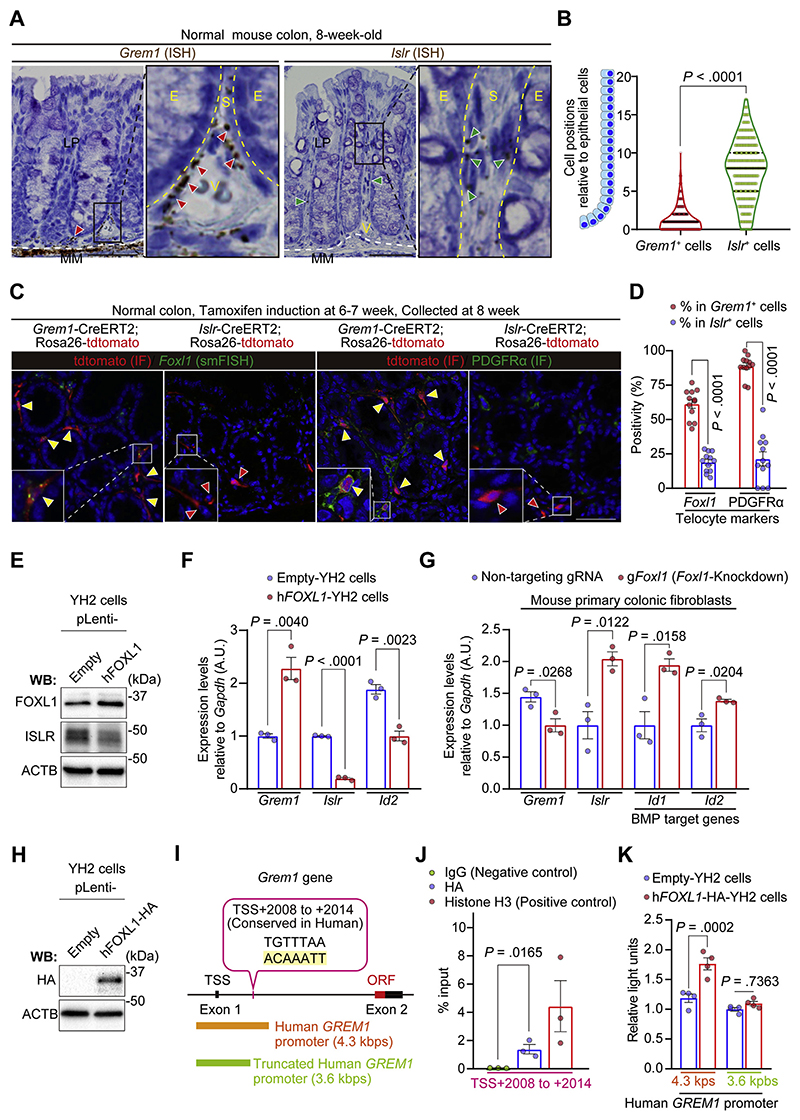
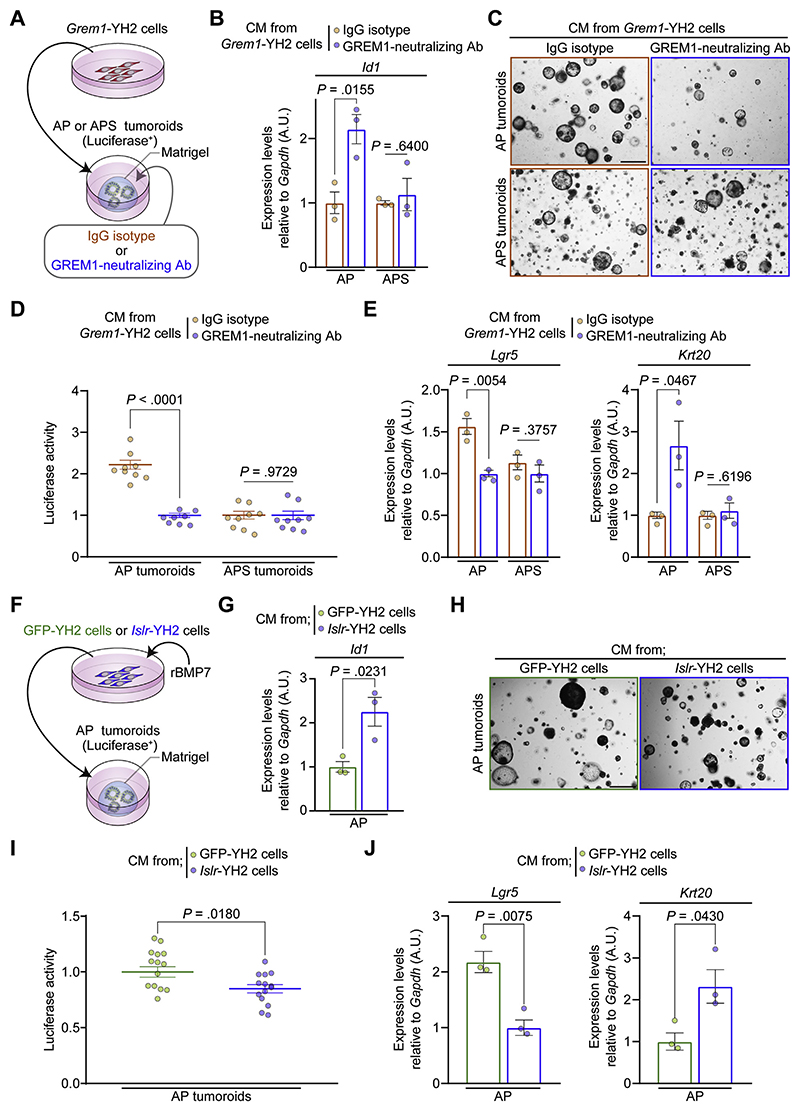
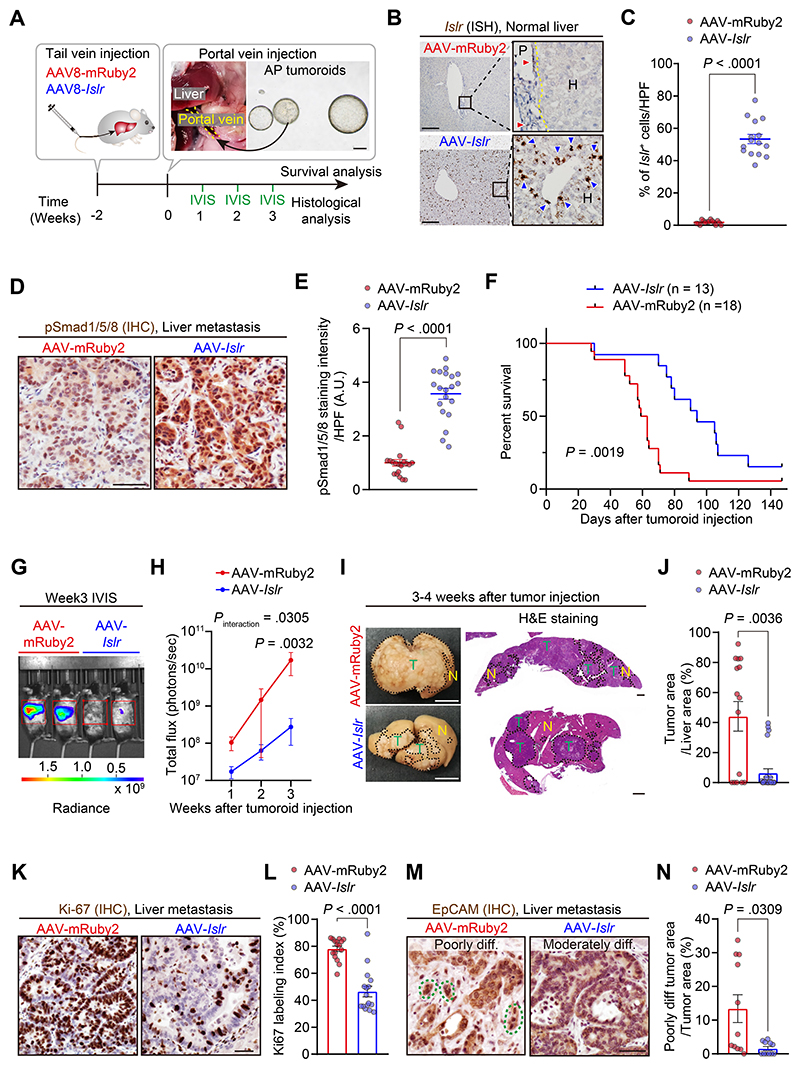
Results: We identified Grem1 and Islr as CAF-specific genes involved in BMP signaling. Functionally, GREM1 and ISLR acted to inhibit and promote BMP signaling, respectively. Grem1 and Islr marked distinct fibroblast subpopulations and were differentially regulated by transforming growth factor β and FOXL1, providing an underlying mechanism to explain fibroblast biological dichotomy. In patients with CRC, high GREM1 and ISLR expression levels were associated with poor and favorable survival, respectively. A GREM1-neutralizing antibody or fibroblast Islr overexpression reduced CRC tumoroid growth and promoted Lgr5+ intestinal stem cell differentiation. Finally, adeno-associated virus 8 (AAV8)-mediated delivery of Islr to hepatocytes increased BMP signaling and improved survival in our mouse model of hepatic metastasis.

Conclusions: Stromal BMP signaling predicts and modifies CRC progression and survival, and it can be therapeutically targeted by novel AAV-directed gene delivery to the liver.

Keywords: Bone Morphogenetic Protein; Cancer-Associated Fibroblasts; Colorectal Cancer; Tumor Microenvironment.


Conflict of interest statement

Conflicts of interest

These authors disclose the following: Gareth Davies is a researcher at UCB Pharma (Slough, Berkshire, UK); A GREM1-neutralizing antibody was generated by UCB Pharma and provided to researchers at the Gut Cancer Group, the University of Adelaide (Australia), at no cost. Leszek Lisowski has consulted on technologies addressed in this paper and has stock and/or equity in companies with technology broadly related to this paper. The remaining authors disclose no conflicts.

Figures

None
Graphical abstract
Figure 1
Figure 1. Identification of GREM1 and ISLR as a BMP antagonist and potentiator, respectively, specifically expressed by CRC CAFs.
(A, B) Analysis of expression microarray data from FACS-purified cells from human primary CRC tissues. (A) Venn diagram depicting the overlap of the top 150 differentially up-regulated transcripts in the 3 groups as indicated. (B) Venn diagram showing the overlap of 34 CAF-specific genes and 157 BMP-related genes identified by GO of the BMP signaling pathway (GO: 0030509) and Hara et al. (C) ISH for GREM1 and ISLR in the human normal colorectal mucosa and CRC. Dotted lines indicate the borders between epithelial cells (E) and the stroma (S). Red arrowheads denote GREM1 or ISLR expression. Scale bar, 50 μm. (D–G) Lentivirus-mediated overexpression of Grem1 and Islr in a mouse colonic fibroblast cell line, YH2 cells, represses and augments BMP signaling, respectively. (D) Western blotting (WB) showing Grem1 and Islr overexpression in the total cell lysates and CM. (E) Luciferase assays of BMP-responsive elements; n = 6. (F, G) YH2 cells were stimulated with recombinant BMP7, followed by (F) WB and (G) qRT-PCR; n = 3. Mean ± standard error of the mean (SEM). One-way ANOVA (E) or 2-way ANOVA (G) with post hoc Tukey multiple comparisons. A.U., arbitrary unit.
Figure 2
Figure 2. GREM1 and ISLR expression levels are associated with poor and favorable prognosis in patients with CRC, respectively.
(A, B) ISH for GREM1 and ISLR using human rectal samples. (A) Representative images. Yellow dotted lines indicate the borders between the lamina propria (LP) and muscularis mucosa (MM). Green, blue, and red arrowheads denote GREM1 or ISLR expression in the normal mucosa, adenoma, and adenocarcinoma, respectively. (B) Violin plots depicting GREM1 and ISLR ISH signal+ areas in the stroma. Three high-power fields (400×) per patient: 11 patients with normal mucosa, 3 with adenoma, and 11 with adenocarcinoma. Solid black lines indicate the median; dotted black lines indicate quartiles. (C, D) ISH analysis of 53 human primary rectal cancer surgical samples. (C) Representative images. Cases with a score of ≥3 and a score of ≥2 were defined as GREM1-high and ISLR-high, respectively. (D) Kaplan-Meier survival curves. (E) Kaplan-Meier survival curves in expression microarray data from 556 patients with primary colon cancer. Kruskal-Wallis test followed by Dunn post hoc multiple comparisons (B) and log rank test (D and E). Scale bars, 50 μm.
Figure 3
Figure 3. Grem1 and Islr identify distinct subpopulations of intestinal fibroblasts in the normal mouse colon and are differentially regulated by FOXL1.
(A, B) ISH for Grem1 and Islr in the adult normal mouse colon. (A) Representative images. Red and green arrowheads denote Grem1+ cells and Islr+ cells, respectively. Yellow dotted lines delineate the boundaries between epithelial cells (E) and stromal cells (S). White dotted lines indicate the borders between the lamina propria (LP) and muscularis mucosa (MM). V indicates blood vessels. (B) Violin plots depicting the positions of mesenchymal cells expressing Grem1 or Islr relative to the adjacent epithelial position; 344 Grem1+ cells and 512 Islr+ cells from 20 well-oriented crypts/mouse, 4 mice each. Black solid lines indicate the median; black dotted lines indicate quartiles. (C, D) smFISH for Foxl1 and IF for PDGFRα in Grem1-CreERT2 mice and Islr-CreERT2 mice. (C) Representative pictures. Yellow arrowheads indicate double-positive cells (Grem1+Foxl1+ cells or Grem1+PDGFRα+ cells). Red arrowheads denote Islr single-positive cells. (D) Foxl1 positivity and PDGFRα positivity in the Grem1+ cells and Islr+ cells. Four high-power fields (400×)/mouse, 3 mice each. (E, F) Lentivirus-mediated human FOXL1 (hFOXL1) overexpression in YH2 cells induces Grem1 up-regulation and decreases Islr expression. (E) Western blot. (F) qRT-PCR (n = 3). (G) CRISPR/Cas9-mediated knockdown of Foxl1 reduces Grem1 expression while upregulating Islr expression in primary mouse colonic fibroblasts as assessed by qRT-PCR (n = 3 mice each). (HK) FOXL1 interacts with a Grem1 intron region. (H) Western blot showing hFOXL1-HA overexpression in YH2 cells. (I) Schematic representation of a FOXL1-binding site in the mouse Grem1 intron (highlighted with yellow) and corresponding human GREM1 promoter regions used in luciferase assays. (J) ChIP–quantitative PCR in YH2 cells (n = 3). (K) Luciferase assays of a human GREM1 promoter (4.3 kbps) and a truncated human GREM1 promoter (3.6 kbps) that lacks the FOXL1-binding site (n = 4). Mean ± SEM. Mann-Whitney U test (B), 2-tailed unpaired Student t test (D, F, G, and J), and 2-way ANOVA with Tukey post hoc multiple comparisons (K). Scale bars, 50 μm. ORF, open reading frame; TSS, transcriptional start site.
Figure 4
Figure 4. GREM1+ CAFs are myofibroblastic CAFs, which are distinct from ISLR+ CAFs in human and mouse CRC.
(A, B) Dual smFISH for Grem1 and Islr in an azoxymethane/dextran sodium sulfate mouse model of CRC. (A) Representative pictures. Red, green, and yellow arrowheads denote Grem1+Islr, Grem1Islr+, and Grem1+Islr+ CAFs, respectively. (B) Semiquantification of the ratio of double-positive (Grem1+Islr+) cells in Grem1+ cells and Islr+ cells. Four high-power fields (400×)/mouse, 4 mice. (C, D) Grem1 smFISH or Islr smFISH followed by αSMA IF in azoxymethane/dextran sodium sulfate tumors. (C) Representative pictures. Yellow and green arrowheads indicate double-positive cells (Grem1+αSMA+ cells or Islr+αSMA+ cells) and Islr+αSMA cells, respectively. (D) αSMA positivity in Grem1+cells and Islr+ cells. Four high-power fields/mouse, 4 mice each. (EG) Dual smFISH for GREM1 and ISLR followed by αSMA IF in human CRC. (E) Representative pictures. Red and green arrowheads denote GREM1+αSMA+ cells and ISLR+αSMA cells, respectively. (F) Semiquantification of the ratio of double-positive (GREM1+ISLR+) cells in GREM1+ cells and ISLR+ cells. (G) αSMA positivity in GREM1+ cells and ISLR+ cells; 4–6 high-power fields/patient, 5 patients. (H, I) GREM1+ CAFs are spatially distinct from ISLR+ CAFs in human desmoplastic rectal cancer. (H) Representative pictures of GREM1 and ISLR ISH on human desmoplastic rectal cancer samples. Red and green arrowheads denote GREM1 and ISLR expression, respectively. (I) Quantification of the minimum distance between GREM1 or ISLR ISH signals and the closest tumor cells; n = 38,396 (GREM1) and 18,028 DAB+ signals (ISLR) from 3 low-power fields (100×)/patient, 7 patients each. (J) YH2 cells were stimulated with a vehicle, recombinant TGF-β1, or recombinant TGFβ1 + Galunisertib for 24 hours, followed by qRT-PCR (n = 3). Mean ± SEM. Mann-Whitney U test (D, G, and I) and 1-way ANOVA with Tukey post hoc multiple comparisons (J). The boxed areas are magnified in the adjacent panels (A, C, and E). Scale bars, 50 μm (A, C, and E) and 250 μm (H). ****P < .0001, **P = .0013, *P = .0122. AOM, azoxymethane; DMSO, dimethyl sulfoxide; DSS, dextran sodium sulfate; M, mol/L.
Figure 5
Figure 5. A GREM1-neutralizing antibody or CM from Islr-overexpressing intestinal fibroblasts restrains CRC tumoroid growth and promotes Lgr5+ stem cell differentiation via increased BMP signaling in tumoroids.
(A) Experimental schematic depicting CM transfer from Grem1-overexpressing YH2 cells to AP (ApcΔ/Δ and Trp53Δ/Δ) tumoroids or APS (ApcΔ/Δ, Trp53Δ/Δ, and Smad4Δ/Δ) tumoroids. Either an IgG isotype or a GREM1-neutralizing antibody was added to the tumoroids. (B) qRT-PCR for Id1 in AP and APS tumoroids (n = 3). (C) Representative pictures of AP tumoroids and APS tumoroids. (D) Luciferase signals from AP tumoroids and APS tumoroids (n ≥ 8). (E) qRT-PCR for Lgr5 and Krt20 in AP and APS tumoroids (n = 3). (F) Experimental schematic depicting CM transfer from Islr-overexpressing YH2 cells to AP tumoroids. CM was collected from Islr- or GFP-overexpressing YH2 cells incubated with 10 ng/mL of recombinant BMP7 (rBMP7). (G) qRT-PCR for Id1 in AP tumoroids (n = 3). (H) Representative pictures of AP tumoroids. (I) Luciferase signals from AP tumoroids (n = 14). (J) qRT-PCR for Lgr5 and Krt20 in AP tumoroids (n = 3). Scale bars, 500 μm. Mean ± SEM. Two-tailed unpaired Student t test (B, D, E, G, I, and J). Note that data normalization was performed within the AP and APS tumoroid groups separately (B, D, and E). Ab, antibody.
Figure 6
Figure 6. AAV8-mediated Islr overexpression in hepatocytes augments BMP signaling and retards CRC hepatic metastasis growth.
(A) Experimental scheme. Yellow dotted lines outline the portal vein. (B, C) ISH for Islr in the liver 2 weeks after tail vein injection of AAV8-Islr or AAV8-mRuby2. (B) Representative images. Red and blue arrowheads denote the endogenous expression of Islr in fibroblastic cells in the portal area and ectopic overexpression of Islr in hepatocytes, respectively. The yellow dotted line indicates the border between the portal area (P) and hepatocytes (H) (C) Semiquantification; 5 high-power fields (400×)/mouse, 3 mice each. (D, E) Immunohistochemistry for pSmad1/5/8 in liver metastases. (D) Representative pictures. (E) Quantification of 3,3′-diaminobenzidine (DAB) intensity: 5 high-power fields/mouse, 4 mice each. (F) Kaplan-Meier survival curves. (G, H) Luciferase signals from AP tumoroids were assessed by an in vivo imaging system (IVIS). (G) Representative images. (H) Growth kinetics. Signals within red rectangles in F were quantified; n = 5 (AAV-mRuby2) and 8 (AAV-Islr) mice. (I) Representative macroscopic pictures and H&E-stained sections of liver metastases. Dotted lines indicate borders between tumors (T) and the normal liver (N). (J) Quantification of tumor areas using H&E stained sections; 3 liver pieces/mouse, 5 (AAV-mRuby2) and 8 (AAV-Islr) mice. (K, L) Immunohistochemistry for Ki-67: (K) representative pictures and (L) Ki-67 positivity in total epithelial cells. Four high-power fields/mouse, 4 mice each. (M, N) Evaluation of tumor cell differentiation status. (M) Representative pictures of immunohistochemistry for EpCAM. Green dotted lines indicate tumor budding. (N) The ratio of poorly differentiated tumor areas in the total tumor areas; 11 liver pieces each group from 5 (AAV-mRuby2) and 8 (AAV-Islr) mice. Scale bars represent 200 μm (A, B), 1 cm (macroscopic pictures in I), 1 mm (H&E staining in I), and 50 μm (D, K, and M). Mean ± SEM. Mann-Whitney U test (C, E, J, L, and N), log rank test (F), and 2-way repeated-measures ANOVA with post hoc Sidak multiple comparison test at week 3 (H). diff, differentiated; IHC, immunohistochemistry; IVIS, in vivo imaging system.

References

    1. Ganesh K, Stadler ZK, Cercek A, et al. Immunotherapy in colorectal cancer: rationale, challenges and potential. Nat Rev Gastroenterol Hepatol. 2019;16:361–375. - PMC - PubMed
    1. Kobayashi H, Enomoto A, Woods SL, et al. Cancer-associated fibroblasts in gastrointestinal cancer. Nat Rev Gastroenterol Hepatol. 2019;16:282–295. - PubMed
    1. Bach D-H, Park HJ, Lee SK. The dual role of bone morphogenetic proteins in cancer. Mol Ther Oncolytics. 2018;8:1–13. - PMC - PubMed
    1. Jung B, Staudacher JJ, Beauchamp D. Transforming growth factor β superfamily signaling in development of colorectal cancer. Gastroenterology. 2017;152:36–52. - PMC - PubMed
    1. McCarthy N, Manieri E, Storm EE, et al. Distinct mesenchymal cell populations generate the essential intestinal BMP signaling gradient. Cell Stem Cell. 2020;26:391–402. - PMC - PubMed

Publication types

MeSH terms

Substances