. 2021 Jan 15:453:168-186.
doi: 10.1016/j.neuroscience.2020.10.025. Epub 2020 Nov 14.

d-Serine Intervention In The Medial Entorhinal Area Alters TLE-Related Pathology In CA1 Hippocampus Via The Temporoammonic Pathway

Affiliations

d-Serine Intervention In The Medial Entorhinal Area Alters TLE-Related Pathology In CA1 Hippocampus Via The Temporoammonic Pathway

Stephen Beesley et al. Neuroscience. .

Abstract

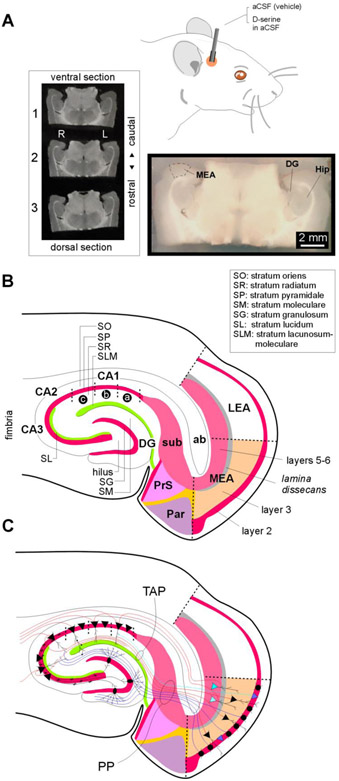
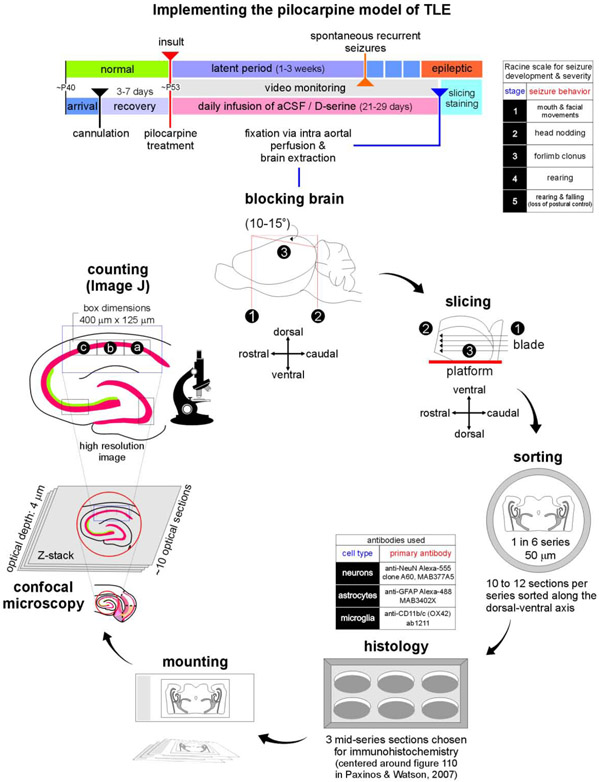
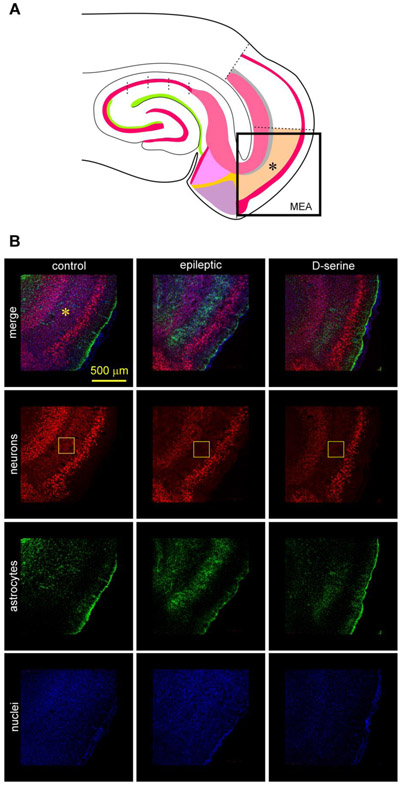
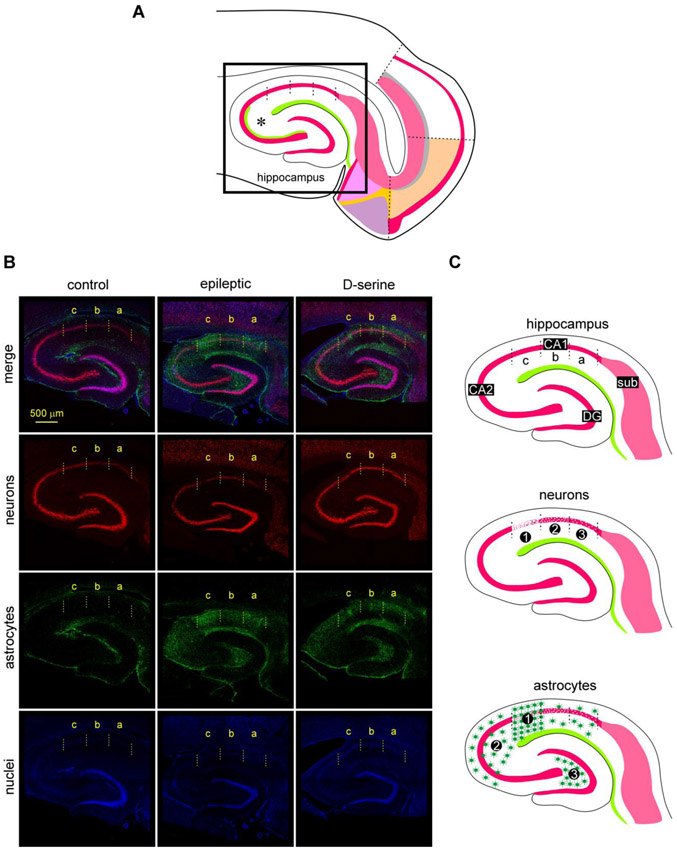
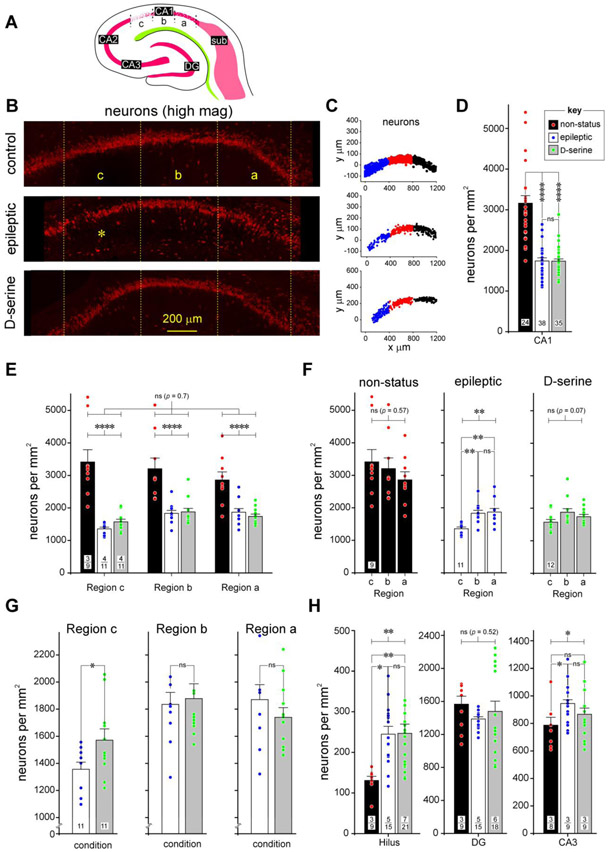
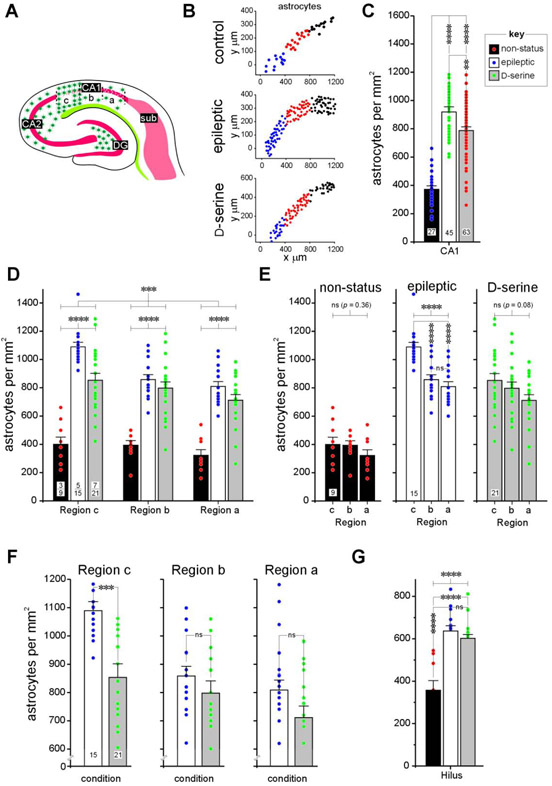
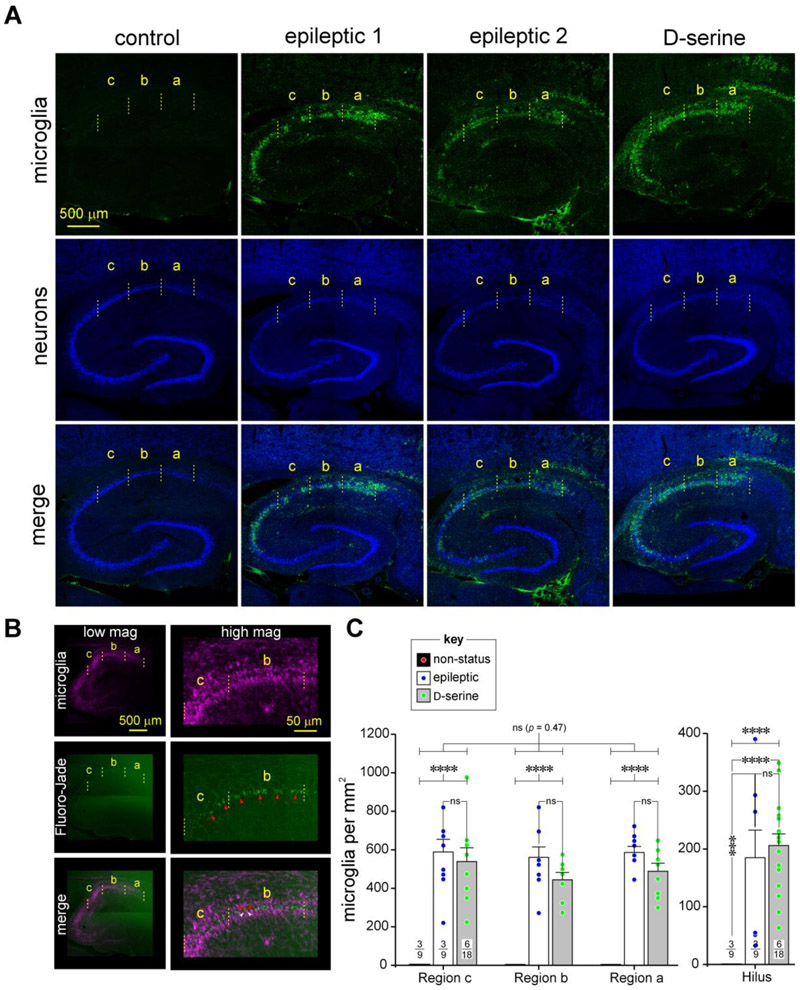
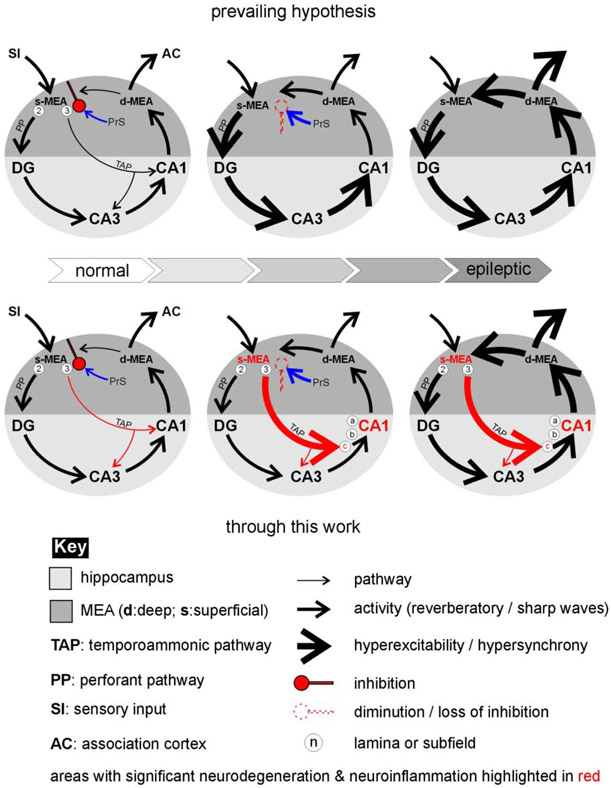
Entrainment of the hippocampus by the medial entorhinal area (MEA) in Temporal Lobe Epilepsy (TLE), the most common type of drug-resistant epilepsy in adults, is believed to be mediated primarily through the perforant pathway (PP), which connects stellate cells in layer (L) II of the MEA with granule cells of the dentate gyrus (DG) to drive the hippocampal tri-synaptic circuit. Using immunohistochemistry, high-resolution confocal microscopy and the rat pilocarpine model of TLE, we show here that the lesser known temporoammonic pathway (TAP) plays a significant role in transferring MEA pathology to the CA1 region of the hippocampus independently of the PP. The pathology observed was region-specific and restricted primarily to the CA1c subfield of the hippocampus. As shown previously, daily intracranial infusion of d-serine (100 μm), an antagonist of GluN3-containing triheteromeric N-Methyl d-aspartate receptors (t-NMDARs), into the MEA prevented loss of LIII neurons and epileptogenesis. This intervention in the MEA led to the rescue of hippocampal CA1 neurons that would have otherwise perished in the epileptic animals, and down regulation of the expression of astrocytes and microglia thereby mitigating the effects of neuroinflammation. Interestingly, these changes were not observed to a similar extent in other regions of vulnerability like the hilus, DG or CA3, suggesting that the pathology manifest in CA1 is driven predominantly through the TAP. This work highlights TAP's role in the entrainment of the hippocampus and identifies specific areas for therapeutic intervention in dealing with TLE.

Keywords: Hippocampus; Neurodegeneration; Perforant pathway; Temporal lobe epilepsy; Temporoammonic pathway; d-Serine intervention.


Figures

Fig. 1:
Fig. 1:. Details of MEA-hippocampal connectivity in acute brain slices.
A, Schematic of the route and mode of D-serine administration. An actual brain slice (bottom) containing the MEA (area entorhinalis pars medialis) that was micro dissected out to highlight the relative location of the hippocampus (Hip) including the dentate gurus (DG). The three midseries sections (top-left) of a 1-in-6 series of brain sections (50 μm-thick, covering the dorsalventral extent of the MEA) used for histology in this study. B, Schematic of a MEA-hippocampal brain slice detailing the major subdivisions of the parahippocampal region including MEA, LEA (lateral entorhinal area), presubiculum (PrS) subiculum (sub), parasubiculum (Par) and the hippocampus (DG, hilus, CA1-3). Laminar organization within MEA and hippocampus is also demarcated. ab, angular bundle. C, Schematic of a MEA-hippocampal brain slice detailing the putative origins and destinations of the perforant pathway (PP, blue) and the temporoammonic pathway (TAP, red) that connect the MEA to the hippocampus. Cell types are designated as follows: pyramidal cells (triangular stomata), stellate cells (circular stomata) and granule cells (oval stomata, whose axons make up the mossy fibers).
Fig. 2:
Fig. 2:. Outline of the approach used in our investigation.
Timeline of experimental manipulations used in implementing the pilocarpine model of TLE (top). Video monitoring was used to screen animals for frank seizure activity (severity scored on a Racine scale, inset), and confirm animals with spontaneous recurrent seizures as epileptic at the end of the latent period. Sequence of steps beginning with the harvesting of brains and sample preparation, to imaging histologically processed tissue using high resolution confocal microscopy (bottom).
Fig 3:
Fig 3:. TLE-related pathology in the MEA.
A, Schematic of the MEA-hippocampal brain slice showing the area imaged in B using high resolution confocal microscopy. B, Immunofluorescence images of the MEA (*, top down panels) in a non-status control (left), epileptic (middle), and post-status rat treated with D-serine (right). Triple immunostaining of neurons (red), astrocytes (green) and nuclei (blue) highlighting neuronal and astroglial pathology within MEA (topmost horizontal panel). Neurons immunoassayed with fluorescently tagged antibodies against NeuN (red, second horizontal panel from top), astrocytes with antibodies against GFAP (green, third horizontal panel from top), and nuclei with DAPI (blue, fourth horizontal panel from top) shown separately [for quantification of data in MEA see (Beesley, et al., 2020)]. The core of the pathology, including cell loss and astrogliosis occurs in layer III of the MEA (rectangular boxes in yellow).
Fig 4:
Fig 4:. TLE-related pathology in the hippocampus.
A, Schematic of the MEA-hippocampal brain slice showing the area imaged in B using high resolution confocal microscopy. B, Triple immunofluorescence images of the hippocampus (top down panels) in non-status controls (left), epileptic (middle), and post-status rats treated with D-serine (right) highlighting changes in neuronal (red) and astroglial (green) cell densities in the various subdivisions of CA1 and the hilus (nuclei, blue). Neurons immunoassayed with fluorescently tagged antibodies against NeuN (red, second horizontal panel from top), astrocytes with antibodies against GFAP (green, third horizontal panel from top) and nuclei with DAPI (blue, fourth horizontal panel from top) shown separately. Note that significant pathology, including cell loss, astrogliosis can be found in the CA1c subdivision. C, Schematic of the hippocampal portion of brain slices showing subdivisions of the CA1 subfield (top) that are affected (1, most effected, to 3, least effected) with respect to neurodegeneration (middle) and astrogliosis (bottom) in epileptic animals. Note that astrocytic density is markedly increased in CA1c (1), CA3 (2) and the hilus (3) of the hippocampus.
Fig 5:
Fig 5:. A detailed assessment of neurodegeneration in CA1 of the hippocampus in epileptic and D-serine treated animals.
A, Schematic of the hippocampal portion of the MEA-hippocampal brain slice showing subdivisions of the CA1 subfield and the extent of neurodegeneration in the various subdivisions. B, High magnification images of stratum pyramidale in the CA1 subfields of non-status controls (top), epileptic (middle), and post-status rats treated with D-serine (bottom) immunostained with fluorescently tagged antibodies against NeuN (red), to showcase the significant neurodegeneration in CA1c (*) and its rescue with D-serine intervention in the MEA. C, Representative examples of density grams for neurons, generated by plotting the precise location of cells counted on a grid in various subdivisions of CA1 (c, blue; b, red and a, black) under the indicated conditions. Note the thinning out of stratum pyramidale in CA1c in epileptic animals. D, Histogram of averaged neuronal density across the entire CA1 subfield under the indicated conditions. Data within bar plots indicate number of animals used (n) and error bars indicate SEM. The key (inset) pertains to non-status controls, epileptic, and D-serine-treated animals in this and all subsequent histograms. Unless otherwise indicated, in this and subsequent figures, p values are determined with either a parametric or non-parametric (np) 1- or 2-way ANOVA and where appropriate, t-test with Welch’s correction or an unpaired (np) Mann-Whitney test. **** p < 0.0001, ns, not significant. E, Histograms of averaged neuronal densities across various subdivisions of CA1 under the conditions indicated in the bar plots (non-status controls, epileptic and D-serine-treated; key in D). In this and all subsequent figures, data within bar plots indicates number of animals (n) used (numerator) and the total number of sections assayed (denominator) for each condition. Error bars indicate SEM. **** p < 0.0001, ns, not significant. F, Histogram of averaged neuronal density across individual subdivisions of the CA1 subfield under the indicated conditions. Data within bar plots indicate number of animals used (n) and error bars indicate SEM. ** p < 0.01, ns, not significant. G, Histogram of averaged neuronal density in epileptic and D-serine treated animals in the indicated subdivisions of the CA1 subfield. Data within bar plots indicate number of animals used (n) and error bars indicate SEM. * p < 0.05, ns, not significant. H, Histograms of averaged neuronal densities across the indicate subdivisions of the hippocampus, hilus (left), dentate gyrus (DG, middle) and CA3 (right), under the conditions indicated in the bar plots (non-status controls, epileptic and D-serine-treated; key in D). Data within bar plots indicates number of animals (n) used (numerator) and the total number of sections assayed (denominator) for each condition. Error bars indicate SEM. * p < 0.05, ** p < 0. 01, ns, not significant.
Fig 6:
Fig 6:. A detailed assessment of astrogliosis in CA1 of the hippocampus in epileptic and D-serine treated animals.
A, Schematic of MEA-hippocampal brain slice showing subdivisions of the CA1 subfield and the extent of astrogliosis in the various subdivisions. B, Representative examples of density grams for astrocytes, generated by plotting the precise location of cells counted on a grid in various subdivisions of CA1 (c, blue; b, red and a, black) under the indicated conditions. Note the upregulation of astrocytic density in CA1c in epileptic animals. C, Histogram of averaged astrocytic density across the entire CA1 subfield under the indicated conditions. Data within bar plots indicate number of animals used (n) and error bars indicate SEM. The key (inset) pertains to non-status controls, epileptic and D-serine-treated animals in this and all subsequent histograms. **** p < 0.0001, ** p < 0.01, ns, not significant. D, Histograms of averaged astrocytic densities across various subdivisions of CA1 under the conditions indicated in the bar plots (non-status controls, epileptic and D-serine-treated; key in C). Data within bar plots indicates number of animals (n) used (numerator) and the total number of sections assayed for each condition (denominator). Error bars indicate SEM. Unless otherwise indicated, in this and subsequent figures, p values are determined with either a parametric or non-parametric (np) 1- or 2-way ANOVA and where appropriate, t-test with Welch’s correction or an unpaired (np) Mann-Whitney test. *** p < 0.001, **** p < 0.0001, ns, not significant. E, Histogram of averaged astrocytic density across individual subdivisions of the CA1 subfield under the indicated conditions. Data within bar plots indicate number of animals used (n) and error bars indicate SEM. **** p < 0.0001, ns, not significant. F, Histogram of averaged astrocytic density in epileptic and D-serine treated animals in the indicated subdivisions of the CA1 subfield. Data within bar plots indicate number of animals used (n) and error bars indicate SEM. *** p < 0.001, ns, not significant. G, Histograms of averaged astrocytic densities in the hilus under the indicated conditions (non-status controls, epileptic and D-serine-treated; key in C). Data within bar plots indicates number of animals (n) used (numerator) and the total number of sections assayed for each condition (denominator). Error bars indicate SEM. **** p < 0.0001, ns, not significant.
Fig 7:
Fig 7:. An assessment of microgliosis in CA1 of the hippocampus in epileptic and D-serine treated animals.
A, Immunofluorescence images of the hippocampus (top down panels) in non-status controls (left), epileptic (middle two), and post-status rats treated with D-serine (right) highlighting changes in microglial cell densities in the various subdivisions of CA1 and the hilus. Microglia immunoassayed with fluorescently tagged anti-CD11b antibody, OX-42 (green, topmost horizontal panel) and neurons with antibodies against NeuN (blue, second horizontal panel from top) shown separately (top two panels) and merged images (bottommost panel from top). Note the conspicuous infiltration and/or proliferation of microglia in the CA1 subfield of the hippocampus in the epileptic animals. B, Co-staining of sections histologically processed for microglia (purple, topmost horizontal panel) with FluroJade (green, second horizontal panel from top), a marker of neural degeneration. Note spatial colocalization of the purple and green signals (merged images, bottom panel) in the low (left) and high (right) magnification images indicate that manifestation of microglia in the CA1 region of epileptic animals is associated with neurodegeneration. C, Histograms of averaged microglia densities across various subdivisions of CA1 (left) and the hilus (right) under the conditions indicated in the bar plots (key: non-status controls, epileptic and D-serine-treated). Note that microglia are essentially absent in non-status control animals. Data within bar plots indicates number of animals (n) used (numerator) and the total number of sections assayed for each condition (denominator). Error bars indicate SEM. *** p < 0.001, **** p < 0.0001, ns, not significant.
Fig 8:
Fig 8:. A hypothetical model for how the MEA might entrain the hippocampus in TLE.
Modifications made to the prevailing hypothesis through the current work on changes in activity patterns within the MEA-hippocampal network lead to the epileptic state highlighting the putative roles of the perforant (black) and temporoammonic (red) pathways in mediating these changes.

References

    1. Andersen P, Bliss TV, Skrede KK (1971), Lamellar organization of hippocampal pathways. Exp Brain Res 13:222–238. - PubMed
    1. Ang CW, Carlson GC, Coulter DA (2005), Hippocampal CA1 circuitry dynamically gates direct cortical inputs preferentially at theta frequencies. J Neurosci 25:9567–9580. - PMC - PubMed
    1. Basu J, Zaremba JD, Cheung SK, Hitti FL, Zemelman BV, Losonczy A, Siegelbaum SA (2016), Gating of hippocampal activity, plasticity, and memory by entorhinal cortex long-range inhibition. Science 351:aaa5694. - PMC - PubMed
    1. Beesley S, Sullenberger T, Crotty K, Ailani R, D'Orio C, Evans K, Ogunkunle EO, Roper MG, et al. (2020), D-serine mitigates cell loss associated with temporal lobe epilepsy. Nat Commun 11:4966. - PMC - PubMed
    1. Beesley S, Sullenberger T, Kumar SS (2020), The GluN3 subunit regulates ion selectivity within native N-methyl-Daspartate receptors. IBRO Reports 9:147–156. - PMC - PubMed

Publication types