. 2020 Dec;22(12):820-830.
doi: 10.1016/j.neo.2020.10.011. Epub 2020 Nov 14.

Evaluating patient-specific neoadjuvant regimens for breast cancer via a mathematical model constrained by quantitative magnetic resonance imaging data

Affiliations

Evaluating patient-specific neoadjuvant regimens for breast cancer via a mathematical model constrained by quantitative magnetic resonance imaging data

Angela M Jarrett et al. Neoplasia. 2020 Dec.

Abstract

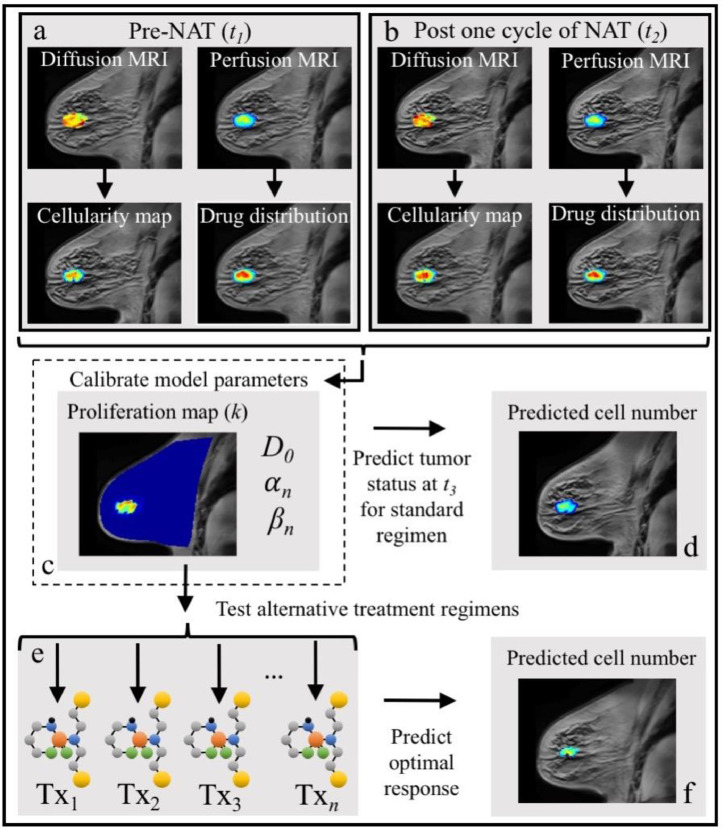
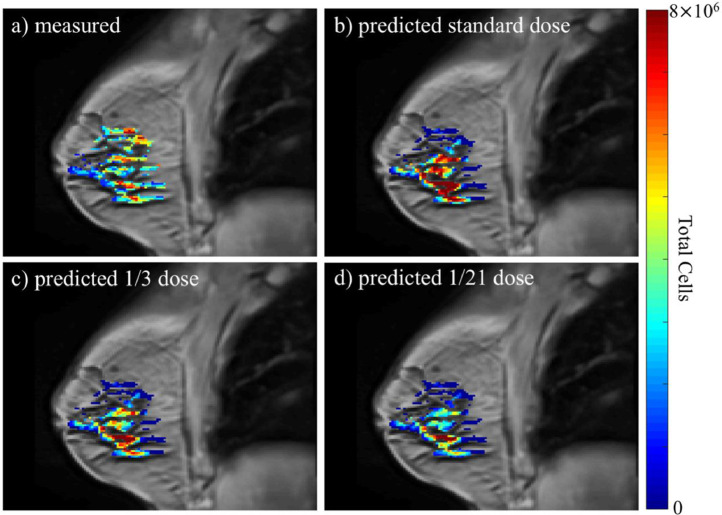
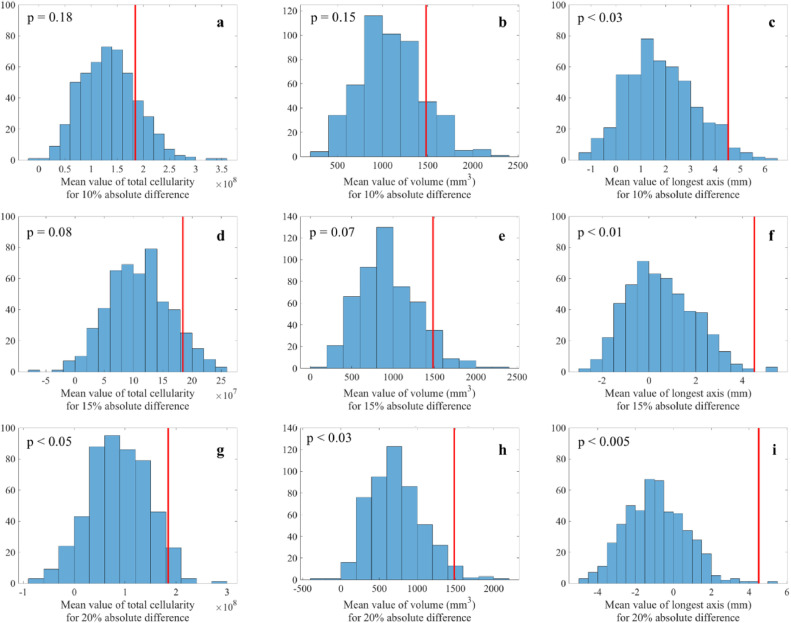
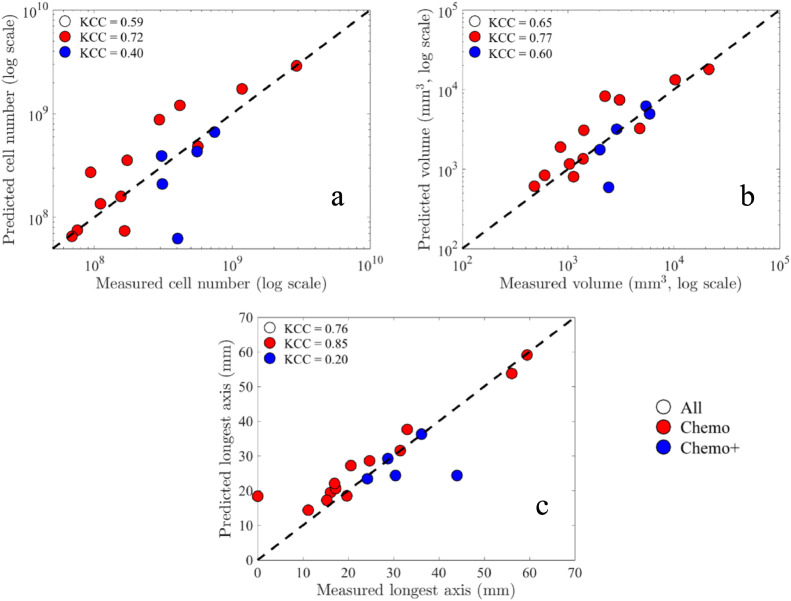
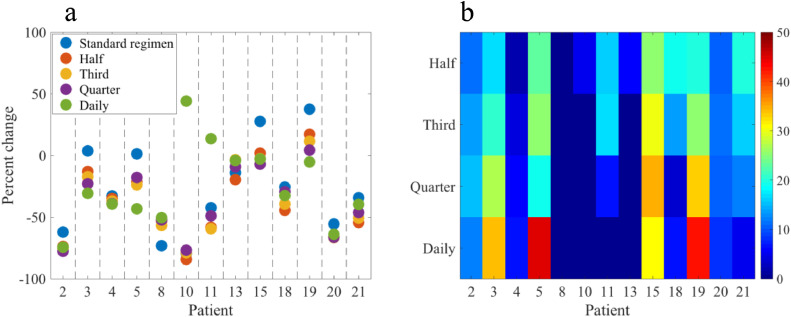
The ability to accurately predict response and then rigorously optimize a therapeutic regimen on a patient-specific basis, would transform oncology. Toward this end, we have developed an experimental-mathematical framework that integrates quantitative magnetic resonance imaging (MRI) data into a biophysical model to predict patient-specific treatment response of locally advanced breast cancer to neoadjuvant therapy. Diffusion-weighted and dynamic contrast-enhanced MRI data is collected prior to therapy, after 1 cycle of therapy, and at the completion of the first therapeutic regimen. The model is initialized and calibrated with the first 2 patient-specific MRI data sets to predict response at the third, which is then compared to patient outcomes (N = 18). The model's predictions for total cellularity, total volume, and the longest axis at the completion of the regimen are significant within expected measurement precision (P< 0.05) and strongly correlated with measured response (P < 0.01). Further, we use the model to investigate, in silico, a range of (practical) alternative treatment plans to achieve the greatest possible tumor control for each individual in a subgroup of patients (N = 13). The model identifies alternative dosing strategies predicted to achieve greater tumor control compared to the standard of care for 12 of 13 patients (P < 0.01). In summary, a predictive, mechanism-based mathematical model has demonstrated the ability to identify alternative treatment regimens that are forecasted to outperform the therapeutic regimens the patients clinically. This has important implications for clinical trial design with the opportunity to alter oncology care in the future.

Keywords: Chemotherapy; DCE-MRI; DW-MRI; Forecasting; Simulation.


Figures

Fig 1
Figure 1
Graphical depiction of the integration of breast MRI data with the mathematical model for predicting tumor response and simulating alternative treatment regimens. The data from MRI scans obtained before and after one cycle of the first NAT regimen, are used to generate spatially resolved maps of tumor cell number and drug delivery (panels a and b, respectively). The model parameters are then calibrated using this early NAT imaging data (panel c), and the model is run forward to the time of the patient's third scan (panel d). The model's predictions of total cellularity, total volume, and longest axis measures are then directly compared to each patient's actual tumor outcome as determined by their scan 3 data. The model's predictions were also compared to the RECIST designations to determine accuracy in the context of clinical measures. Using the patient-specific model parameters (panel c), alternative therapy regimens adjusting the frequency and dosage of treatments (“Txi”, panel e) are evaluated using the model's predictions from scan 2 to 3 for each of these regimens to determine an optimal treatment schedule for each patient (panel f).
Fig 2
Figure 2
Example results for the predicted response to NAT regimens for 1 patient (patient 4) whose standard-of-care regimen consisted of combination doxorubicin and cyclophosphamide every 3 weeks for 12 weeks (4 total cycles). The figure depicts anatomical images of a central slice of the breast overlaid with the total tumor cellularity in color. While there is not an exact match between the patient's actual scan 3 data (panel a) and the prediction for the standard regimen (i.e., the standard-of-care regimen the patient actually received, panel b), the percent differences between the predicted and measured tumor response for the standard-of-care regimen are 1%, 16%, and 1% for total cellularity, volume, and longest axis. The total cellularity predicted for 2 alternative regimens are also depicted: 1/3 of a dose every week (panel c), and 1/21 of a dose administered daily (panel d). (Note: each alternative regimen had the same total drug over the treatment period as the standard-of-care regimen). Across all the regimens, the model predicted the greatest tumor cell reduction when the daily dose regimen was implemented. Compared to the standard-of-care regimen, the model predicted that the daily dose regimen would result in an additional 45% reduction in total tumor cellularity.
Fig 3
Figure 3
Distributions of sample averages between predicted and measured outcomes (i.e., total cellularity, volume, and longest axis) generated with a Monte Carlo resampling (N = 500 for each distribution) across the patient cohort. (See Supplemental Material for details on the construction of these plots.) Each panel depicts the distribution of the randomly sampled differences between each predicted and measured outcome. The red vertical lines indicate the mean difference for the cohort. (Note that the red lines do not represent mean of the sampled distributions and, therefore, are not in the center of the distributions.) For example, panel a presents the sample mean differences between the predicted and measured total cellularity assuming a 10% absolute difference between predicted and measured total cellularity. Panels b and c display similar data for volume and longest dimension, respectively. Panels d–f correspond to panels a–c, but assuming a 15% absolute difference between predicted and measured total cellularity, volume, and longest axis, respectively. Panels g-i also correspond to panels a–c but assume a 20% absolute difference between predicted and measured total cellularity, volume, and longest axis, respectively.
Fig 4
Figure 4
Scatter plots comparing the model predictions to the actual measurements of scan 3 for each patient (N = 18) along with the corresponding KCCs per group (see CCCs and PCCs in the text). The dashed line indicates the 45o line of unity. Note that for all 3 tumor response measures, there is greater correlation for the chemo subgroup compared to the chemo+ (i.e., patients that received chemotherapy plus targeted therapy or immunotherapy). Panel (a) depicts the comparison between the predicted total cell number to the measured total cell number as estimated from the DW-MRI data. Panel (b) depicts the comparison between the predicted total tumor volume to the measured tumor volume as determined by the total number of voxels in the tumor ROI. Panel (c) depicts the comparison of the predicted longest axis of the tumors to the actual measured longest axes as determined from the tumor ROI of scan 3. Note that using the log scale for panels (a) and (b), 1 patient is not shown where zero tumor was measured at the time of scan 3 (chemo subgroup, patient 4), but corresponding KCC values include this data.
Fig 5
Figure 5
Comparison of the percent change in total tumor cellularity from scan 2 to the time of scan 3 achieved by the standard regimen, a one-half dose double frequency regimen, a one-third dose triple frequency regimen, a one-quarter dose quadruple frequency regimen, and an equivalent daily dose when administered daily to each patient (panel a). Across patients, differences in the percent change between the standard therapeutic regimen and the model-identified, most effective regimen have a maximum difference of 46%, a minimum difference of 0%, and a median difference of 17% (panel b). Note: a positive difference indicates a potential additional percent reduction in the total tumor cellularity achieved by the alternative regimen compared to the standard dose the patient received. The group of standard regimens was found to be statistically inferior to the group of optimal regimens selected for each patient for tumor control/reduction (P < 0.001 for percent change from scan 2 to 3 and for the predicted cell number at the time of scan 3). The most effective regimens by number of patients: standard N = 1, one-half N = 4, one-third N = 2, one-quarter N = 2, daily N = 4.

References

    1. Arnaout A., Lee J., Gelmon K., Poirier B., Lu F.I., Akra M., Boileau J.F., Tonkin K., Li H., Illman C. Neoadjuvant therapy for breast cancer:updates and proceedings from the seventh annual meeting of the canadian consortium for locally advanced breast cancer. Curr Oncol. 2018;25(5):e490–e498.
    1. Thompson A.M., Moulder-Thompson S.L. Neoadjuvant treatment of breast cancer. Ann Oncol. 2012;23(10):x231–x236. - PMC - PubMed
    1. Pinkel D. The use of body surface area as a criterion of drug dosage in cancer chemotherapy. Cancer Res. 1958;18(7):853–856. - PubMed
    1. Dunnwald L.K., Rossing M.A., Li C.I. Hormone receptor status, tumor characteristics, and prognosis: a prospective cohort of breast cancer patients. Breast Cancer Res. 2007;9(1):R6. - PMC - PubMed
    1. Yang L., Zhong X., Pu T., Qiu Y., Ye F., Bu H. Clinical significance and prognostic value of receptor conversion in hormone receptor positive breast cancers after neoadjuvant chemotherapy. World J Surg Oncol. 2018;16(1):51. - PMC - PubMed

Publication types

MeSH terms