. 2020 Nov 10;12(22):22776-22793.
doi: 10.18632/aging.103921. Epub 2020 Nov 10.

Immune-related biomarker risk score predicts prognosis in prostate cancer

Affiliations

Immune-related biomarker risk score predicts prognosis in prostate cancer

Zezhen Liu et al. Aging (Albany NY). .

Abstract

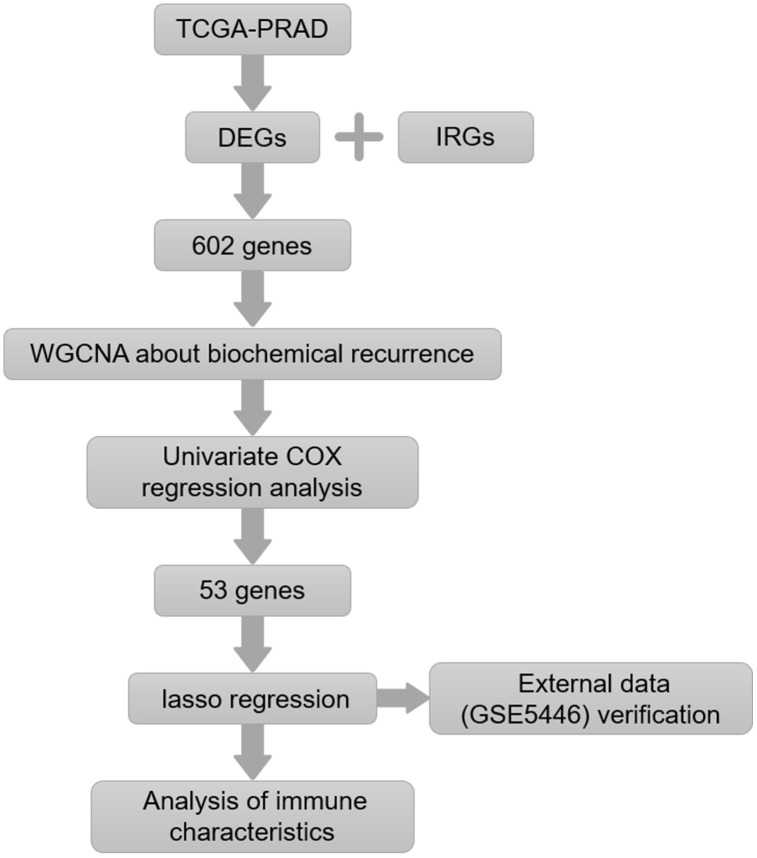
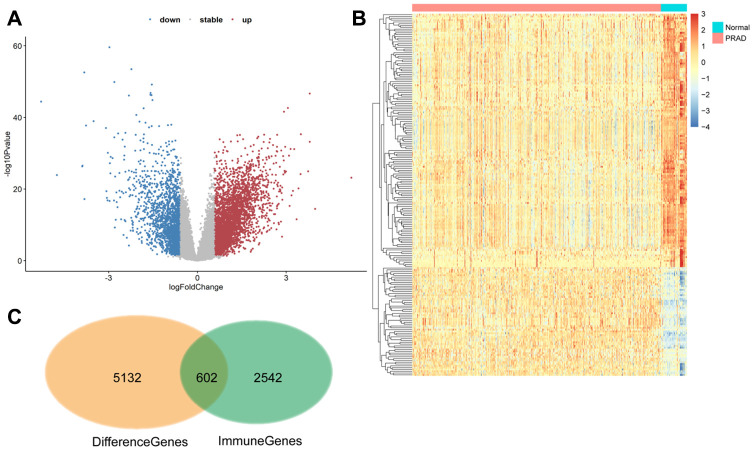
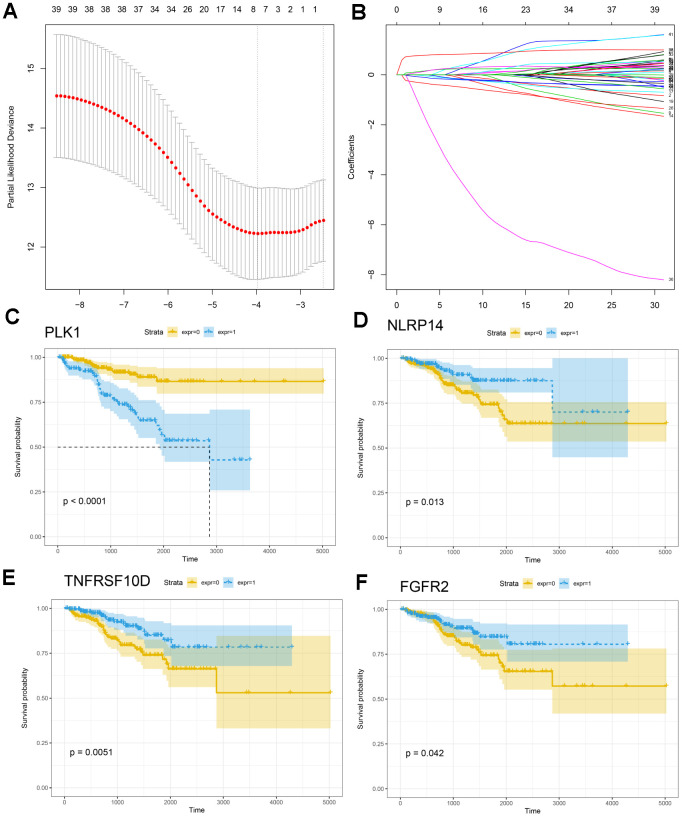
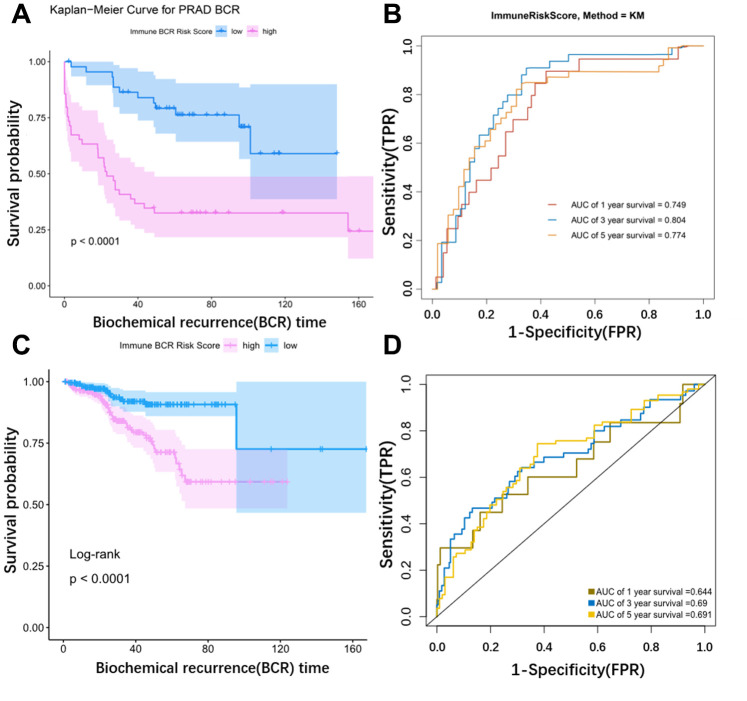
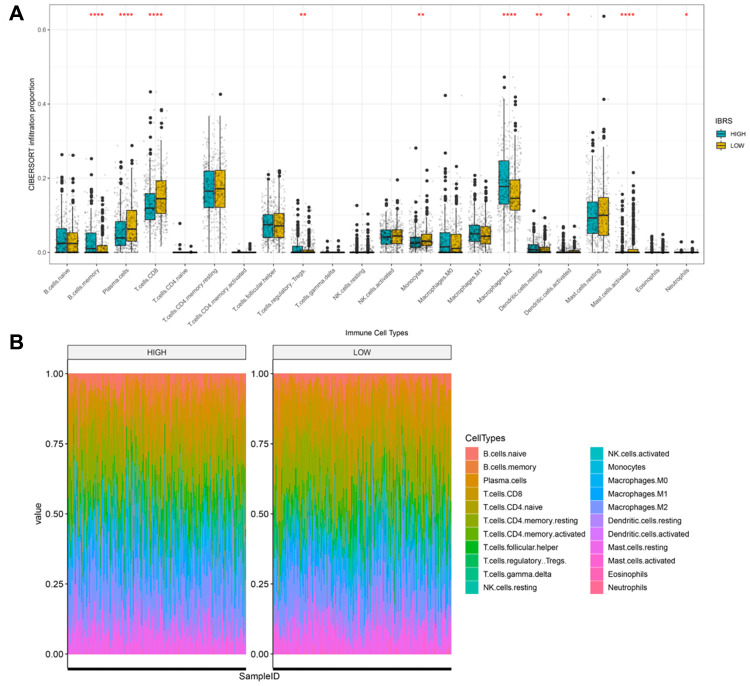
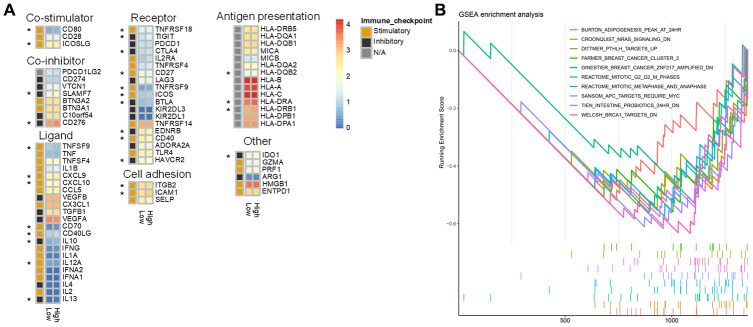
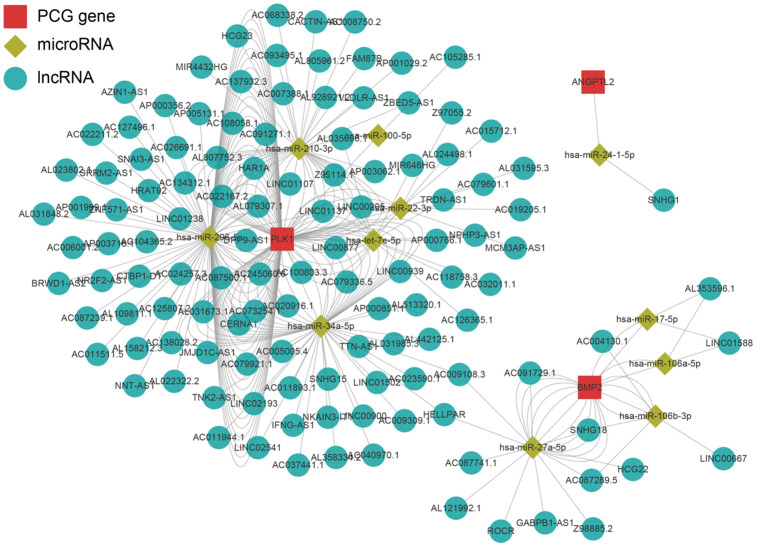
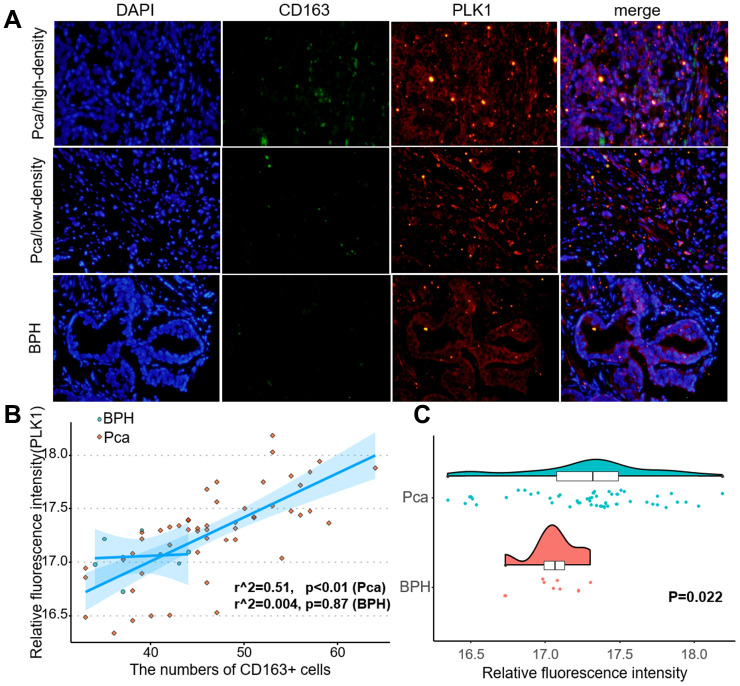
In this study, we constructed a model using a Cox proportional hazards model based on the expression of eight immune-related genes that were associated with prognosis in prostate cancer: EDNRB, ANGPTL2, TNFSF15, TNFRSF10D, EDN2, BMP2, NLRP14, and PLK1. We then identified associations between risk scores calculated with the model, tumor microenvironment characteristics, and immune cell infiltration. Prostate cancer patients in the high score group had poorer prognoses, and validation with the external GSE54460 dataset confirmed that the scoring model predicted biochemical recurrence with AUC values of 0.749 at 1 year, 0.804 at 3 years, and 0.774 at 5 years. Proportions of infiltrated M2 macrophages and regulatory T cells were increased in the high risk group, while CD8+ T cells were increased in the low risk group. Network analysis revealed that PLK1 may be a key regulator of the immune-suppressive microenvironment in prostate cancer. Double immunofluorescence labeling of a prostate cancer tissue microarray indicated that PLK1 expression correlated positively with numbers of infiltrating macrophages. These results indicate that an immune- related, gene-based risk score effectively reflects immune microenvironment characteristics and predicts prognosis in prostate cancer.

Keywords: PLK1; immune microenvironment; immune-related genes; prostate cancer.


Conflict of interest statement

CONFLICTS OF INTEREST: The authors declare that there are no conflicts of interest regarding the publication of this paper.

Figures

Figure 1
Figure 1
Flow chart of the experimental strategy.
Figure 2
Figure 2
602 differentially expressed immune-related genes were identified. (A and B) Volcano plot and heat maps showing differentially expressed genes in TCGA prostate cancer samples. (C) The 602 differentially expressed immune genes were considered candidate genes for the risk model.
Figure 3
Figure 3
(A) Scale-free fit index for soft-thresholding powers. (B) Dendrogram showing all differentially expressed genes clustered based on different metrics. (C) Heatmap of correlations between module eigengenes and clinical traits. (D) Visualization of gene networks.
Figure 4
Figure 4
(A) Modular genetic correlation network map. Colors correspond to different modules. (B) Correlations between modules and clinical phenotypes. Red indicates positive correlations, blue indicates negative correlations.
Figure 5
Figure 5
Construction of the IRG-based prognostic model. (A, B) The number of factors included in the model was determined through LASSO analysis. (CF) KM curves for PLK1, NLRP14, TNFRSF10D, and FGFR2.
Figure 6
Figure 6
Validation of the model using external data. (A) KM curve for the external dataset (GSE54460). (B) Time dependent ROC curves. The AUC (Area Under Curve) was 0.749 at 1 year, 0.804 at 3 years, and 0.774 at 5 years in the GSE54460 cohort. (C) KM curve for TCGA. (D) Time dependent ROC curves. The AUC (Area Under Curve) was 0.644 at 1 year, 0.69 at 3 years, and 0.691 at 5 years in the TCGA cohort.
Figure 7
Figure 7
Cibersort was used to calculate infiltration scores for 22 immune cell types based on the TCGA prostate cancer expression profile. (A) Infiltration differences (ratio) in high and low risk groups. ****p<0.0001, ***p<0.001, **p<0.01, *p<0.05. (B) Infiltration profiles in the high and low risk groups.
Figure 8
Figure 8
Differences in immune characteristics between the high and low risk score groups. (A) Expression of 75 immunomodulators in the high and low risk groups. “*” indicates a difference in expression between the high and low risk groups. (B) Immune-related GSEA enrichment analysis.
Figure 9
Figure 9
Regulatory network of the key genes. Red squares indicate key genes, green diamonds indicate microRNAs, and green circles indicate lncRNA. Key genes for which literature reporting validated regulatory networks was not available were omitted.
Figure 10
Figure 10
PLK1 expression correlated positively with M2 macrophage infiltration. (A) Fluorescence imaging of human prostate cancer and adjacent noncancerous tissues with FITC-labeled CD163 and Cy3-labeled PLK1. Most green fluorescent signals were observed on the cytomembrane, while red fluorescent signals were primarily located in the cytoplasm in prostate tissue. (B) Numbers of green fluorescent cells and red fluorescence integral optical density were positively correlated in prostate cancer samples (r2=0.51, p<0.01). (C) PLK1 staining was more intense in prostate cancer tissues than in non-cancerous prostate tissues.

Similar articles

Cited by

References

    1. Siegel RL, Miller KD, Jemal A. Cancer statistics, 2020. CA Cancer J Clin. 2020; 70:7–30. 10.3322/caac.21590 - DOI - PubMed
    1. Bray F, Ferlay J, Soerjomataram I, Siegel RL, Torre LA, Jemal A. Global cancer statistics 2018: GLOBOCAN estimates of incidence and mortality worldwide for 36 cancers in 185 countries. CA Cancer J Clin. 2018; 68:394–424. 10.3322/caac.21492 - DOI - PubMed
    1. Jindal V. Immunotherapy: a glimmer of hope for metastatic prostate cancer. Chin Clin Oncol. 2018; 7:61. 10.21037/cco.2018.02.01 - DOI - PubMed
    1. Antonarakis ES, Piulats JM, Gross-Goupil M, Goh J, Ojamaa K, Hoimes CJ, Vaishampayan U, Berger R, Sezer A, Alanko T, de Wit R, Li C, Omlin A, et al.. Pembrolizumab for treatment-refractory metastatic castration-resistant prostate cancer: multicohort, open-label phase II KEYNOTE-199 study. J Clin Oncol. 2020; 38:395–405. 10.1200/JCO.19.01638 - DOI - PMC - PubMed
    1. Gao J, Ward JF, Pettaway CA, Shi LZ, Subudhi SK, Vence LM, Zhao H, Chen J, Chen H, Efstathiou E, Troncoso P, Allison JP, Logothetis CJ, et al.. VISTA is an inhibitory immune checkpoint that is increased after ipilimumab therapy in patients with prostate cancer. Nat Med. 2017; 23:551–55. 10.1038/nm.4308 - DOI - PMC - PubMed

Publication types

Substances