. 2020 Nov 12;12(11):1293.
doi: 10.3390/v12111293.

Significance of Viral Activity for Regulating Heterotrophic Prokaryote Community Dynamics along a Meridional Gradient of Stratification in the Northeast Atlantic Ocean

Affiliations

Significance of Viral Activity for Regulating Heterotrophic Prokaryote Community Dynamics along a Meridional Gradient of Stratification in the Northeast Atlantic Ocean

Kristina D A Mojica et al. Viruses. .

Abstract

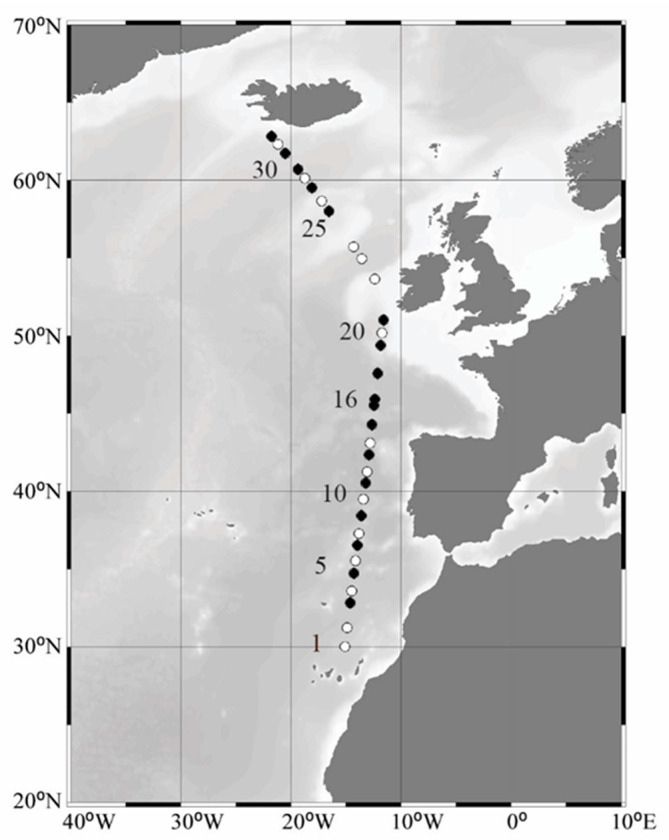
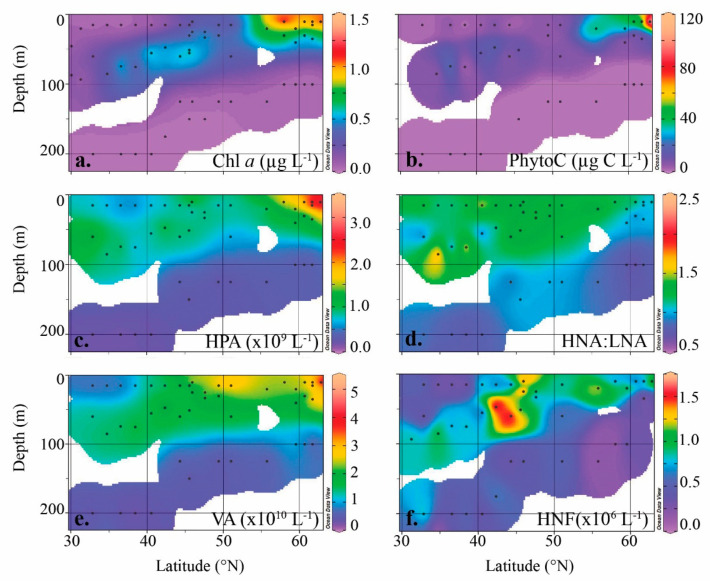
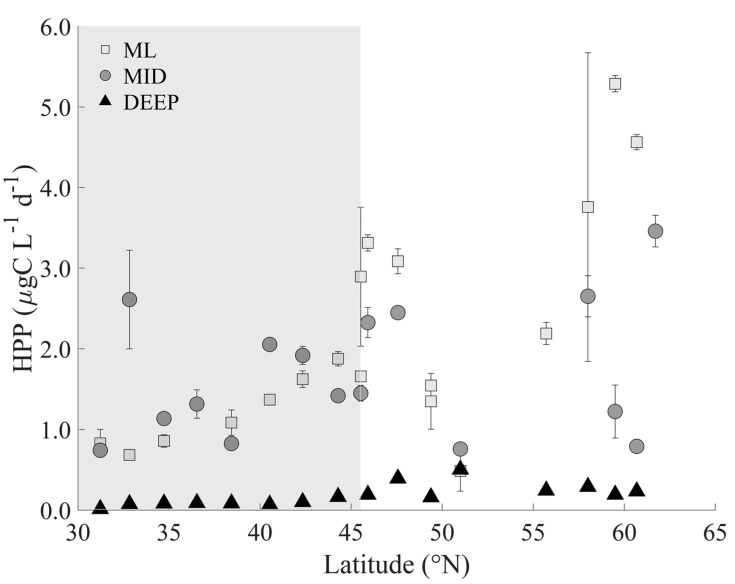
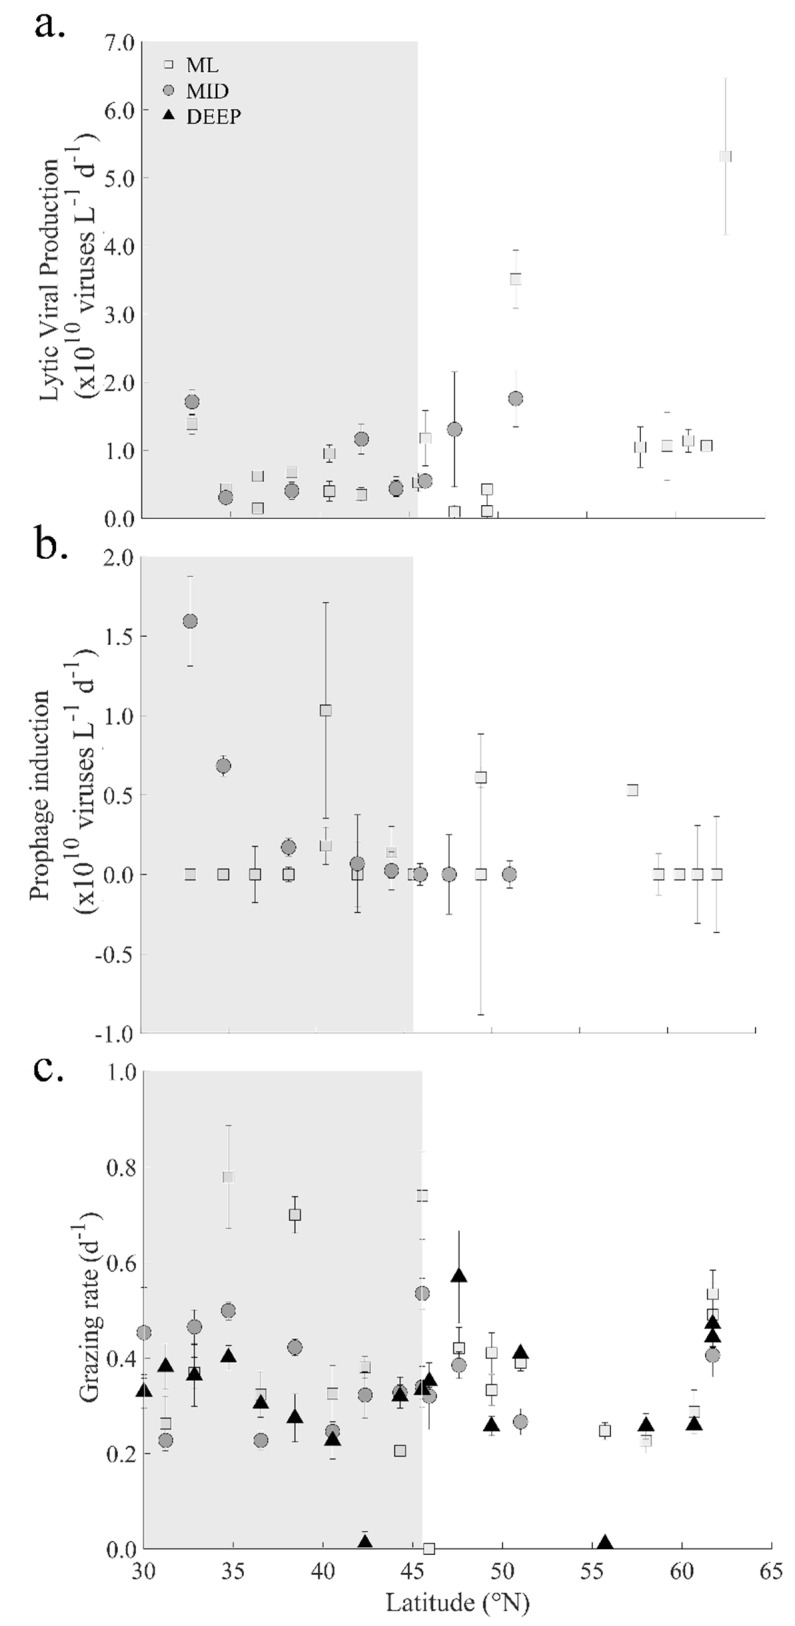
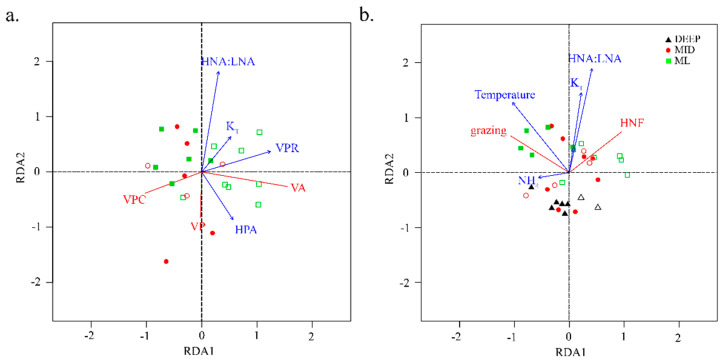
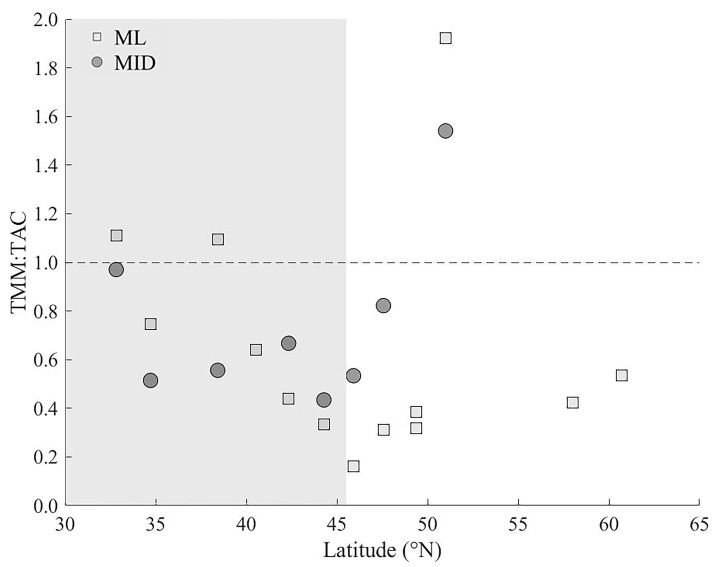
How microbial populations interact influences the availability and flux of organic carbon in the ocean. Understanding how these interactions vary over broad spatial scales is therefore a fundamental aim of microbial oceanography. In this study, we assessed variations in the abundances, production, virus and grazing induced mortality of heterotrophic prokaryotes during summer along a meridional gradient in stratification in the North Atlantic Ocean. Heterotrophic prokaryote abundance and activity varied with phytoplankton biomass, while the relative distribution of prokaryotic subpopulations (ratio of high nucleic acid fluorescent (HNA) and low nucleic acid fluorescent (LNA) cells) was significantly correlated to phytoplankton mortality mode (i.e., viral lysis to grazing rate ratio). Virus-mediate morality was the primary loss process regulating the heterotrophic prokaryotic communities (average 55% of the total mortality), which may be attributed to the strong top-down regulation of the bacterivorous protozoans. Host availability, encounter rate, and HNA:LNA were important factors regulating viral dynamics. Conversely, the abundance and activity of bacterivorous protozoans were largely regulated by temperature and turbulence. The ratio of total microbial mediated mortality to total available prokaryote carbon reveals that over the latitudinal gradient the heterotrophic prokaryote community gradually moved from a near steady state system regulated by high turnover in subtropical region to net heterotrophic production in the temperate region.

Keywords: HNA; LNA; bacterial production; carbon cycling; lysogeny; lytic infection; marine viruses; mortality; protozoan grazing.


Conflict of interest statement

The authors declare no conflict of interest. The funders had no role in the design of the study; in the collection, analyses, or interpretation of data; in the writing of the manuscript, or in the decision to publish the results.

Figures

Figure 1
Figure 1
North-south gradient across the Northeast Atlantic Ocean. Bathymetric map depicting stations sampled during the summer STRATIPHYT. Mortality assays to determine viral lysis and microzooplankton grazing rates were performed at stations indicated by black symbols. Figure was prepared using Ocean Data View version 5.2.
Figure 2
Figure 2
Biogeographical distributions of (a) Chl a, (b) phytoplankton carbon (PhytoC), (c) heterotrophic prokaryote abundance (HPA), (d) high nucleic acid fluorescent (HNA):low nucleic acid fluorescent (LNA), (e) virus abundance (VA), and (f) heterotrophic nanoflagellate abundance (HNF) across the Northeast Atlantic Ocean obtained during the STRATIPHYT cruise. Black dots indicate sampling points. Graphs were prepared with Ocean Data View version 5.2.
Figure 3
Figure 3
Heterotrophic prokaryote production (HPP) measured in the Northeast Atlantic during the summer STRATIPHYT cruise. Rates were obtained from 3 separate depths: the mixed layer (ML; 15 m), below the mixed layer (MID; 25–85 m), which included the deep-chlorophyll maximum where present (DCM; 47–85 m; defined by the presence of a subsurface peak in the vertical profile of Chl a autofluorescence), and deep (DEEP; 100–225 m). Error bars represent standard error (n = 3). The gray shaded area represented the latitudinal range of stations with a DCM present.
Figure 4
Figure 4
Average rates of viral and grazing activity within prokaryotes communities in the Northeast Atlantic during the summer STRATIPHYT cruise. Daily rates of (a) lytic viral production (VP), (b) Mitomycin C prophage induction (VPC), and (c) microzooplankton grazing. Rates were obtained from three separate depths: the mixed layer (ML; 15 m), below the mixed layer (MID; 25–85 m), which included the deep-chlorophyll maximum where present (DCM; 47–85 m; defined by the presence of a subsurface peak in the vertical profile of Chl a autofluorescence), and deep (DEEP; 100–225 m). Error bars represent standard error (n = 3). Gray shaded area represented the latitudinal range of stations with a DCM present.
Figure 5
Figure 5
Redundancy analysis (RDA) correlation triplots of factors important in structuring the abundance and activity of mortality agents of (a) viruses and (b) heterotrophic nanoflagellates during STRATIPHYT. Response variables are shown in red and explanatory variables in blue. Symbols represent individual sampling points (a:n = 22 and b:n = 32) and illustrate from what depth layer samples originated; shape and color coded according to the depth layer and filled according to the presence or absence of a deep-chlorophyll maximum (closed = present and open = absent). The total variance explained by the RDA models in panel a and b were 58.8% and 38.9%, respectively. Abbreviations represent viral abundance (VA), lytic viral production (VP), Mitomycin C prophage induction (VPC), virus-to-prokaryote ratio (VPR), heterotrophic prokaryote abundance (HPA), nitrate (NO3), HNA to LNA ratio (HNA:LNA), ammonium (NH4), vertical mixing coefficient (KT), and heterotrophic nanoflagellate abundance (HNF).
Figure 6
Figure 6
The ratio of total microbial mediated mortality (TMM; VMM + PMM) to total available prokaryotic carbon (TAC; standing stock biomass + production) as a function of latitude for the ML and MID depth samples. The gray shaded area represented the latitudinal range of stations with a DCM present.

Similar articles

Cited by

References

    1. Zubkov M.V., Fuchs B.M., Burkill P.H., Amann R. Comparison of Cellular and Biomass Specific Activities of Dominant Bacterioplankton Groups in Stratified Waters of the Celtic Sea. Appl. Environ. Microbiol. 2001;67:5210–5218. doi: 10.1128/AEM.67.11.5210-5218.2001. - DOI - PMC - PubMed
    1. Gasol J.M., Del Giorgio P.A. Using flow cytometry for counting natural planktonic bacteria and understanding the structure of planktonic bacterial communities. Sci. Mar. 2000;64:197–224. doi: 10.3989/scimar.2000.64n2197. - DOI
    1. Button D.K., Robertson B.R. Determination of DNA Content of Aquatic Bacteria by Flow Cytometry. Appl. Environ. Microbiol. 2001;67:1636–1645. doi: 10.1128/AEM.67.4.1636-1645.2001. - DOI - PMC - PubMed
    1. Bouvier T., Del Giorgio P.A., Gasol J.M. A comparative study of the cytometric characteristics of High and Low nucleic-acid bacterioplankton cells from different aquatic ecosystems. Environ. Microbiol. 2007;9:2050–2066. doi: 10.1111/j.1462-2920.2007.01321.x. - DOI - PubMed
    1. Proctor C.R., Besmer M.D., Langenegger T., Beck K., Walser J.-C., Ackermann M., Bürgmann H., Hammes F. Phylogenetic clustering of small low nucleic acid-content bacteria across diverse freshwater ecosystems. ISME J. 2018;12:1344–1359. doi: 10.1038/s41396-018-0070-8. - DOI - PMC - PubMed

Publication types

LinkOut - more resources