Multicenter Study
. 2021 Jan 26;96(4):e619-e631.
doi: 10.1212/WNL.0000000000011214. Epub 2020 Nov 16.

Defining the Lowest Threshold for Amyloid-PET to Predict Future Cognitive Decline and Amyloid Accumulation

Affiliations
Multicenter Study

Defining the Lowest Threshold for Amyloid-PET to Predict Future Cognitive Decline and Amyloid Accumulation

Michelle E Farrell et al. Neurology. .

Abstract

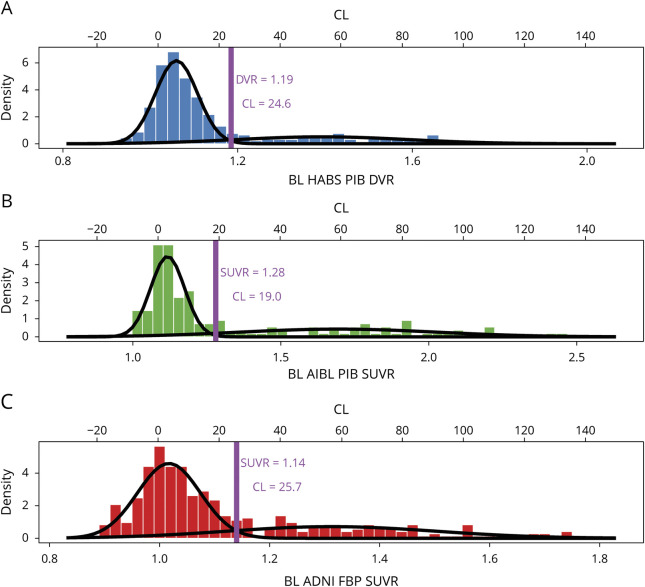
Introduction: As clinical trials move toward earlier intervention, we sought to redefine the β-amyloid (Aβ)-PET threshold based on the lowest point in a baseline distribution that robustly predicts future Aβ accumulation and cognitive decline in 3 independent samples of clinically normal individuals.

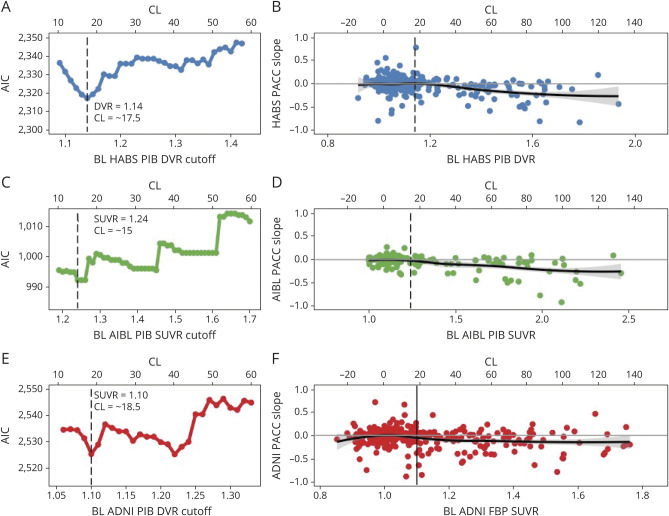
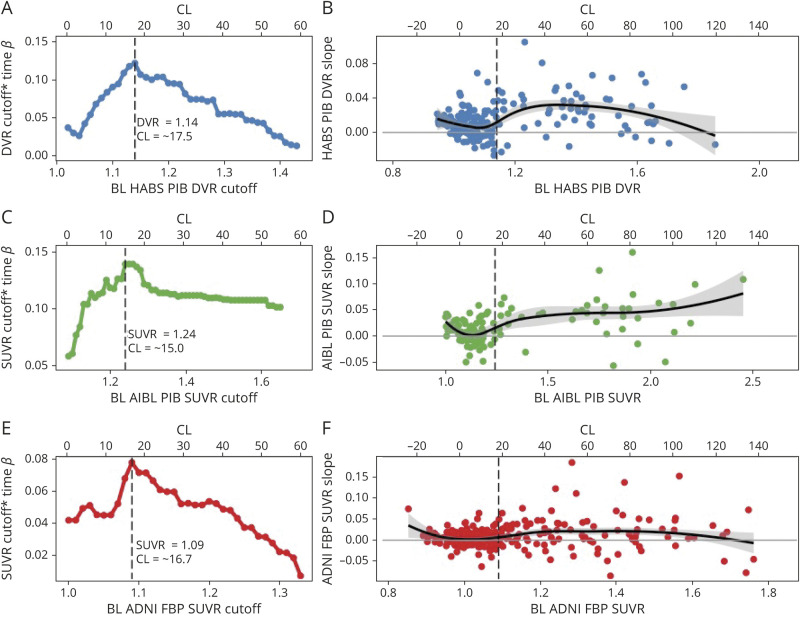
Methods: Sequential Aβ cutoffs were tested to identify the lowest cutoff associated with future change in cognition (Preclinical Alzheimer Cognitive Composite [PACC]) and Aβ-PET in clinically normal participants from the Harvard Aging Brain Study (n = 342), Australian Imaging, Biomarker and Lifestyle study of aging (n = 157), and Alzheimer's Disease Neuroimaging Initiative (n = 356).

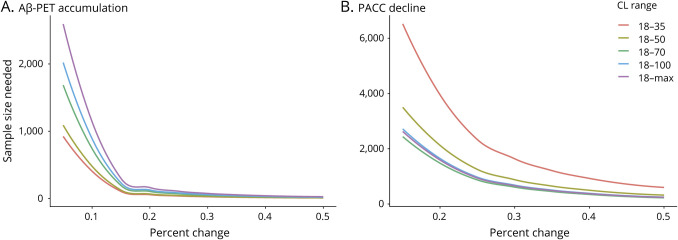
Results: Within samples, cutoffs derived from future Aβ-PET accumulation and PACC decline converged on the same inflection point, beyond which trajectories diverged from normal. Across samples, optimal cutoffs fell within a short range (Centiloid 15-18.5).

Discussion: These optimized thresholds can help to inform future research and clinical trials targeting early Aβ. Threshold convergence raises the possibility of contemporaneous early changes in Aβ and cognition.

Classification of evidence: This study provides Class II evidence that among clinically normal individuals a specific Aβ-PET threshold is predictive of cognitive decline.


Figures

Figure 1
Figure 1. Bimodal Gaussian Distribution of PET Signal in HABS, AIBL, and ADNI
A–C) Histograms of the baseline (BL) PET data in each sample are plotted and fitted to a bimodal gaussian distribution using gaussian mixture model (GMM). Data are plotted on the tracer for each sample and processing-specific scale on the bottom x-axis and transformed to the Centiloid (CL) scale on the top x-axis. The GMM threshold (purple line) was identified within each sample as the point at which an individual had an equal probability of being in the lower β-amyloid (Aβ)− and higher Aβ+ gaussian. ADNI = Alzheimer's Disease Neuroimaging Initiative; AIBL = Australian Imaging, Biomarker and Lifestyle; DVR = distribution volume ratio; HABS = Harvard Aging Brain Study; PiB = Pittsburgh compound B; SUVR = standardized uptake value ratio.
Figure 2
Figure 2. Optimal Cutoffs Within HABS, AIBL, and ADNI Based on Longitudinal Cognitive Outcomes
For each sample, the Akaike information criterion (AIC) demonstrating the model fit for a range of possible cutoffs are shown (A, C, E). In Harvard Aging Brain Study (HABS) (A), an optimal cutoff of Pittsburgh compound B (PiB) distribution volume ratio (DVR) 1.14/Centiloid (CL) 17.5 is derived from a clear lowest AIC (least information loss). In Australian Imaging, Biomarker and Lifestyle (AIBL), similarly low AIC was achieved twice, and the lower cutoff at a PiB standardized uptake value ratio (SUVR) 1.24/CL 15.0 was selected. Likewise, in Alzheimer's Disease Neuroimaging Initiative (ADNI) an optimal cutoff of 18F-florbetapir (FBP) SUVR 1.1/CL 18.5 was selected as the lower cutoff from 2 similarly well-fitting models with nearly equivalent AIC. Notably, across samples, the optimal cutoffs based on cognitive decline fit in a tight CL range of 15.0 to 18.5. (B, D, F) Preclinical Alzheimer Cognitive Composite 5 version (PACC5) score slope over time is plotted as a function of baseline (BL) PET within each sample using a loess curve to demonstrate the shift in trajectories of change with increasing baseline β-amyloid (Aβ)-PET tracer retention. PACC5 score slope for each participant was extracted from the slope of the linear regression of PACC5 score over time. Data are unadjusted for covariates. In each sample, the magnitude of tracer retention is unrelated to PACC score slope until an inflection point is reached, beyond which greater levels of Aβ-tracer retention are associated with increasing rates of cognitive decline on the PACC5. The inflection point corresponds to the optimal cutoff derived from the iterative models of PACC5 score over time.
Figure 3
Figure 3. Optimal Cutoffs Within HABS, AIBL, and ADNI Based on Longitudinal Aβ-PET Accumulation
For each sample, the standardized β for the cutoff × time interaction term from iterative models across a range of possible cutoffs is shown (A, C, E). The optimal cutoff based on Aβ-PET accumulation was set at the cutoff that gave the highest standardized β in each sample. In Harvard Aging Brain Study (HABS) and Australian Imaging, Biomarker and Lifestyle (AIBL), the β-amyloid (Aβ) accumulation–derived optimal cutoff is identical to the cognitively derived optimal cutoff: (A) HABS: Pittsburgh compound B (PiB) distribution volume ratio (DVR) 1.14/Centiloid (CL) 17.5; (C) AIBL: PiB standardized uptake value ratio (SUVR) 1.24/CL 15.0. In Alzheimer's Disease Neuroimaging Initiative (ADNI), the Aβ accumulation–derived optimal cutoff (18F-florbetapir [FBP] SUVR 1.09, CL 16.7) was very slightly lower than the cognitively derived cutoff (FBP SUVR 1.1, CL 18.5). (B, D, F) DVR/SUVR slope over time is plotted as a function of baseline DVR/SUVR within each sample using a loess curve to demonstrate the shift in trajectories of change as function of baseline Aβ-PiB tracer retention. DVR/SUVR slope for each participant was extracted from the slope of the linear regression of DVR/SUVR over time. Data are unadjusted for covariates. In each sample, the slopes below the optimal cutoff consist of a roughly equal proportion of both negative and positive slopes, presumed to reflect random fluctuations in signal noise. Increasing baseline DVR/SUVR is associated with a small negative trend in this range suggestive of regression to the mean. The optimal cutoff appears to mark a shift toward more positive slopes presumed to reflect Aβ accumulation.
Figure 4
Figure 4. Sample Sizes Needed to Detect Aβ-PET Accumulation and PACC Score Decline
(A and B) Sample size needed per arm to detect varying levels of change over 5 years with 80% power in (A) β-amyloid (Aβ)-PET accumulation and (B) Preclinical Alzheimer Cognitive Composite (PACC) score decline for groups with different ranges of Aβ burden measured in Centiloid (CL) at baseline. Power analyses were estimated from a combined Harvard Aging Brain Study (HABS), Alzheimer's Disease Neuroimaging Initiative (ADNI), and Australian Imaging, Biomarker and Lifestyle (AIBL) dataset measured in CL. As shown in the red line, an early intervention trial targeting individuals in the low 18 to 35 CL range would require the smallest sample to detect Aβ-PET accumulation because individuals in this range typically exhibit the highest rates of accumulation. However, detecting PACC decline in the low 18 to 35 CL range would necessitate very large sample sizes. Targeting individuals in the 18 to 50 CL range would minimize the sample size needed to detect PACC score decline while maximizing power to detect reduced Aβ-PET accumulation.

References

    1. Sperling R, Mormino E, Johnson K. The evolution of preclinical Alzheimer's disease: implications for prevention trials. Neuron 2014;84:608–622. - PMC - PubMed
    1. Sperling RA, Rentz DM, Johnson KA, et al. . The A4 study: stopping AD before symptoms begin? Sci Transl Med 2014;6:228fs213. - PMC - PubMed
    1. Sperling RA, Aisen PS, Beckett LA, et al. . Toward defining the preclinical stages of Alzheimer's disease: recommendations from the National Institute on Aging-Alzheimer's Association workgroups on diagnostic guidelines for Alzheimer's disease. Alzheimers Dement 2011;7:280–292. - PMC - PubMed
    1. Jack CR Jr, Bennett DA, Blennow K, et al. . NIA-AA Research Framework: toward a biological definition of Alzheimer's disease. Alzheimers Dement 2018;14:535–562. - PMC - PubMed
    1. Klunk WE, Engler H, Nordberg A, et al. . Imaging brain amyloid in Alzheimer's disease with Pittsburgh compound-B. Ann Neurol 2004;55:306–319. - PubMed

Publication types

Substances