. 2021 Jan 26;96(4):e538-e552.
doi: 10.1212/WNL.0000000000011210. Epub 2020 Nov 16.

Cerebrovascular Disease Progression in Patients With ACTA2 Arg179 Pathogenic Variants

Affiliations

Cerebrovascular Disease Progression in Patients With ACTA2 Arg179 Pathogenic Variants

Arne Lauer et al. Neurology. .

Abstract

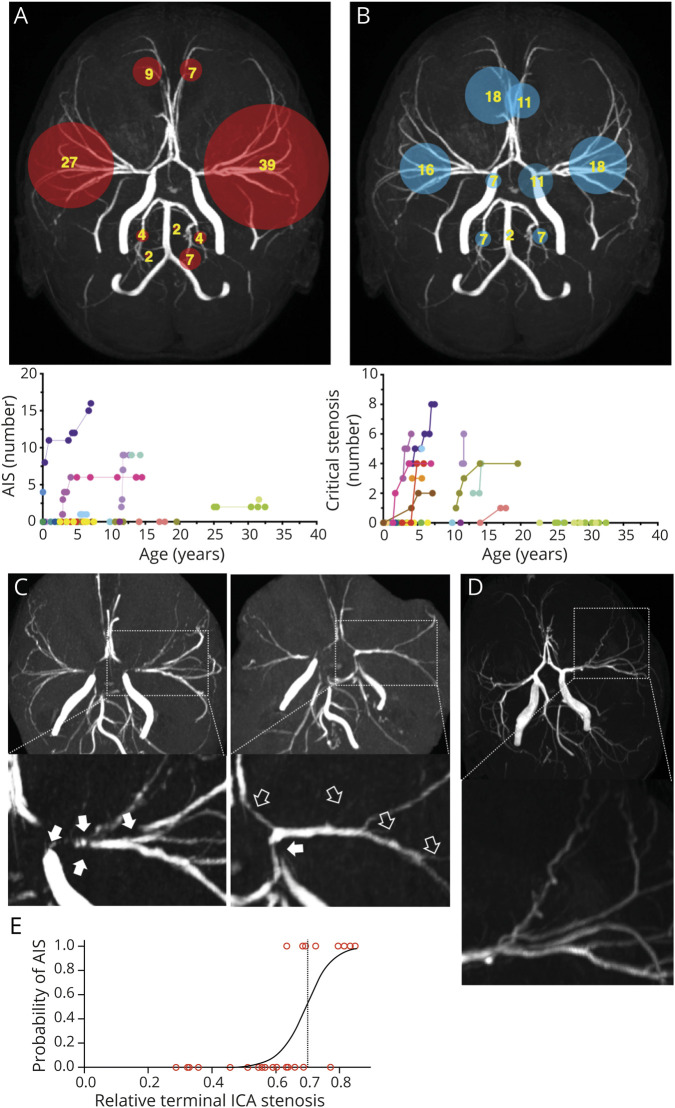
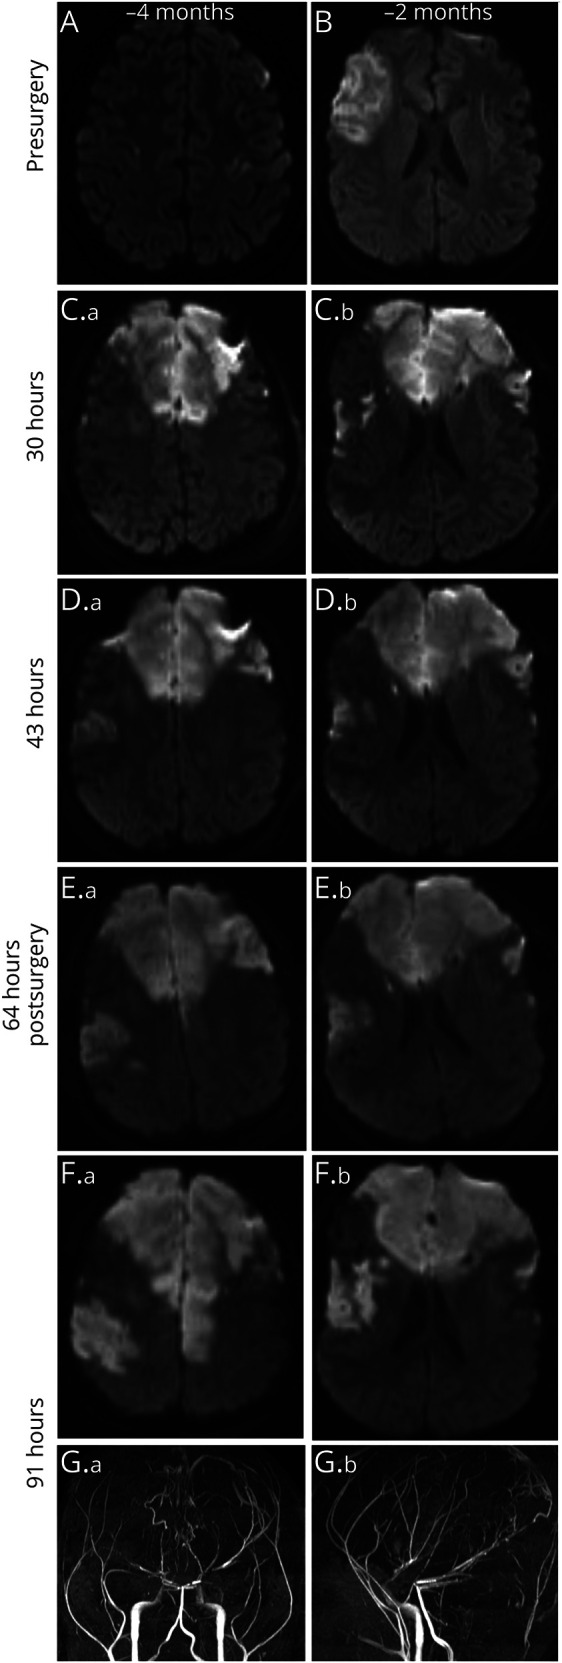
Objective: To establish progression of imaging biomarkers of stroke, arterial steno-occlusive disease, and white matter injury in patients with smooth muscle dysfunction syndrome caused by mutations in the ACTA2 gene, we analyzed 113 cerebral MRI scans from a retrospective cohort of 27 patients with ACTA2 Arg179 pathogenic variants.

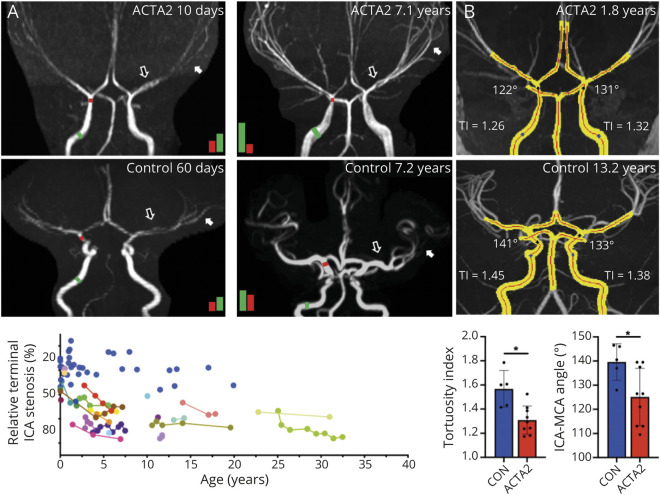
Methods: Systematic quantifications of arterial ischemic strokes and white matter lesions were performed on baseline and follow-up scans using planimetric methods. Critical stenosis and arterial vessel diameters were quantified applying manual and semiautomated methods to cerebral magnetic resonance angiograms. We then assessed correlations between arterial abnormalities and parenchymal injury.

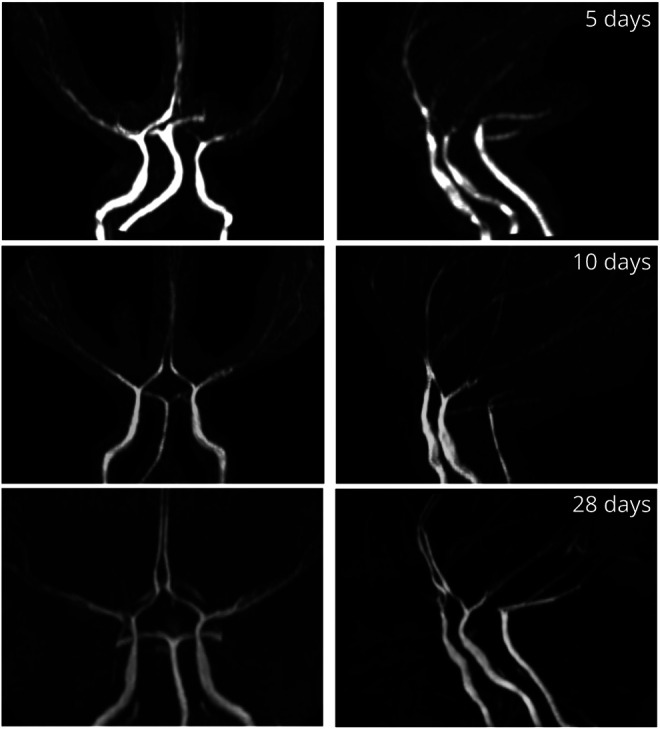
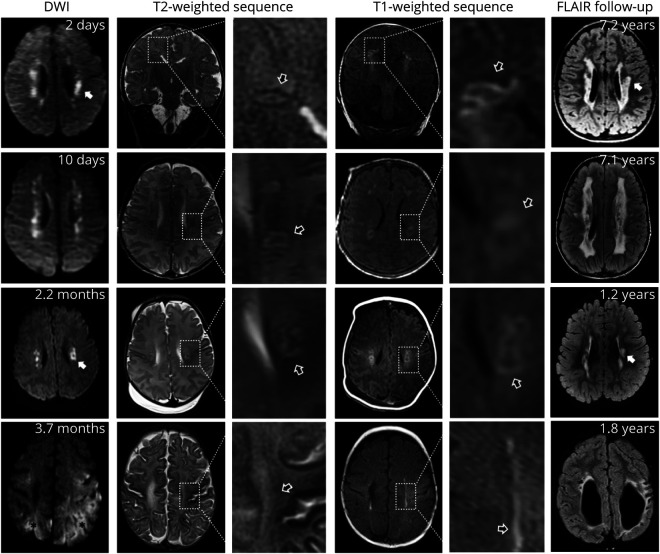
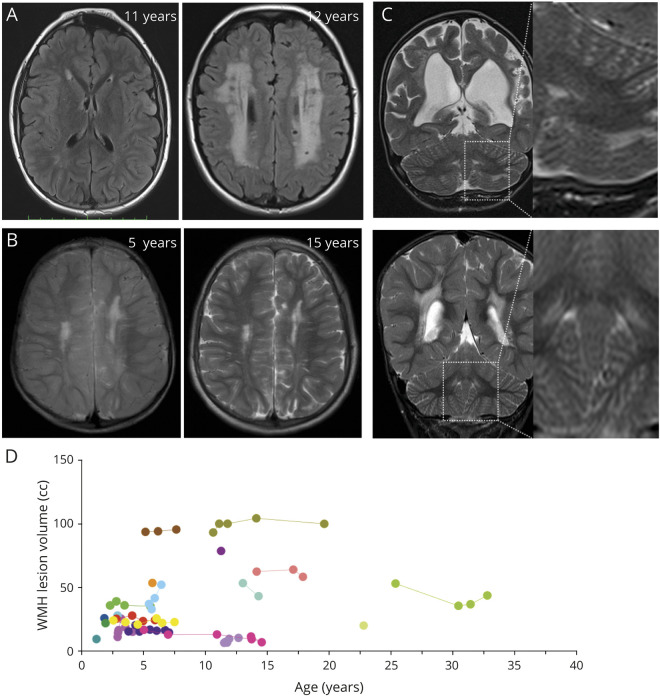
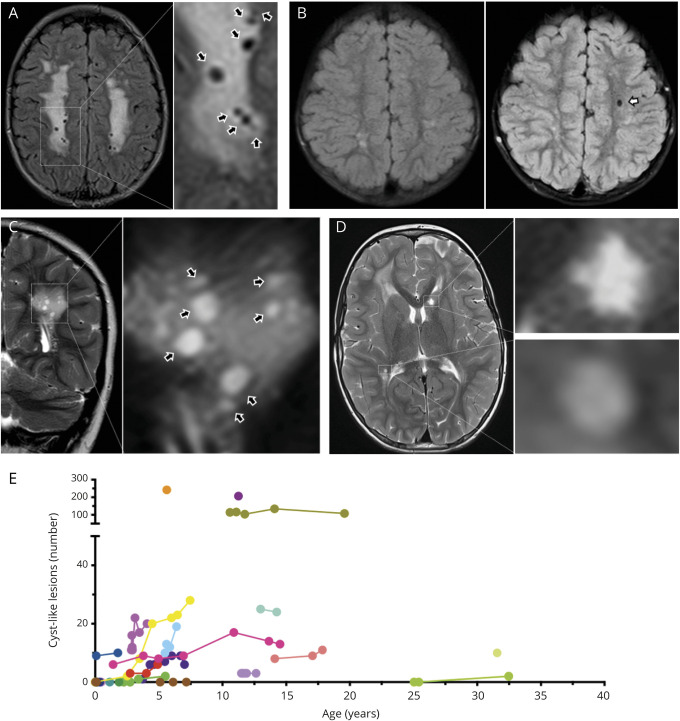
Results: We found characteristic patterns of acute white matter ischemic injury and progressive internal carotid artery stenosis during infancy. Longitudinal analysis of patients older than 1.2 years showed stable white matter hyperintensities but increased number of cystic-like lesions over time. Progressive narrowing of the terminal internal carotid artery occurred in 80% of patients and correlated with the number of critical stenoses in cerebral arteries and arterial ischemic infarctions. Arterial ischemic strokes occurred in same territories affected by critical stenosis.

Conclusions: We found characteristic, early, and progressive cerebrovascular abnormalities in patients with ACTA2 Arg179 pathogenic variants. Our longitudinal data suggest that while steno-occlusive disease progresses over time and is associated with arterial ischemic infarctions and cystic-like white matter lesions, white matter hyperintensities can remain stable over long periods. The evaluated metrics will enable diagnosis in early infancy and be used to monitor disease progression, guide timing of stroke preventive interventions, and assess response to current and future therapies.


Figures

Figure 1
Figure 1. Infantile Vascular Abnormalities in Patients With ACTA2 Arg179
Maximum intensity projections of time of flight angiographies of 3 patients with ACTA2 Arg179 pathogenic variant evaluated within the first month of life showing typical vessel abnormalities with intermittent changes in vessel caliber, short M1 segments of the middle cerebral arteries, and abnormal straight course of the basal cerebral arteries.
Figure 2
Figure 2. Infantile Parenchymal Abnormalities in Patients With ACTA2 Arg179
Diffusion-weighted imaging (DWI) and T2- and T1-weighted (T2W, T1W) sequences of 4 patients with ACTA2 Arg179 pathogenic variants aged 2, 10, 66, and 110 days. Right: Follow-up fluid-attenuated inversion recovery (FLAIR) sequences of the same patients of each row at 7.2, 7.1, 1.2, and 1.8 years of age. All patients show acute DWI lesions consistent with internal border zone infarctions. White matter corresponding to acute DWI lesions shows T2W-hypointense and T1W-hyperintense, mostly ring-like signal abnormalities (black arrows). Note highlighted similar shapes of the edges of acute DWI lesions and of long-term follow-up white matter hyperintensities on FLAIR sequences (white arrows). The patient in row 4 had additional hemodynamic ischemic strokes (black asterisks) due to complications during heart surgery in addition to deep white matter lesions.
Figure 3
Figure 3. White Matter Hyperintensity Lesions in Patients With ACTA2 Arg179
A) Representative fluid-attenuated inversion recovery (FLAIR) images to illustrate the range of white matter hyperintensities (WMH) from limited to extensive found in ACTA2 Arg179 patients. Both patients are between 11 and 12 years of age. (B) Representative T2-weighted images of a 5-year-old boy and corresponding follow-up visit 10 years later showing stable extent of WMH burden. (C) Representative T2-weighted sequence to illustrate periventricular and subcortical cerebellar WMH infrequently found in ACTA2 Arg179 patients. (D) Individual longitudinal data on WMH.
Figure 4
Figure 4. Cyst-Like White Matter Lesions in Patients With ACTA2 Arg179
Upper row shows fluid-attenuated inversion recovery (FLAIR)-weighted, lower row shows T2-weighted images to illustrate CSF-like signal intensity of cyst-like white matter lesions (CL). (A) Magnification of multiple CLs (black arrows). (B) Baseline (left) and 3-year follow-up (right) of the same ACTA2 Arg179 patient to illustrate emergence of an additional CL in the left frontal white matter (white arrow). (C) Same patient as in A. Coronal imaging illustrates round to ovoid shape of CL (black arrows) in a different plane. (D) Magnifications to illustrate differences of CL and lacunes. The lesion in the right peritrigonal white matter was classified as a CL based on a smooth edge and round shape. In contrast, the star-shaped, irregularly edged lesion in the left caudate head was considered a lacune of presumed vascular origin. (E) Individual longitudinal data on numbers of CL.
Figure 5
Figure 5. Vascular Lesions in Patients With ACTA2 Arg179
A) Frequencies of involved vascular territories of ischemic strokes related to large artery occlusion (AIS) and longitudinal data on numbers of AIS. (B) Frequencies of critical stenosis (CS) within the vascular territories and longitudinal data on number of CS. Numbers in circles indicate percentage of total lesions detected in the cohort. Circle size is proportional to lesion frequency. (C) Representative magnifications of maximum intensity projections of time of flight angiographies (TOF MIP) of the same patient illustrating the emergence of new CS defined as short segmented or wide-stretching signal loss following the vessels course from baseline (white arrows) to follow-up (black arrows). (D) Magnifications of TOF MIP illustrating corkscrew appearance of cerebral vessels found frequently in patients with ACTA2 Arg179 pathogenic variants. (E) Logistic regression curve representing an estimate of the probability for AIS depending on the relative terminal internal carotid artery (ICA) stenosis.
Figure 6
Figure 6. Infarct Progression in a Patient With ACTA2 Arg179
Diffusion-weighted imaging of an 11-year-old girl with ACTA2 p.Arg179His mutation before (A, B) and after (C–F: 30, 43, 64, and 91 hours postsurgery) and time of flight angiographies after (G: 91 hours postsurgery) revascularization surgery with bilateral superficial temporal artery to pial synangiosis illustrating the presence of ischemic strokes and rapid progression of infarcts over time postsurgery.
Figure 7
Figure 7. Cerebral Artery Vasculopathy Is Progressive in Patients With ACTA2 Arg179
A) Segmented maximum intensity projections (MIPs) of an ACTA2 p.Arg179His patient and a patient with pediatric stroke without vasculopathy (control). The red line is the automatically generated centerline. Tortuosity index (TI) is labeled of each internal carotid artery (ICA), and the angle of incidence between the ICA and middle cerebral artery (MCA). Below are controls vs ACTA2 Arg179 patients for mean TI and mean ICA–MCA angles. *p < 0.05. (B) Baseline at 10 days (left) and follow-up at 7.1 years (right) of a patient with ACTA2 p.Arg179Cys pathogenic variant compared to a 60-day-old (left) and a 7.2-year-old (right) control patient. Black and white arrows indicate abnormal straight appearance of basal cerebral arteries that persists in aging in ACTA2 Arg179 patients. Colored bars are proportional to the quantified diameter of the terminal (red bar) to the petrous ICA (green bar) and illustrate age-related progressive stenosis determined by their ratio. Diagram illustrates individual longitudinal data on relative terminal to petrous ICA stenosis. Blue dots represent control patients.

References

    1. Milewicz DM, Kwartler CS, Papke CL, Regalado ES, Cao J, Reid AJ. Genetic variants promoting smooth muscle cell proliferation can result in diffuse and diverse vascular diseases: evidence for a hyperplastic vasculomyopathy. Genet Med 2010;12:196–203. - PubMed
    1. Meuwissen MEC, Lequin MH, Bindels-de Heus K, et al. . ACTA2 mutation with childhood cardiovascular, autonomic and brain anomalies and severe outcome. Am J Med Genet A 2013;161A:1376–1380. - PubMed
    1. Regalado ES, Mellor-Crummey L, Backer J, et al. . Clinical history and management recommendations of the smooth muscle dysfunction syndrome due to ACTA2 arginine 179 alterations. Genet Med 2018;20:1206–1215. - PMC - PubMed
    1. Munot P, Saunders DE, Milewicz DM, et al. . A novel distinctive cerebrovascular phenotype is associated with heterozygous Arg179 ACTA2 mutations. Brain 2012;135:2506–2514. - PMC - PubMed
    1. Milewicz DM, Østergaard JR, Ala-Kokko LM, et al. . De novo ACTA2 mutation causes a novel syndrome of multisystemic smooth muscle dysfunction. Am J Med Genet A 2010;152A:2437–2443. - PMC - PubMed

Publication types