

Estimating and forecasting spatial population dynamics of apex predators using transnational genetic monitoring
- PMID: 33199605
- PMCID: PMC7720137
- DOI: 10.1073/pnas.2011383117
Estimating and forecasting spatial population dynamics of apex predators using transnational genetic monitoring
Abstract
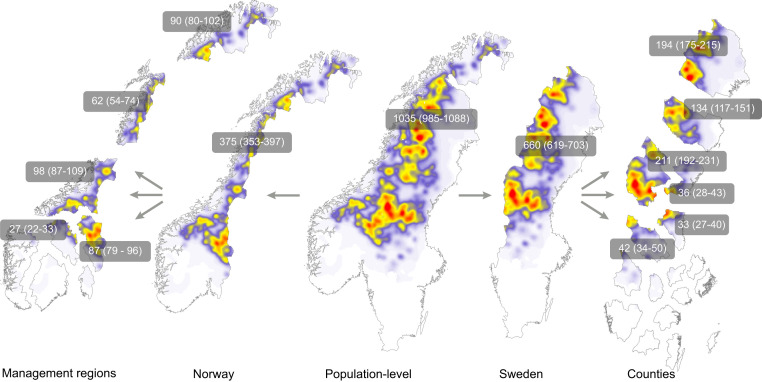
The ongoing recovery of terrestrial large carnivores in North America and Europe is accompanied by intense controversy. On the one hand, reestablishment of large carnivores entails a recovery of their most important ecological role, predation. On the other hand, societies are struggling to relearn how to live with apex predators that kill livestock, compete for game species, and occasionally injure or kill people. Those responsible for managing these species and mitigating conflict often lack fundamental information due to a long-standing challenge in ecology: How do we draw robust population-level inferences for elusive animals spread over immense areas? Here we showcase the application of an effective tool for spatially explicit tracking and forecasting of wildlife population dynamics at scales that are relevant to management and conservation. We analyzed the world's largest dataset on carnivores comprising more than 35,000 noninvasively obtained DNA samples from over 6,000 individual brown bears (Ursus arctos), gray wolves (Canis lupus), and wolverines (Gulo gulo). Our analyses took into account that not all individuals are detected and, even if detected, their fates are not always known. We show unequivocal quantitative evidence of large carnivore recovery in northern Europe, juxtaposed with the finding that humans are the single-most important factor driving the dynamics of these apex predators. We present maps and forecasts of the spatiotemporal dynamics of large carnivore populations, transcending national boundaries and management regimes.
Keywords: density surface; imperfect detection; noninvasive monitoring of large carnivores; spatial capture–recapture; vital rates.
Copyright © 2020 the Author(s). Published by PNAS.
Conflict of interest statement
The authors declare no competing interest.
Figures


References
-
- Ordiz A., Bischof R., Swenson J. E., Saving large carnivores, but losing the apex predator? Biol. Conserv. 168, 128–133 (2013).
-
- Ripple W. J., et al. , Status and ecological effects of the world’s largest carnivores. Science 343, 1241484 (2014). - PubMed
-
- Bruskotter J. T., Shelby L. B., Human dimensions of large carnivore conservation and management: Introduction to the special issue. Hum. Dimens. Wildl. 15, 311–314 (2010).
-
- Chapron G., et al. , Recovery of large carnivores in Europe’s modern human-dominated landscapes. Science 346, 1517–1519 (2014). - PubMed
Publication types
MeSH terms
LinkOut - more resources
Full Text Sources
Other Literature Sources
Miscellaneous
