. 2020 Dec 1;117(48):30599-30609.
doi: 10.1073/pnas.2006909117. Epub 2020 Nov 16.

Incompatibility between proliferation and plant invasion is mediated by a regulator of appressorium formation in the corn smut fungus Ustilago maydis

Affiliations

Incompatibility between proliferation and plant invasion is mediated by a regulator of appressorium formation in the corn smut fungus Ustilago maydis

Antonio de la Torre et al. Proc Natl Acad Sci U S A. .

Abstract

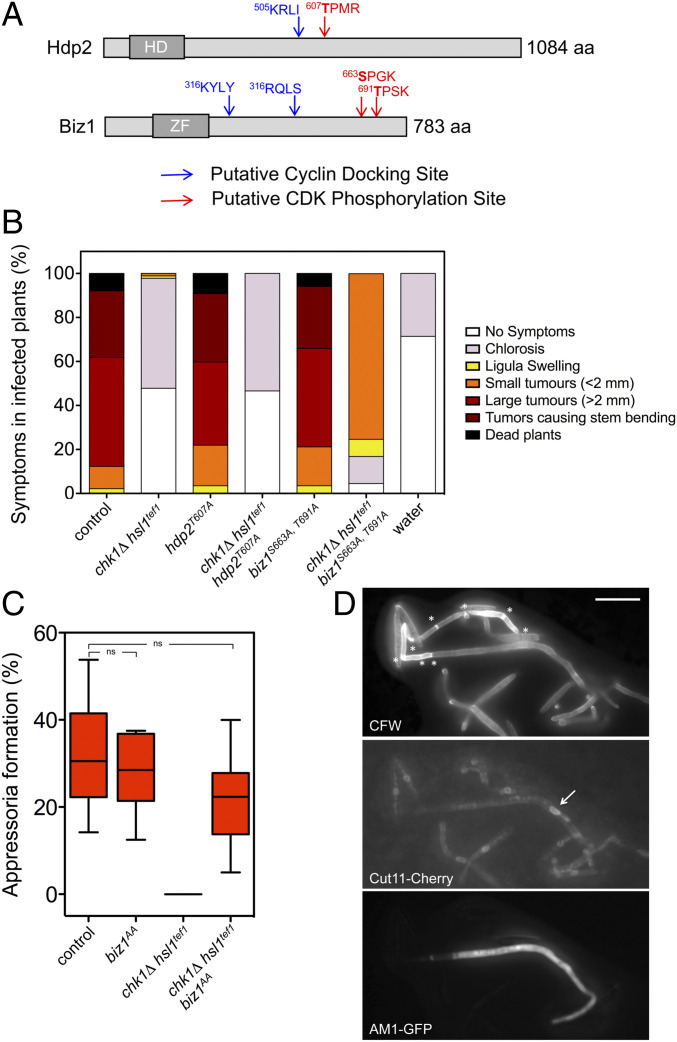
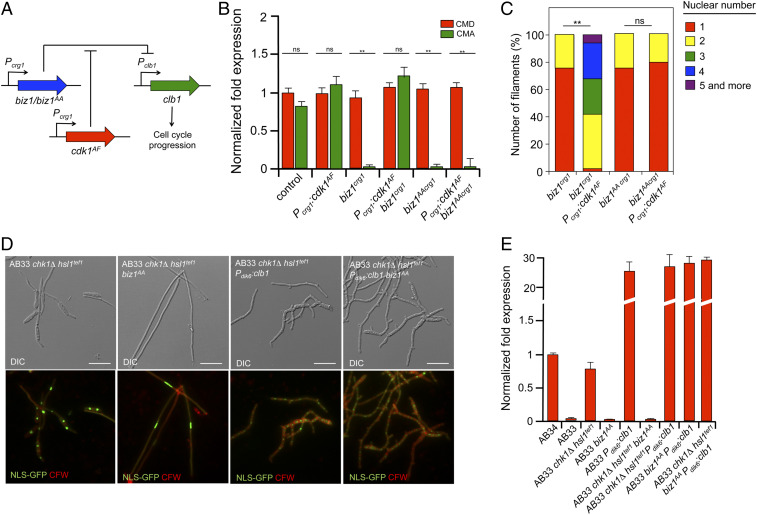
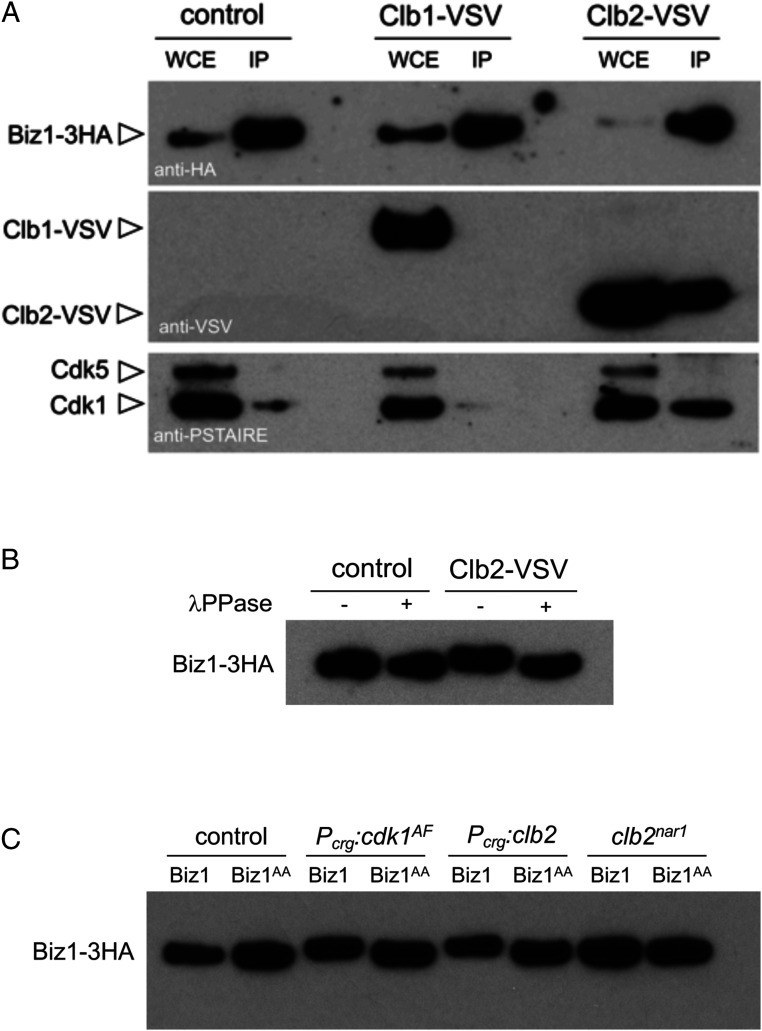
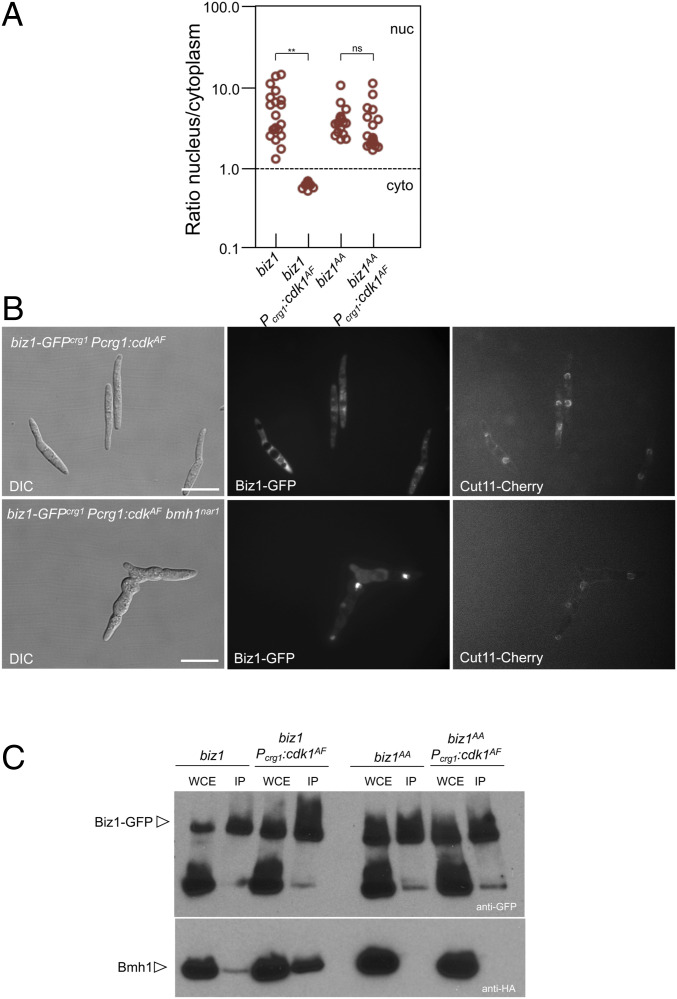
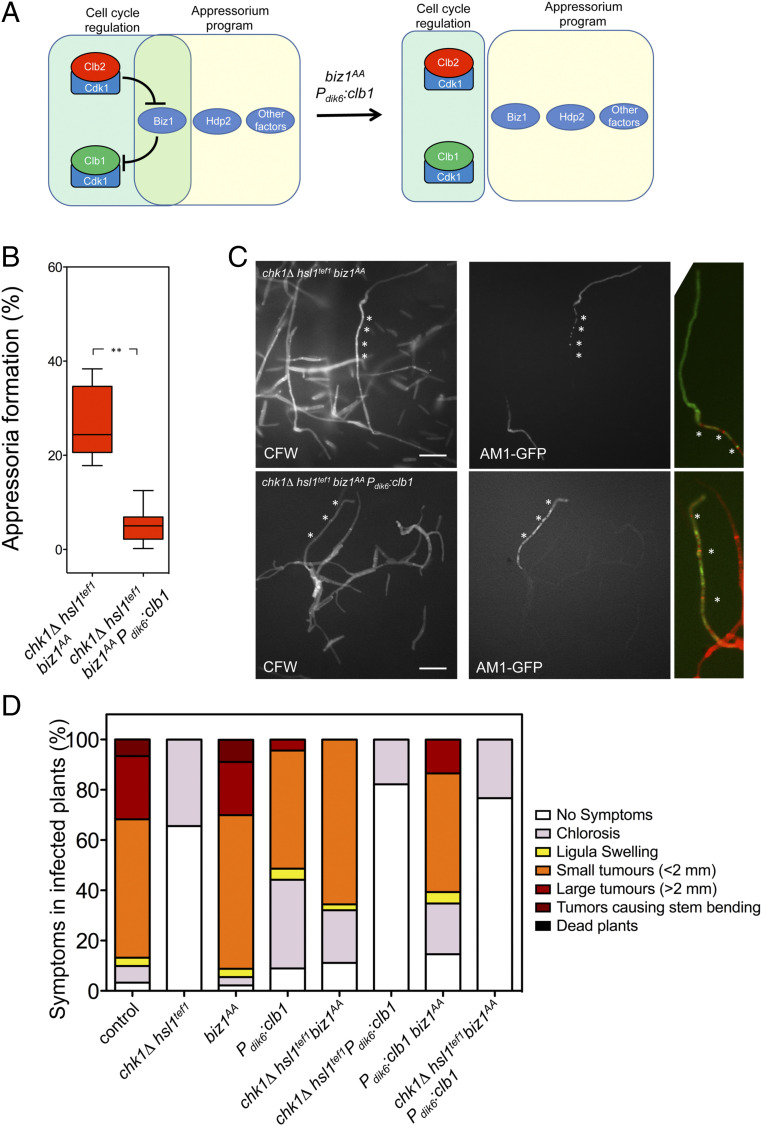
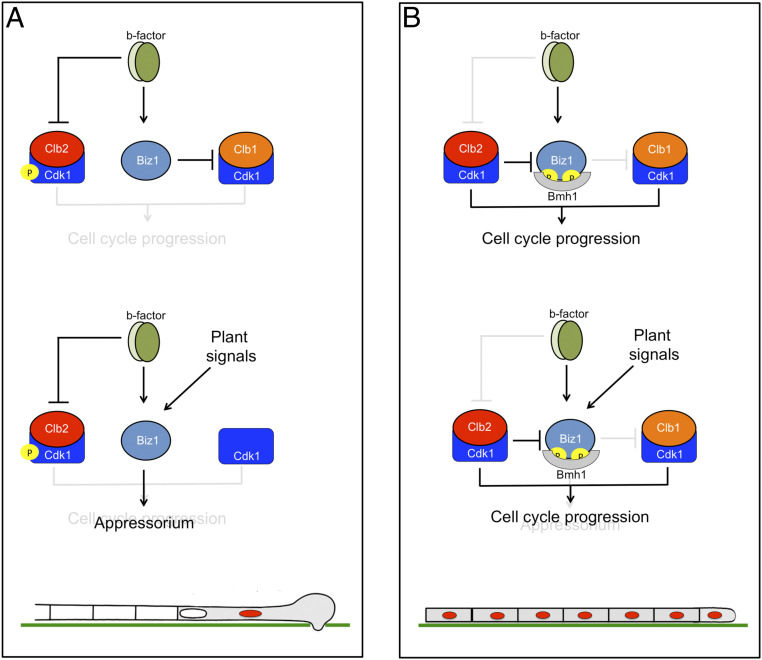
Plant pathogenic fungi often developed specialized infection structures to breach the outer surface of a host plant. These structures, called appressoria, lead the invasion of the plant by the fungal hyphae. Studies in different phytopathogenic fungi showed that appressorium formation seems to be subordinated to the cell cycle. This subordination ensures the loading in the invading hypha of the correct genetic information to proceed with plant infection. However, how the cell cycle transmits its condition to the genetic program controlling appressorium formation and promoting the plant's invasion is unknown. Our results have uncovered how this process occurs for the appressorium of Ustilago maydis, the agent responsible for corn smut disease. Here, we described that the complex Clb2-cyclin-dependent kinase (Cdk)1, one of the master regulators of G2/M cell cycle progression in U. maydis, interacts and controls the subcellular localization of Biz1, a transcriptional factor required for the activation of the appressorium formation. Besides, Biz1 can arrest the cell cycle by down-regulation of the gene encoding a second b-cyclin Clb1 also required for the G2/M transition. These results revealed a negative feedback loop between appressorium formation and cell cycle progression in U. maydis, which serves as a "toggle switch" to control the fungal decision between infecting the plant or proliferating out of the plant.

Keywords: appressorium; cell cycle regulation; corn smut; phytopathogenic fungi.


Conflict of interest statement

The authors declare no competing interest.

Figures

Fig. 1.
Fig. 1.
Biz1 is involved in the incompatibility between cell cycle and appressorium formation. (A) Scheme of the transcriptional regulators Hdp2 and Biz1 showing the putative CDK phosphorylation sites (red) as well as the putative cyclin docking sites (blue). The corresponding DNA-binding motives are also shown (HD, homeodomain; ZF, zinc finger). The putative CDK phosphorylation sites as well as the cyclin docking sites were predicted by the eukaryotic linear motif (ELM) algorithm (elm.eu.org/) using the default values. (B) Graph showing disease symptoms caused by crosses of wild type and the indicated mutant combinations. The symptoms were scored 14 d after infection. Three independent experiments were carried out, and the average values were expressed as percentages of the total number of infected plants (n: 30 plants in each experiment, raw data are provided in the SI Appendix). (C) Frequency of appressoria formation in vitro in strains carrying the appressorium-specific AM1-GFP reporter as well as the indicated mutations. Cells were sprayed on Parafilm M in the presence of 100 μM 16-hydroxyhexadecanoic acid. After 20 h, cells were stained with Calcofluor white (CFW) and analyzed for AM1 marker expression (AM1-GFP). The graph shows the result from three independent experiments, counting more than 50 filaments each (ns: not significative). Images of appressorium-forming filaments are provided in SI Appendix, Fig. S6. (D) Micrographs to show in vitro appressorium formation in the chk1Δ hsl1tef1 biz1AA mutant strain. Asterisks mark the presence of retraction septa. The arrow marks the nucleus from the appressorium, detected by the nuclear envelope membrane protein Cut11 fused to Cherry. (Scale bar, 20 μm.)
Fig. 2.
Fig. 2.
CDK-mediated phosphorylation of Biz1 inhibits its ability to down-regulated clb1 expression. (A) Scheme showing the experimental design to address in vivo whether the ability of Biz1 to repress the transcription of clb1 was sensitive to CDK activity. See the text for explanations. (B) Quantitative real-time-PCR of clb1 expression for the indicated strains. RNA was isolated after 6 h of induction of the crg1 promoter (arabinose complete medium [CMA]) or control conditions (glucose complete medium [CMD]). As an internal control, the expression of tub1 (encoding tubulin α) was used. Values are referred to the expression of clb1 in control strain (FB1) growing in CMD. Each column represents the mean value of three independent biological replicates (**P < 0.01, [ns] not significant). (C) Cultures of the indicated strains were incubated in CMA for 6 h and Biz1-induced filaments (cells larger than 30 μm, see SI Appendix, Fig. S9 for images of the cells) were counted and sorted in function of nuclear number. The graph shows the result from three independent experiments, counting more than 50 filaments each (**P < 0.01, ns). (D) Micrographs of the indicated AB33-derived strains grown in nitrate minimal medium to induce the b program for 8 h. All strains carried a transgene expressing a NLS-GFP fusion to detect nuclei. Cells were stained with CFW to detect the cell wall and septa. Filaments carrying a single nucleus were considered cell cycle arrested (see SI Appendix, Fig. S10 for quantification of arrested filaments). Note that filaments overexpressing clb1 showed winding morphology and a higher number of nuclei (most likely as a consequence of an accelerated cell cycle). (E) Quantitative real-time-PCR of clb1 expression for the indicated strains. RNA was isolated after 8 h of induction of the b factor in nitrate minimal medium. As an internal control, the expression of tub1 (encoding tubulin α) was used. Values are referred to the expression of clb1 in AB34 (a strain carrying noncompatible b subunits and, therefore, unable to activate the b program) growing in the same conditions. Each column represents the mean value of three independent biological replicates.
Fig. 3.
Fig. 3.
Biz1 interacts with Clb2-Cdk1. (A) Western blots to show interaction among Biz1, Clb1, and Cdk1. Soluble extracts from strains carrying Biz1-3HA and Clb1-VSV or Clb2-VSV under the control of a crg1 promoter were incubated with anti-HA antibodies coupled to magnetic beads to obtain immunoprecipitates. The immunoprecipitates were submitted to Western blot with anti-VSV (cyclins) and anti-HA (Biz1) antibodies in succession. The lower part of the membrane was excised and processed independently with anti-PSTAIRE to detect the Cdk1 protein. Cells were grown in inducing conditions for crg1 promoter (complete medium [CM] plus 1% arabinose, CMA) during 6 h. (B) Western blot to show the effect of treatment with λ protein phosphatase (λ PPase) of anti-HA immunoprecipitates from cultures expressing or not clb2-VSV. Immunoprecipitates were incubated at 30 °C for 20 min in the absence (−) or presence (+) of λ PPase. (C) Western blot (anti-HA) from immunoprecipitates obtained from extracts of cultures grown in inducing conditions (CMA, 6 h) for the cells carrying biz1-3HA or biz1AA-3HA alleles as well as the indicated constructions.
Fig. 4.
Fig. 4.
CDK-mediated phosphorylation retains Biz1 at the cytoplasm. (A) Graph showing the nuclear versus cytoplasmic distribution of the GFP signal of the indicated strains. Micrographs used for quantification are shown in SI Appendix, Fig. S11. Cultures were incubated for 6 h in inducing conditions (CMA). The intensity of the nuclear and cytoplasmic GFP signals were determined by measuring pixel intensity in the nucleus and of an equivalent area in the cytoplasm, and the ratio was determined. A ratio higher than 1 means nuclear distribution, while a ratio lower than 1 indicates cytoplasmic distribution. Twenty cells were quantified for each experiment (two independent experiments, **P < 0.01, ns). (B) Bmh1 was required for CDK-dependent retention of Biz1 in the cytoplasm. Indicated strains were grown overnight in permissive conditions for the bmh1nar1 allele and restrictive for biz1-GFPcrg1 and Pcrg1:cdkAF (minimal medium amended with nitrate and glucose) and then transferred for 6 h to CMA medium, that represses nar1 expression and activates crg1 expression. Note that in the absence of the Bmh1 function, the Biz1-GFP signal can be colocated with the nucleus (marked by a Cut11-Cherry fusion). The Cut11-Cherry signal was very weak in the bmh1nar1 strain growing in restrictive conditions, and in some cells the nucleus seems not to be assembled. (C) Western blots to show interaction between Biz1 and Bmh1. Soluble extracts from strains carrying Bmh1-3HA and Biz1-GFP or Biz1AA-GFP tagged in their corresponding endogenous loci and carrying ectopic copies of cdk1AF under the control of a crg1 promoter were incubated with GFP-trap beads, and the immunoprecipitates submitted to Western blot with anti-HA (Bmh1) and anti-GFP (Biz1) antibodies in succession. Cells were grown in inducing conditions (CMA) for the crg1 promoter during 6 h.
Fig. 5.
Fig. 5.
Disentangling Biz1 from cell cycle regulation. (A) Scheme showing the hypothesis to be tested: untieing Biz1 from cell cycle regulation by using the biz1AA and Pdik6:clb1 alleles should disconnect appressorium formation from the cell cycle. (B) Frequency of appressoria formation in vitro in strains carrying the indicated mutations. The graph shows the result from three independent experiments, counting more than 50 filaments each (**P < 0.01). (C) Micrographs showing appressoria formation in vitro of the indicated strains. Images show AM1 marker expression (AM1-GFP) and CFW stained samples as well as magnified merged images of the apical part from GFP positive filaments. Asterisks mark septa. (Scale bar: 20 μm.) (D) Graph showing disease symptoms caused by crosses of indicated solopathogenic strains. The symptoms were scored 14 d after infection. Three independent experiments were carried out, and the average values are expressed as percentages of the total number of infected plants (n: 30 plants in each experiment, Raw data from infections are provided in the SI Appendix).
Fig. 6.
Fig. 6.
Model to explain the incompatibility between cell cycle progression and appressorium formation in U. maydis. A describes a wild-type situation, while B shows a scenario in which the ability of the b factor to arrest the cell cycle (via Cdk1 inhibitory phosphorylation) was not operative. See the text for explanations.

Similar articles

Cited by

References

    1. Brauer V. S., et al. , Antifungal agents in agriculture: Friends and foes of public health. Biomolecules 9, 521 (2019). - PMC - PubMed
    1. Schulze-Lefert P., Knocking on the heaven’s wall: Pathogenesis of and resistance to biotrophic fungi at the cell wall. Curr. Opin. Plant Biol. 7, 377–383 (2004). - PubMed
    1. Deising H. B., Werner S., Wernitz M., The role of fungal appressoria in plant infection. Microbes Infect./Inst. Pasteur 2, 1631–1641 (2000). - PubMed
    1. Mendgen K., Deising H., Infection structures of fungal plant pathogens -a cytological and physiological evaluation. New Phytol. 124, 193–213 (1993). - PubMed
    1. Mendgen K., Hahn M., Deising H., Morphogenesis and mechanisms of penetration by plant pathogenic fungi. Annu. Rev. Phytopathol. 34, 367–386 (1996). - PubMed

Publication types

Supplementary concepts

LinkOut - more resources