. 2020 Dec 1;117(48):30848-30856.
doi: 10.1073/pnas.2016119117. Epub 2020 Nov 16.

Mutation bias within oncogene families is related to proliferation-specific codon usage

Affiliations

Mutation bias within oncogene families is related to proliferation-specific codon usage

Hannah Benisty et al. Proc Natl Acad Sci U S A. .

Abstract

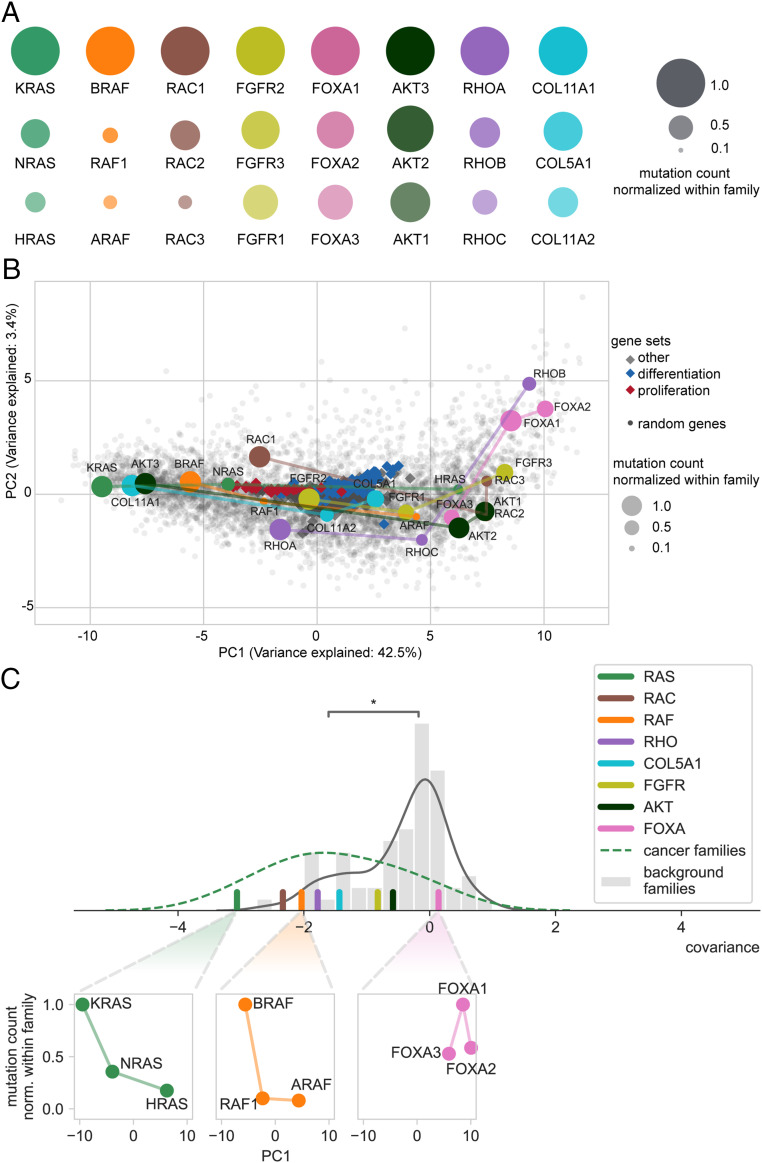
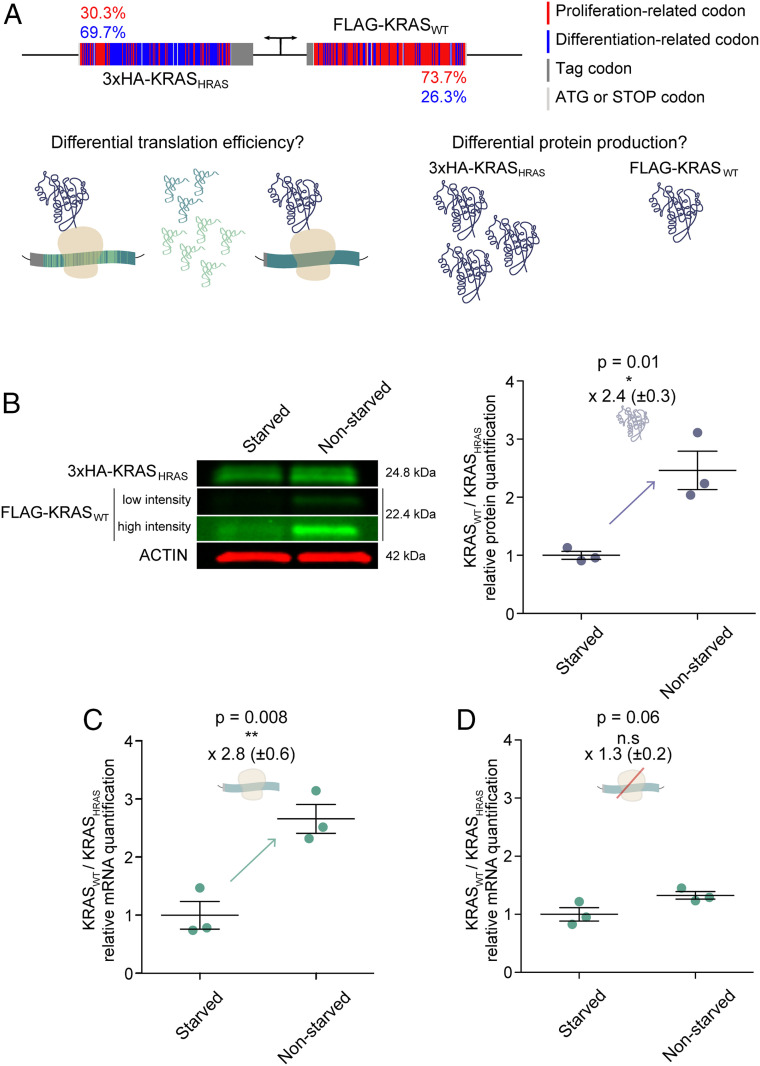
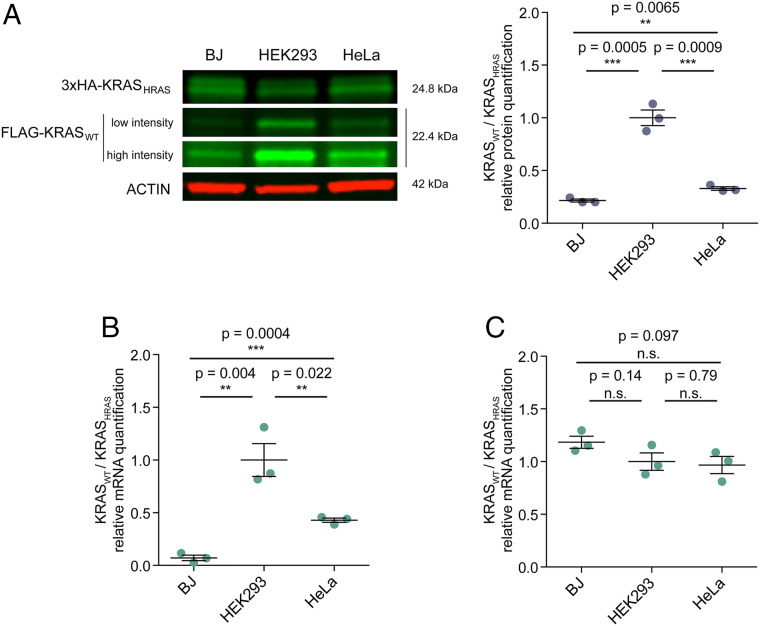
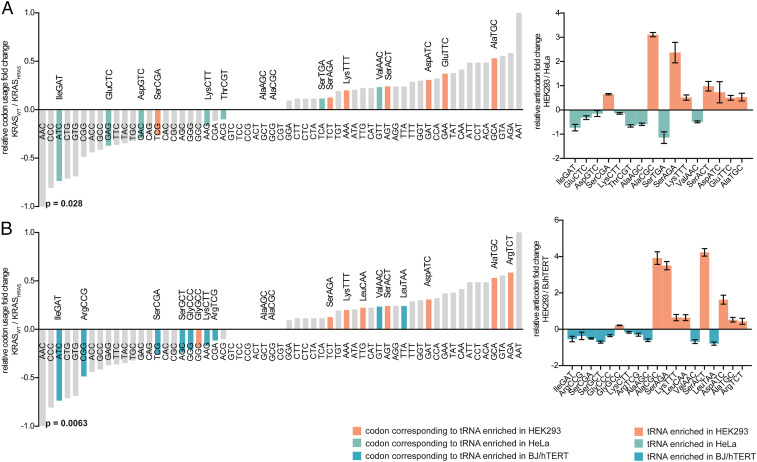
It is well known that in cancer gene families some members are more frequently mutated in tumor samples than their family counterparts. A paradigmatic case of this phenomenon is KRAS from the RAS family. Different explanations have been proposed ranging from differential interaction with other proteins to preferential expression or localization. Interestingly, it has been described that despite the high amino acid identity between RAS family members, KRAS employs an intriguing differential codon usage. Here, we found that this phenomenon is not exclusive to the RAS family. Indeed, in the RAS family and other oncogene families with two or three members, the most prevalently mutated gene in tumor samples employs a differential codon usage that is characteristic of genes involved in proliferation. Prompted by these observations, we chose the RAS family to experimentally demonstrate that the translation efficiency of oncogenes that are preferentially mutated in tumor samples is increased in proliferative cells compared to quiescent cells. These results were further validated by assessing the translation efficiency of KRAS in cell lines that differ in their tRNA expression profile. These differences are related to the cell division rate of the studied cells and thus suggest an important role in context-specific oncogene expression regulation. Altogether, our study demonstrates that dynamic translation programs contribute to shaping the expression profiles of oncogenes. Therefore, we propose this codon bias as a regulatory layer to control cell context-specific expression and explain the differential prevalence of mutations in certain members of oncogene families.

Keywords: KRAS; codon usage; oncogene; tRNA; translation.


Conflict of interest statement

The authors declare no competing interest.

Figures

Fig. 1.
Fig. 1.
Association between codon usage and mutation frequency in genes from eight different families. (A) Gene triplets with divergent mutation frequencies in cancer, mutation counts normalized within each family are represented. (B) PCA projection of the human codon usage. The location of each gene is determined by its codon usage. Distribution of GO gene sets along the main codon usage axis reveals the two functional poles: “proliferation” (negative PC1) and “differentiation” (positive PC1). The positions of each gene within the RAS, RAC, RAF, RHO, FGFR, AKT, COL, and FOXA families and their normalized mutation count are shown. (C) Distribution of the covariance of mutation count normalized within family and PC1 (lines are kernel density estimates as a guide for the eye). The covariance of cancer gene families is significantly more negative than that of background families (W.M.W. test, *P < 0.008). All families but one (FOXA) have a negative covariance.
Fig. 2.
Fig. 2.
The codon usage of KRASWT is adapted for efficient translation during proliferation. (A) Experimental design: the construct coexpresses two genes coding for the same KRAS protein, but uses different codons. KRASWT is composed of its WT codons, whereas KRASHRAS is primarily enriched in HRAS codons. We depict how the codon composition is associated with proliferation- or differentiation-related codons. While KRASWT has a proliferation-related codon composition of 73.7%, that of KRASHRAS is 30.3%. The two genes are differentiated by size using different tags (3×HA and FLAG). The KRAS protein is represented in dark purple. Distinct tRNAs pools appear in green and blue. (B) Western blot analysis of the levels of KRASWT and KRASHRAS in starved and nonstarved BJ/hTERT cells. Low- and high-scan intensities are shown, whereby the high-scan intensity enables the visualization of the FLAG-KRASWT signal in the starved condition. The KRASWT/KRASHRAS protein ratio significantly increases from the quiescent to the proliferative state. (C) Relative quantification of KRASWT/KRASHRAS by qPCR. The KRASWT/KRASHRAS transcript ratio significantly increases between the two cell states. (D) Translation is inhibited by removing the translation initiation site and ATG site. We observe that translation inhibition reduces the effect on transcript levels. Results in BD are representative of three independent experiments with three technical replicates each. Values are relative to the starved condition (KRASWT/KRASHRAS = 1). Error bars represent SEM. n.s, not significant; *P < 0.05; **P < 0.01 (unpaired Student t test).
Fig. 3.
Fig. 3.
Codon-related changes in KRAS levels in different cell lines. (A) Western blot analysis of the levels of KRASWT and KRASHRAS in BJ/hTERT, HEK293, and HeLa cells. Low- and high-scan intensities are shown, whereby the high-scan intensity enables better visualization of the FLAG-KRASWT signal in BJ/hTERT and HeLa cells. The KRASWT/KRASHRAS protein ratio varies between the different cell lines. (B) Relative quantification of KRASWT/KRASHRAS by qPCR. The KRASWT/KRASHRAS transcript ratio also varies between the cell lines. (C) Translation inhibition reduces the differential effect on transcript level observed in the cell lines. Results in AC are representative of three independent experiments with three technical replicates each. Values are relative to HEK293 cells (KRASWT/KRASHRAS = 1). Error bars represent SEM. n.s, not significant; **P < 0.01; ***P < 0.001 (unpaired Student t test).
Fig. 4.
Fig. 4.
Association of differentially expressed tRNAs and relative codon usage of KRASWT and KRASHRAS. (A) Log2 fold change of the relative codon usage (pseudocount +1) between KRASWT and KRASHRAS. Codons corresponding to tRNAs that are differentially expressed between HEK293 and HeLa cells are highlighted. The Right represents the log2 fold change of relative tRNA abundance of the tRNAs that are differentially expressed between HEK293 and HeLa cells. (B) Log2 fold change of the relative codon usage (pseudocount +1) between KRASWT and KRASHRAS. Codons corresponding to tRNAs that are differentially expressed between HEK293 and BJ/hTERT are highlighted. The Right represents the log2 fold change of relative tRNA abundance of the tRNAs that are differentially expressed between HEK293 and BJ/hTERT cells. Error bars represent SEM of three independent experiments. Binomial tests were performed in A and B (one-sided, P values shown below plots) by calculating the probability of the correct number of associations between relative tRNA expression and codon usage.

References

    1. Nowell P. C., The clonal evolution of tumor cell populations. Science 194, 23–28 (1976). - PubMed
    1. Lawrence M. S., et al. , Discovery and saturation analysis of cancer genes across 21 tumour types. Nature 505, 495–501 (2014). - PMC - PubMed
    1. Hobbs G. A., Der C. J., Rossman K. L., RAS isoforms and mutations in cancer at a glance. J. Cell Sci. 129, 1287–1292 (2016). - PMC - PubMed
    1. Ninomiya Y., et al. , K-Ras and H-Ras activation promote distinct consequences on endometrial cell survival. Cancer Res. 64, 2759–2765 (2004). - PubMed
    1. Fotiadou P. P., Takahashi C., Rajabi H. N., Ewen M. E., Wild-type NRas and KRas perform distinct functions during transformation. Mol. Cell. Biol. 27, 6742–6755 (2007). - PMC - PubMed

Publication types

Substances