. 2020 Nov 16;11(1):5823.
doi: 10.1038/s41467-020-19452-y.

Enhancer hijacking determines extrachromosomal circular MYCN amplicon architecture in neuroblastoma

Affiliations

Enhancer hijacking determines extrachromosomal circular MYCN amplicon architecture in neuroblastoma

Konstantin Helmsauer et al. Nat Commun. .

Abstract

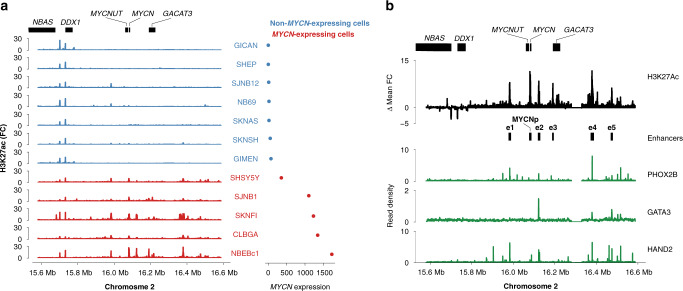
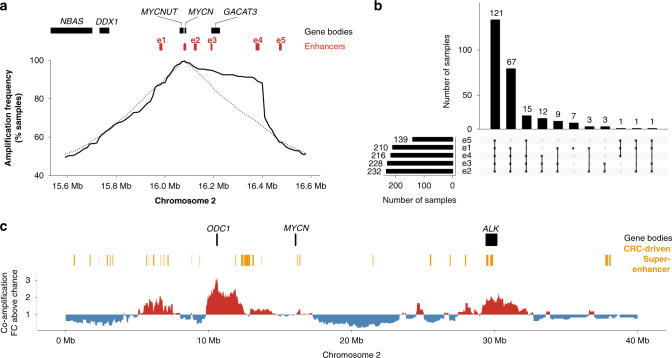
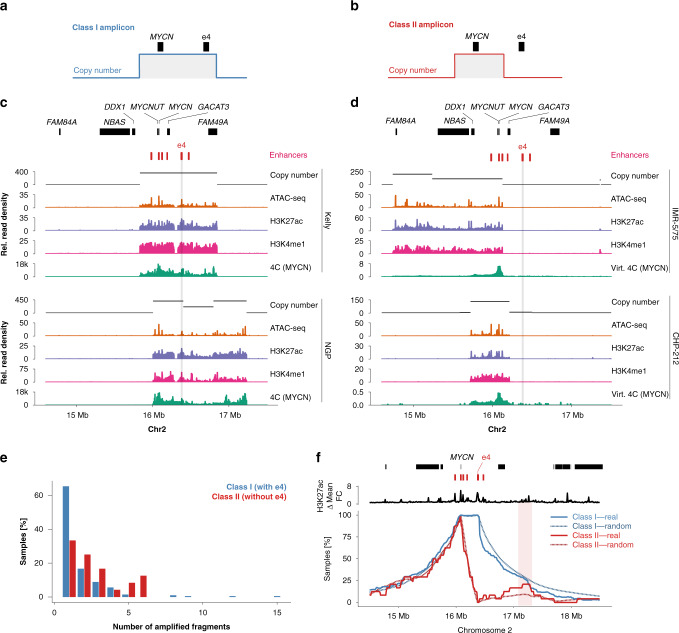
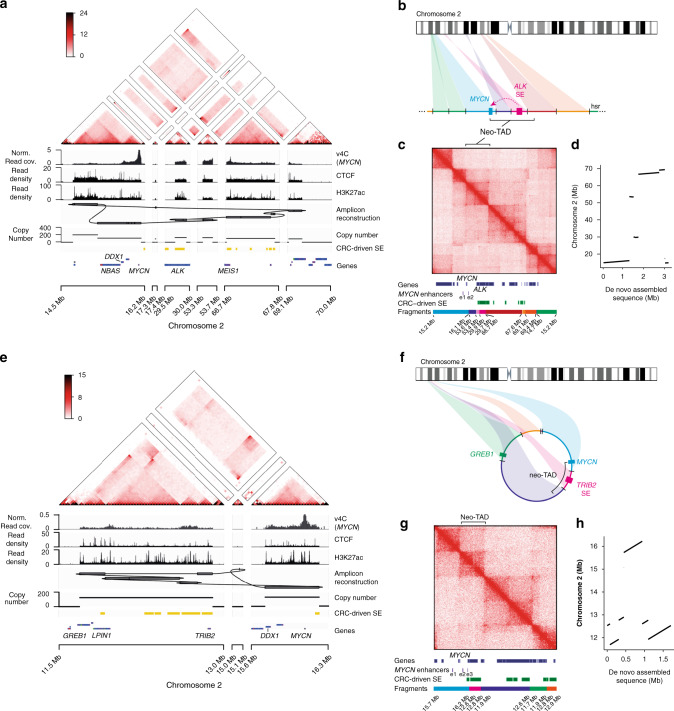
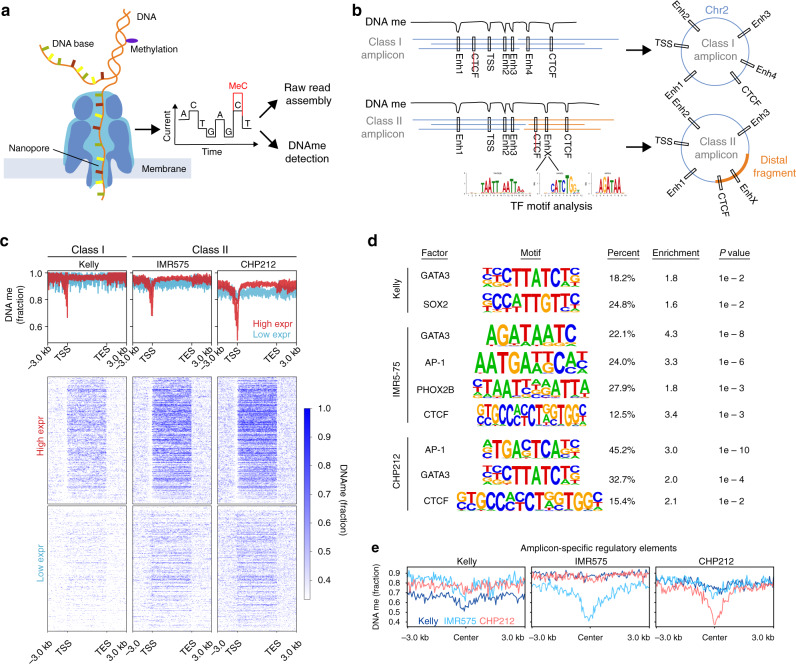
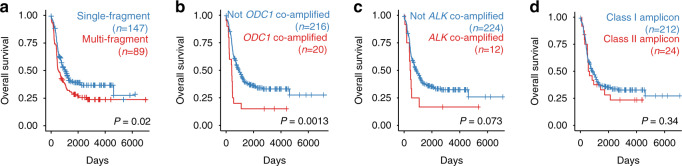
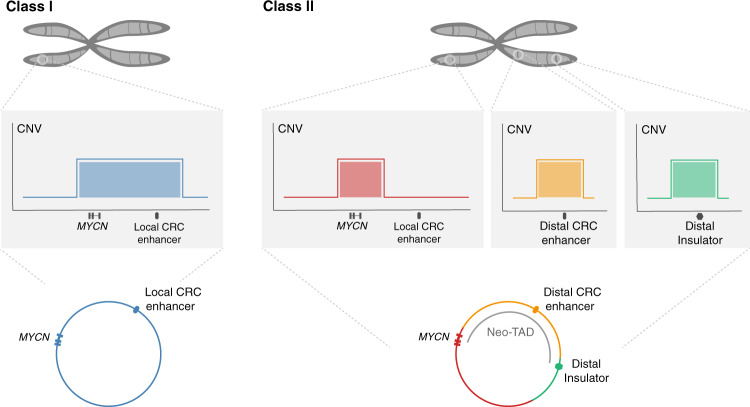
MYCN amplification drives one in six cases of neuroblastoma. The supernumerary gene copies are commonly found on highly rearranged, extrachromosomal circular DNA (ecDNA). The exact amplicon structure has not been described thus far and the functional relevance of its rearrangements is unknown. Here, we analyze the MYCN amplicon structure using short-read and Nanopore sequencing and its chromatin landscape using ChIP-seq, ATAC-seq and Hi-C. This reveals two distinct classes of amplicons which explain the regulatory requirements for MYCN overexpression. The first class always co-amplifies a proximal enhancer driven by the noradrenergic core regulatory circuit (CRC). The second class of MYCN amplicons is characterized by high structural complexity, lacks key local enhancers, and instead contains distal chromosomal fragments harboring CRC-driven enhancers. Thus, ectopic enhancer hijacking can compensate for the loss of local gene regulatory elements and explains a large component of the structural diversity observed in MYCN amplification.


Conflict of interest statement

The authors declare no competing interests.

Figures

Fig. 1
Fig. 1. Five enhancers are specifically found in MYCN-expressing neuroblastoma cells.
a H3K27ac ChIP-seq fold change over input (left) and size-factor normalized MYCN expression as determined from RNA-seq for 12 non-MYCN-amplified neuroblastoma cell lines. b Aggregated H3K27ac signal of MYCN-expressing compared to non-expressing cells (top, black; MYCNp, MYCN promoter; e1–e5, MYCN-specific enhancers). PHOX2B, GATA3, and HAND2 core regulatory circuit transcription factor ChIP-seq in an MYCN-expressing neuroblastoma cell line (green, CLB-GA). Source data are provided as a Source Data file.
Fig. 2
Fig. 2. Local enhancer e4 is significantly co-amplified with MYCN.
a Co-amplification frequency of the immediate MYCN neighborhood measured using copy-number profiles from 240 MYCN-amplified neuroblastomas (solid line) compared to the expected co-amplification frequencies for randomized MYCN-containing amplicons (dashed line). b Upset plot showing the co-amplification patterns of all five MYCN-specific local enhancers identified in neuroblastoma. c Enrichment for co-amplification with MYCN of genomic regions on 2p (red, co-amplification more frequent than expected by chance; blue, co-amplification less frequent than expected by chance). Source data are provided as a Source Data file.
Fig. 3
Fig. 3. Two classes of MYCN amplicons can be identified in neuroblastoma.
Schematic representation of class I (a) and class II (b) MYCN amplicons. c Copy-number profile (black), ATAC-seq (orange), H3K27ac ChIP-seq (purple), H3K4me1 ChIP-seq (pink), and 4C (MYCN promoter as the viewpoint; green) for two neuroblastoma cell lines with class I amplicons, co-amplifying the e4. d Copy-number profile (black), ATAC-seq (orange), H3K27ac ChIP-seq (purple), H3K4me1 ChIP-seq (pink), and virtual 4C (MYCN locus as the viewpoint; green) for two neuroblastoma cell lines class II amplicons, not co-amplifying e4. e Number of non-contiguous amplified fragments in class I samples (N = 216) vs. class II samples (N = 24). f Amplicon boundary frequency relative to gene and enhancer positions in class I vs. class II amplicons compared to random amplicon boundary frequencies. Source data are provided as a Source Data file.
Fig. 4
Fig. 4. Reconstruction and epigenetic markup of class II MYCN amplicons.
a, e Short-read-based reconstruction and epigenomic characterization of the MYCN amplicon in IMR-5/75 (a) and CHP-212 (e) cells. Top to bottom: Hi-C map (color indicating Knight–Ruiz normalized read counts in 25 kb bins), virtual 4C (MYCN viewpoint, v4C), CTCF ChIP-seq, H3K27Ac ChIP-seq, Amplicon reconstruction, copy-number profile, super-enhancer locations (yellow), gene positions (blue). b, f Schematic representation of the class II amplicon described in a, e, showing ectopic enhancers and insulator reshuffling leading to locally disrupted regulatory neighborhoods on the HSR in IMR-5/75 (b) and on ecDNA in CHP-212 (f). c, g Alignment of Hi-C reads to the reconstructed MYCN amplicon in IMR-5/75 (c) and CHP-212 (g) and positions of genes, local MYCN enhancers and CRC-driven super-enhancers on the amplicon. d, h Mapping of the long-read sequencing-based de novo assembly of the MYCN amplicon in IMR-5/75 (d) and CHP-212 (h) on chromosome 2. Source data are provided as a Source Data file.
Fig. 5
Fig. 5. Nanopore sequencing characterizes DNA methylation on MYCN amplicons.
a Schematic of experimental approach. b Schematic representation of how nanopore sequencing facilitates de novo amplicon assembly and can be used to simultaneously to detect regulatory elements through DNA methylation analysis. c Composite DNA methylation signal detected using nanopore sequencing over genes expressed at high (HighExpr) vs. low levels (LowExpr). d Motif analysis based on accessibility in regulatory elements co-amplified on MYCN amplicons (unadjusted P values from one-sided binomial test against nucleotide composition-matched background sequences). e Amplicon-specific methylation pattern detected in three neuroblastoma cell lines (Kelly, IMR-5/75, CHP-212) using nanopore sequencing-based DNA methylation analysis.
Fig. 6
Fig. 6. Class II amplicons clinically phenocopy class I amplicons.
Kaplan Meier survival analysis of patients with MYCN-amplified neuroblastoma, comparing single-fragment vs. multi-fragment amplification (a), co-amplification of ODC1 vs. no co-amplification (b), co-amplification of ALK vs. no co-amplification (c), and class I amplicons vs. class II amplicons (d; N = 236 MYCN-amplified neuroblastomas; P value based on two-sided log-rank test). Source data are provided as a Source Data file.
Fig. 7
Fig. 7. Enhancer co-amplification determines MYCN amplicon patterns.
In most cases, MYCN and its local gene-regulatory neighborhood including a CRC-driven super-enhancer is amplified (Class I). If the local neighborhood is not co-amplified, amplicons are more complex and recruit distal gene-regulatory elements (Class II).

References

    1. Turner KM, et al. Extrachromosomal oncogene amplification drives tumour evolution and genetic heterogeneity. Nature. 2017;543:122–125. doi: 10.1038/nature21356. - DOI - PMC - PubMed
    1. Zhang CZ, et al. Chromothripsis from DNA damage in micronuclei. Nature. 2015;522:179–184. doi: 10.1038/nature14493. - DOI - PMC - PubMed
    1. Ly P, et al. Chromosome segregation errors generate a diverse spectrum of simple and complex genomic rearrangements. Nat. Genet. 2019;51:705–715. doi: 10.1038/s41588-019-0360-8. - DOI - PMC - PubMed
    1. Deshpande V, et al. Exploring the landscape of focal amplifications in cancer using AmpliconArchitect. Nat. Commun. 2019;10:392. doi: 10.1038/s41467-018-08200-y. - DOI - PMC - PubMed
    1. Nathanson DA, et al. Targeted therapy resistance mediated by dynamic regulation of extrachromosomal mutant EGFR DNA. Science. 2014;343:72–76. doi: 10.1126/science.1241328. - DOI - PMC - PubMed

Publication types