. 2020 Nov 16;11(1):5795.
doi: 10.1038/s41467-020-19562-7.

Computer vision for pattern detection in chromosome contact maps

Affiliations

Computer vision for pattern detection in chromosome contact maps

Cyril Matthey-Doret et al. Nat Commun. .

Abstract

Chromosomes of all species studied so far display a variety of higher-order organisational features, such as self-interacting domains or loops. These structures, which are often associated to biological functions, form distinct, visible patterns on genome-wide contact maps generated by chromosome conformation capture approaches such as Hi-C. Here we present Chromosight, an algorithm inspired from computer vision that can detect patterns in contact maps. Chromosight has greater sensitivity than existing methods on synthetic simulated data, while being faster and applicable to any type of genomes, including bacteria, viruses, yeasts and mammals. Our method does not require any prior training dataset and works well with default parameters on data generated with various protocols.


Conflict of interest statement

The authors declare no competing interests.

Figures

Fig. 1
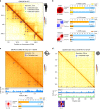
Fig. 1. Chromosight workflow and benchmark.
a Examples of distinct patterns visible on contact maps (loop, border and hairpin) and the corresponding chromosight kernels. b Matrix preprocessing involves normalisation balancing followed by the computation of observed/expected contacts. Only contacts between bins separated by a user-defined maximum distance are considered. The preprocessed matrix is then convolved with a kernel representing the pattern of interest. For each pixel of the matrix, a Pearson correlation coefficient is computed between the kernel and the surrounding window. A threshold is applied on the coefficients and a connected component labelling algorithm is used to separate groups of pixels (i.e. foci) with high correlation values. For each focus, the coordinates with the highest correlation value are used as the pattern coordinates. Coordinates located in poorly covered regions are discarded. c Comparison of Chromosight with different loop callers. Top: F1 score, Precision and Sensitivity scores assessed on labelled synthetic Hi–C data. Higher is better. d Run-time. e Memory usage according to maximum scanning distance and the amount of subsampled contact events, respectively. Means and standard deviations (grey areas) are plotted.
Fig. 2
Fig. 2. Applications on yeast genomes.
a Zoom-in of the contact map of chromosome 5 of S. cerevisiae with synchronised ChIP-Seq signal of Scc1 protein (cohesin) at 2 kb resolution with detected loops and border patterns,. The darker, the more contacts. b Pileup plots of windows centered on detected loops with the number of detections. Barplots of the proportion of Scc1 peaks for anchors of detected loops and associated p-value (Fisher test, two-sided). c Loop spectrum showing scores in function of the loop size in S. cerevisiae (974 loops) and S. pombe (1484 loops). Curves represent lowess-smoothed data for easier interpretation with 95% confidence intervals. d Number of loops detected only in G1 phase, M phase, or in both. For each category, the pileup of each set of coordinates is shown for both G1 and M conditions (mitotic data subsampled from 44M to 5.8M contacts for comparison with G1).
Fig. 3
Fig. 3. Applications to various genomes.
a Zoom-in of contact map for chromosome 2 of Homo sapiens at 10 kb resolution with Chromosight detection of loop, border and hairpin patterns. The darker, the more contacts. b Left: pileup plots of windows centered on detected loops, borders and hairpins with the number of detections. Right: bar plots showing proportion in Rad21 peaks for detected loops, proportion in CTCF peaks for detected borders and proportion of NIPBL peaks for detected hairpins and associated p-value (Fisher test, two-sided). c Detection of loops in the B. subtilis genome. Subset of the B. subtilis genome-wide contact map near the replication origin. The darker, the more contacts. Loops are called with Chromosight and annotated with blue circles. Under the contact map the ChIP-chip signal deposition of B. subtilis SMC is plotted.  The pileup plot of the detected loops, and a bar plot showing enrichment of SMC in the anchors of the detected loops (Fisher test, two-sided), are indicated underneath. d Contact map of the Epstein Barr virus genome. Called loops using Chromosight are indicated with blue circles. The ChIP-seq deposition signal of Rad21 and CTCF is plotted under the map. Associated pileup plot of the detections is indicated underneath.
Fig. 4
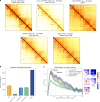
Fig. 4. Analyses with data from alternative contact technologies.
a Magnification of Homo sapiens chromosome 2 contact maps generated with five different experimental methods (around STAT1 gene; bin:10 kb): Hi–C, In situ ChiA-PET of CTCF, DNA SPRITE, HiChIP of cohesin, Micro-C. All cells are cycling GM12878 cell types except for Micro-C (hESC). Blue circles: loops detected using Chromosight. The corresponding number of reads in each of the genome-wide map is indicated above the panels. The parameter (if any) notified to Chromosight is also indicated above each map. b Number of loops detected using Chromosight with default parameters for the five datasets. c Left: loop spectrum computed using Chromosight in quantify mode on pairs of cohesin peaks for the five datasets (Methods). Curves represent lowess-smoothed data with 95% confidence intervals. Right: associated pileup plots of the quantified positions for the five different experimental methods.
Fig. 5
Fig. 5. Point and click mode.
a Whole-genome contact map of S. cerevisiae with 15 inter-centromere patterns that were selected by hand. Darker means more contacts. b Chromosight generates a new kernel by summing all the selected patterns and applying a Gaussian filter. c Chromosight detection of the inter-centromeres patterns in the whole-genome contact map of C. albicans with the resulting pileup plot of the 27 detections.

References

    1. Dekker J, Rippe K, Dekker M, Kleckner N. Capturing chromosome conformation. Science. 2002;295:1306–1311. doi: 10.1126/science.1067799. - DOI - PubMed
    1. Lieberman-Aiden E, et al. Comprehensive mapping of long-range interactions reveals folding principles of the human genome. Science. 2009;326:289–293. doi: 10.1126/science.1181369. - DOI - PMC - PubMed
    1. Fullwood MJ, et al. An oestrogen-receptor-alpha-bound human chromatin interactome. Nature. 2009;462:58–64. doi: 10.1038/nature08497. - DOI - PMC - PubMed
    1. Dixon JR, et al. Topological domains in mammalian genomes identified by analysis of chromatin interactions. Nature. 2012;485:376–380. doi: 10.1038/nature11082. - DOI - PMC - PubMed
    1. Nora EP, et al. Spatial partitioning of the regulatory landscape of the x-inactivation centre. Nature. 2012;485:381–5. doi: 10.1038/nature11049. - DOI - PMC - PubMed

Publication types