. 2020 Nov 16;10(1):19835.
doi: 10.1038/s41598-020-76769-w.

GIANT: galaxy-based tool for interactive analysis of transcriptomic data

Affiliations

GIANT: galaxy-based tool for interactive analysis of transcriptomic data

Jimmy Vandel et al. Sci Rep. .

Abstract

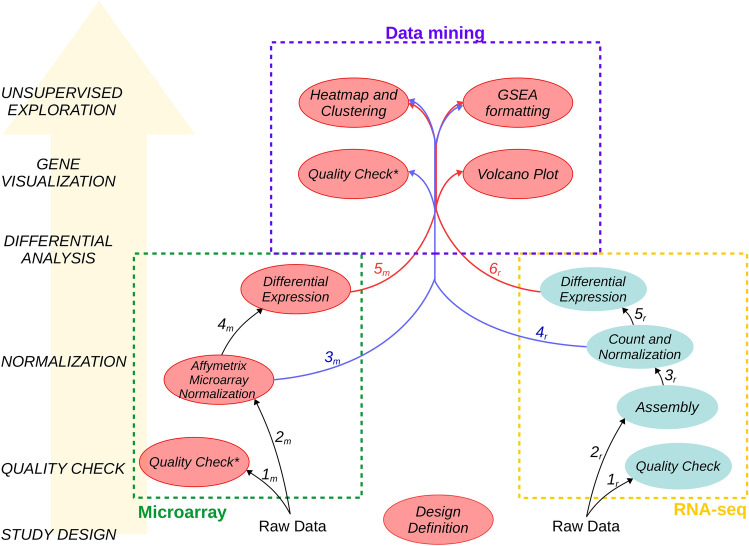
Transcriptomic analyses are broadly used in biomedical research calling for tools allowing biologists to be directly involved in data mining and interpretation. We present here GIANT, a Galaxy-based tool for Interactive ANalysis of Transcriptomic data, which consists of biologist-friendly tools dedicated to analyses of transcriptomic data from microarray or RNA-seq analyses. GIANT is organized into modules allowing researchers to tailor their analyses by choosing the specific set of tool(s) to analyse any type of preprocessed transcriptomic data. It also includes a series of tools dedicated to the handling of raw Affymetrix microarray data. GIANT brings easy-to-use solutions to biologists for transcriptomic data mining and interpretation.


Conflict of interest statement

The authors declare no competing interests.

Figures

Figure 1
Figure 1
Transcriptomic analysis workflows using GIANT Galaxy tools. The general steps of the workflows are indicated on the left. Two workflows depending on the initial raw data are represented, both starting from the design definition (at the center bottom) to generic data mining analyses (purple dashed area at the top). Specific steps from quality check to differential analysis are indicated for microarray (left, green dashed area) and RNA-seq (right, yellow dashed area). Steps in which GIANT tools can be used are coloured in red, specific RNA-seq steps with available Galaxy tools are coloured in blue. Arrows 1m-5m and 1r-6r indicate the tools which should be used in consecutive steps for microarray and RNA-seq data analysis, respectively. Note that running the Quality Check tool both before and after data normalization is recommended (*marked).
Figure 2
Figure 2
Extract of a factor file describing experimental design (GEO:GSE46495). For each sample listed in the first column, associated values for 3 experimental factors (Diet, Tissue and Mouse ID) are given in the 3 following columns.
Figure 3
Figure 3
Partial view of the differential expression tool form showing input files selection, definition of contrasts and auto-generation of complex interaction contrasts. Both normalized data and study design files are selected input files. Definition of contrasts requires selection of factors among those automatically extracted from the design file and definition of groups (to compare first group to second group) as a selection of one or several factor value combinations (dynamically generated based on selected factors). Interaction contrasts are automatically defined as a function of the control value selected by the user.
Figure 4
Figure 4
Partial view of the differential expression tool form showing tuning parameters and optional outputs. False Discovery Rate (FDR) and Fold Change cutoffs are tuned to filter out genes/probes from the output file. P-value histograms and volcano plots for each contrast are added to the output upon user request, as well as additional gene information extracted from public databases.
Figure 5
Figure 5
Graphics produced by the Quality Check tool. Before normalization: (a) boxplots and (b) histograms of raw data including all .CEL files and (c) MA-plot of a single .CEL file. After normalization: (d) histograms and (e) 3D PCA of normalized microarray expression data.
Figure 6
Figure 6
Results issued from the Differential expression tool: (a) differential statistics, (b) p-value distribution for a given contrast and (c) F-ratio bar plot for differential model factors; Graphic generated by the Volcano plot tool: (d) volcano plot generated from statistics computed by the Differential expression tool.
Figure 7
Figure 7
Results issued from the Heatmap and clustering tool: (a) cluster information added to differential statistics, (b) normalized microarray expression heatmap with hierarchical clustering of genes and samples and (c) scree plot showing within-clusters variance as a function of cluster number to assist in the cluster number choice.
Figure 8
Figure 8
Graphics issued from the Quality Check tool: (a) 3D PCA of normalized RNA-seq expression data and the Heatmap and clustering tool: (b) normalized RNA-seq expression heatmap with hierarchical clustering of genes and samples.

References

    1. Afgan E, et al. The galaxy platform for accessible, reproducible and collaborative biomedical analyses: 2018 update. Nucleic Acids Res. 2018;46:W537–W544. doi: 10.1093/nar/gky379. - DOI - PMC - PubMed
    1. Andrews, S. et al.FastQC.http://www.bioinformatics.babraham.ac.uk/projects/fastqc/ (2012).
    1. Ewels P, Magnusson M, Lundin S, Käller M. MultiQC: summarize analysis results for multiple tools and samples in a single report. Bioinformatics. 2016;32:3047–3048. doi: 10.1093/bioinformatics/btw354. - DOI - PMC - PubMed
    1. Varet H, Brillet-Guéguen L, Coppée J-Y, Dillies M-A. SARTools: a DESeq2- and EdgeR-based R pipeline for comprehensive differential analysis of RNA-seq Data. PLOS ONE. 2016;11:1–8. doi: 10.1371/journal.pone.0157022. - DOI - PMC - PubMed
    1. Ritchie ME, et al. limma powers differential expression analyses for RNA-sequencing and microarray studies. Nucleic Acids Res. 2015;43:e47. doi: 10.1093/nar/gkv007. - DOI - PMC - PubMed

Publication types

MeSH terms