. 2020 Nov 16;11(1):5817.
doi: 10.1038/s41467-020-19682-0.

Genome of Solanum pimpinellifolium provides insights into structural variants during tomato breeding

Affiliations

Genome of Solanum pimpinellifolium provides insights into structural variants during tomato breeding

Xin Wang et al. Nat Commun. .

Abstract

Solanum pimpinellifolium (SP) is the wild progenitor of cultivated tomato. Because of its remarkable stress tolerance and intense flavor, SP has been used as an important germplasm donor in modern tomato breeding. Here, we present a high-quality chromosome-scale genome sequence of SP LA2093. Genome comparison identifies more than 92,000 structural variants (SVs) between LA2093 and the modern cultivar, Heinz 1706. Genotyping these SVs in ~600 representative tomato accessions identifies alleles under selection during tomato domestication, improvement and modern breeding, and discovers numerous SVs overlapping genes known to regulate important breeding traits such as fruit weight and lycopene content. Expression quantitative trait locus (eQTL) analysis detects hotspots harboring master regulators controlling important fruit quality traits, including cuticular wax accumulation and flavonoid biosynthesis, and SVs contributing to these complex regulatory networks. The LA2093 genome sequence and the identified SVs provide rich resources for future research and biodiversity-based breeding.


Conflict of interest statement

The authors declare no competing interests.

Figures

Fig. 1
Fig. 1. Genomic landscape of S. pimpinellifolium LA2093 and structural variants identified between LA2093 and Heinz 1706.
a Features of the LA2093 genome. (i) Ideogram of the 12 chromosomes in Mb scale. (ii) Repeat content (% nucleotides per Mb); (iii) gene density (number of genes per Mb). (iv) Gene expression (FPKM). (v) Densities of SVs (structural variants) (outer) and SNPs (inner) in comparison to Heinz 1706 (number of SVs and SNPs per Mb). b Alignment of chromosome 1 between LA2093 and Heinz 1706. The color intensity in Hi-C heatmaps represents the number of links between two 100-kb windows. The inversion shown in blue (left) is supported by high-density contacts pointed by the two blue arrows in Hi-C heatmaps generated from Heinz 1706 Hi-C reads aligned to the LA2093 genome (middle), while no corresponding contract is found in the LA3093 Hi-C heatmap (right). c Distribution of SV sizes. d Contents of different categories of transposable elements in SV regions and the whole-genome of LA2093.
Fig. 2
Fig. 2. SVs under selection during tomato domestication and breeding.
a Percentages of SVs with different genotypes in each accession of different groups. The numbers of accessions are 50, 6, 224, 225, and 51 in SP, SCG, SLC, Heirloom, and Modern groups, respectively. For each box plot, the lower and upper bounds of the box indicate the first and third quartiles, respectively, and the center line indicates the median. The whisker represents 1.5× interquartile range of the lower or upper quartile. b Venn diagrams of selected SVs during domestication (SP to SLC), improvement (SLC to heirloom) and modern breeding (heirloom to modern). c, d GO terms enriched in genes affected by SVs selected during domestication (c) and improvement (d). Enriched GO terms were identified using two-tailed Fisher’s exact test, adjusted for multiple comparisons. Source data underlying Fig. 2a are provided as a Source data file.
Fig. 3
Fig. 3. Selected SVs affecting the expression of lycopene metabolism genes.
a Lycopene biosynthesis and degradation pathway in tomato. Stars indicate enzyme-coding genes having selected SVs associated with significantly different gene expression levels between the two alleles (two-tailed Student’s t-test p value <0.01). b Allele frequencies of selected SVs in SP (P), SLC (C), heirloom (H) and modern (M) populations. c Gene expression levels in tomato accessions carrying the homozygous LA2093 and Heinz 1706 alleles, respectively, of the selected SVs. For each SV from left to right, the numbers of accessions with homozygous LA2093 alleles are 11, 20, 4, 10, 9, 9, and 18, and those with homozygous Heinz alleles 162, 210, 131, 129, 164, 155, and 244, respectively. Two-tailed Student’s t-test was performed to compare expression levels of each gene between the accessions with homozygous LA2093 and with Heinz alleles for each SV. For each box plot, the lower and upper bounds of the box indicate the first and third quartiles, respectively, and the center line indicates the median. The whisker represents 1.5× interquartile range of the lower or upper quartile. G3P, glyceraldehyde 3-phosphate; IPP, isopentenyl diphosphate; DMAPP, dimethylallyl diphosphate; GGPP, geranylgeranyl diphosphate; DXS, 1-deoxy-d-xylulose 5-phosphate synthase; DXR, 1-deoxy-D-xylulose-5-phosphate reductoisomerase; GGPPS, geranylgeranyl pyrophosphate synthase; PSY, phytoene synthase; ZISO, ζ-carotene isomerase; ZDS, ζ-carotene desaturase; CrtISO, carotene isomerase; LCY-B, lycopene β-cyclase; LCY-E, lycopene ε-cyclase. Source data underlying Fig. 3c are provided as a Source data file.
Fig. 4
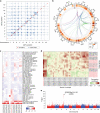
Fig. 4. Genome-wide mapping of eQTLs.
a Positions of eQTLs identified in the genome. b Trans-eQTL hotspots. The outermost circle displays ideograms of the 12 tomato chromosomes. The second circle shows the number of target genes for all eQTLs in each 2-Mb window. The third circle shows the number of target genes of each trans-eQTL hotspot. The innermost circle shows the links between three interesting eQTL hotspots and their target genes. Links between the three hotspots harboring the master regulators, A20/AN1 zinc finger protein, MYB12, and WRI3, respectively, and their target genes are depicted in purple, blue and green, respectively. c Expression profiles of WRI3-targeted lipid biosynthetic genes in different tomato tissues. The WRI3 gene (SPIMP03g0114120) is highlighted in red. d Correlation coefficients between the expression levels of genes in the WRI3-hotspot and target genes. WRI3 and the target lipid biosynthetic genes are highlighted in red. e Manhattan plot of eQTLs associated with the WRI3 expression. The horizontal dashed lines correspond to the Bonferroni-corrected significance thresholds at α = 0.05 and α = 1.

References

    1. Blanca J, et al. Variation revealed by SNP genotyping and morphology provides insight into the origin of the tomato. PLoS ONE. 2012;7:e48198. doi: 10.1371/journal.pone.0048198. - DOI - PMC - PubMed
    1. Blanca J, et al. Genomic variation in tomato, from wild ancestors to contemporary breeding accessions. BMC Genomics. 2015;16:257. doi: 10.1186/s12864-015-1444-1. - DOI - PMC - PubMed
    1. Ebert, A. W. & Schafleitner, R. in Crop Wild Relatives and Climate Change, 141–172 (John Wiley & Sons, Inc Hoboken, NJ, USA, 2015).
    1. Tomato Genome Consortium. The tomato genome sequence provides insights into fleshy fruit evolution. Nature. 2012;485:635–641. doi: 10.1038/nature11119. - DOI - PMC - PubMed
    1. Razali R, et al. The genome sequence of the wild tomato Solanum pimpinellifolium provides insights into salinity tolerance. Front Plant Sci. 2018;9:1402. doi: 10.3389/fpls.2018.01402. - DOI - PMC - PubMed

Publication types