. 2020 Nov 16;11(1):5799.
doi: 10.1038/s41467-020-19584-1.

Transient commensal clonal interactions can drive tumor metastasis

Affiliations

Transient commensal clonal interactions can drive tumor metastasis

Suha Naffar-Abu Amara et al. Nat Commun. .

Abstract

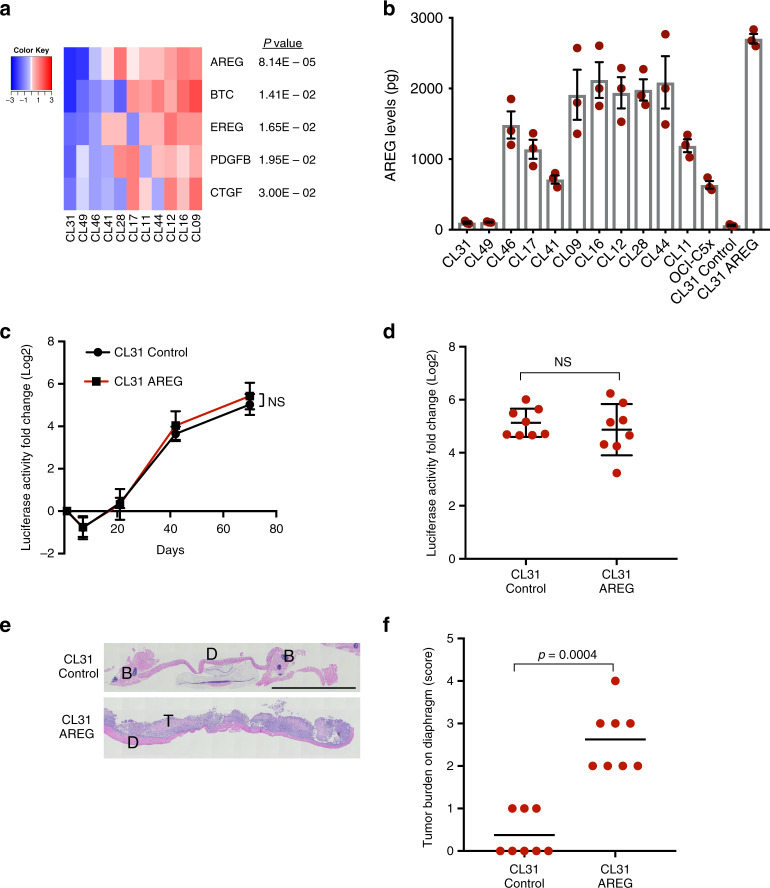
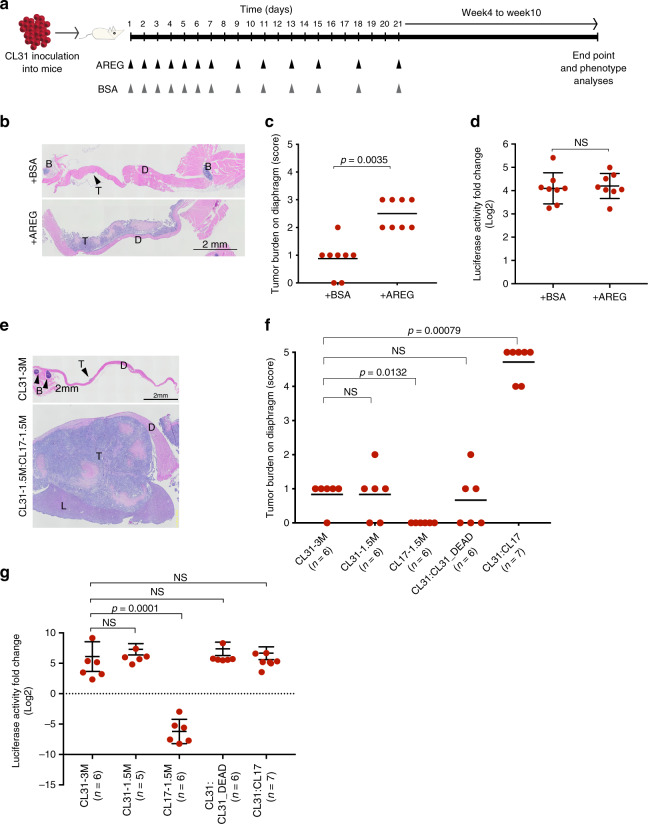
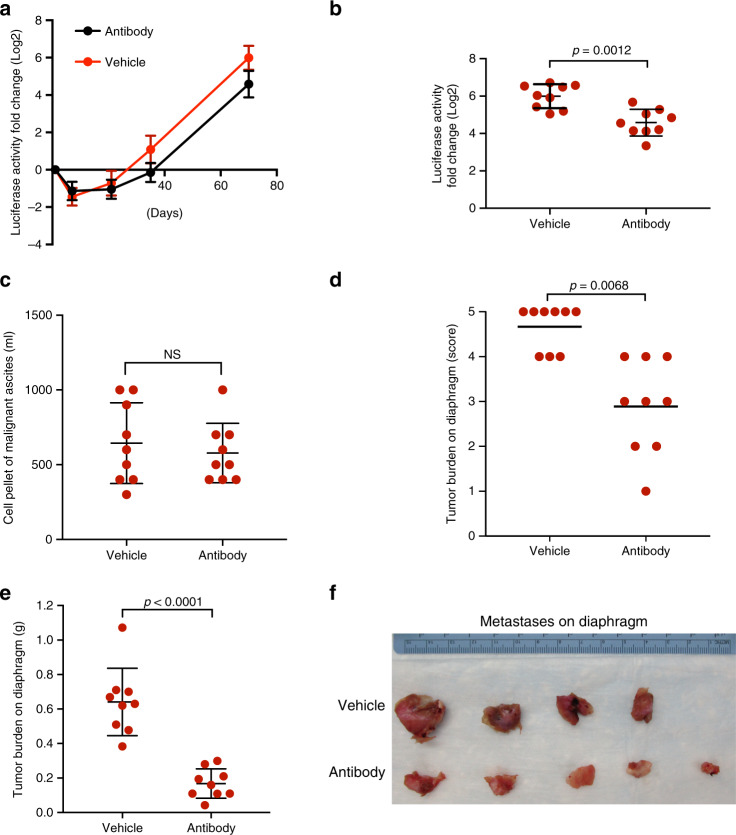
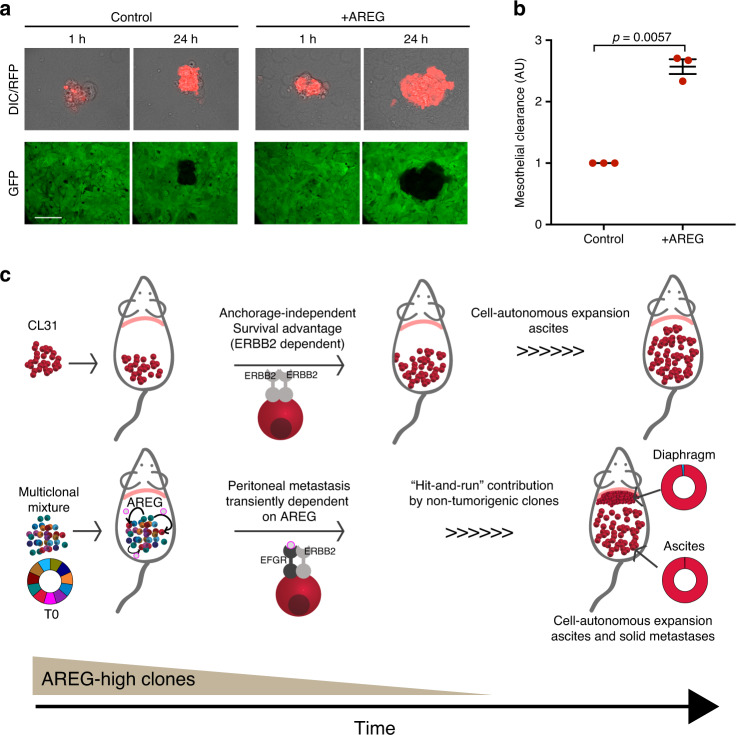
The extent and importance of functional heterogeneity and crosstalk between tumor cells is poorly understood. Here, we describe the generation of clonal populations from a patient-derived ovarian clear cell carcinoma model which forms malignant ascites and solid peritoneal tumors upon intraperitoneal transplantation in mice. The clonal populations are engineered with secreted Gaussia luciferase to monitor tumor growth dynamics and tagged with a unique DNA barcode to track their fate in multiclonal mixtures during tumor progression. Only one clone, CL31, grows robustly, generating exclusively malignant ascites. However, multiclonal mixtures form large solid peritoneal metastases, populated almost entirely by CL31, suggesting that transient cooperative interclonal interactions are sufficient to promote metastasis of CL31. CL31 uniquely harbors ERBB2 amplification, and its acquired metastatic activity in clonal mixtures is dependent on transient exposure to amphiregulin, which is exclusively secreted by non-tumorigenic clones. Amphiregulin enhances CL31 mesothelial clearance, a prerequisite for metastasis. These findings demonstrate that transient, ostensibly innocuous tumor subpopulations can promote metastases via "hit-and-run" commensal interactions.


Conflict of interest statement

The authors declare no competing interests.

Figures

Fig. 1
Fig. 1. Clonal populations display variable growth dynamics in vivo.
a Schematic depiction of tumor cell populations inoculated into immunocompromised (NSG) female mice. b Tumor growth dynamics in vivo assessed by measurement of luciferase activity in whole blood samples collected at the indicated time points. Dashed line represents Gluc values at background levels. Data presented as fold change in luciferase activity compared to 24 h post injection. Data represent mean ± SD of each group (n = as indicated) from three independent experiments. c Fold change in luciferase activity per mouse determined as in (b) at the 10-week end point. p Values were computed using the one-way ANOVA test followed by Dunnett’s multiple comparison test, comparing parental line to each of the clones and the multiclonal mixture. NS not significant. d Colony formation in soft agar measured after 21 days and normalized to the parental line. Data represent mean ± SEM from three independent experiments, biological replicates were performed on cells that had been passaged anywhere between 8 and 23 times. p Values were computed using the one-way ANOVA test followed by Dunnett’s multiple comparison test, comparing either parental or CL31 against each of the clones. e Images of a representative soft agar colony formation assay from one of three independent experiments. Scale bar represents 1 mm. f Linear regression analysis of colony formation in soft agar and tumor burden (measured by luciferase activity in blood samples collected at 10-week end point) for all 11 clonal populations. p = 0.0081, two-tailed. See also Supplementary Figs. 1–3.
Fig. 2
Fig. 2. Individual clonal populations fail to form solid peritoneal metastases.
a Representative images of OCI-C5x generated malignant ascites, and b solid tumors on the diaphragm, which connect to the liver (white arrow). c H&E-stained sections from the solid tumor masses, representative images from one of three independent experiments. Note that the tumor cells maintain histopathological characteristics of CCC in patients with “clear” cells (C-left image, arrow) and hobnail features (C-right image, arrow). Scale bar, 100 μm. d Representative H&E images of tumor sections of solid metastases on diaphragm generated by CL31, CL49, and the multiclonal mixture, representative images from one of two independent experiments. T tumor cells, D diaphragm, L liver. Scale bar, 5 mm. e Tumor burden score of solid metastases on the diaphragm (data from two independent experiments, n = 8–10 mice per group). Scored blindly. p Values were computed using the chi-square test with Monte Carlo simulation. f Schematic depiction of experimental design and workflow for barcode experiments. g Barcode representation in the indicated samples collected from mice injected with the multiclonal mixture composed of barcoded clones, and h in samples collected from monolayer and suspension cultures in vitro. A representative of two independent experiments.
Fig. 3
Fig. 3. Molecular analyses of clonal populations reveal CL31-specific genetic alterations.
a Heatmap representation of copy number alterations in the parental OCI-C5x cell line and clonal populations. b, c Representative images from one of three independent experiments of FISH staining for ERBB2 (red) and CEP17 (green) of b CL31 and c parental OCI-C5x cells in vitro. Scale bar 20 μm. d Quantification of cells with ERBB2:CEP17 copy number ratio equal or greater than two (FISH data) in the OCI-C5x cell line in vitro from experiment in (b) and in solid metastases derived from the OCI-C5x cell line. Data shown as mean ± SEM from three independent experiments, p Value was computed using the Mann–Whitney test, two-tailed. e Representative Western blot of ERBB2 protein in the OCI-C5x cell line and each of the clonal populations. β-actin was used as a loading control, representative blots from one of two independent experiments. f Maximum parsimony tree generated from all filter-passing substitutions detected by whole-exome sequencing of all single-cell derived clonal populations, and an autologous DNA sample from the patient’s blood. Branches colored by mean VAF of mutations in parental clone. g Western blot showing ERBB2 knockdown in CL31 using four distinct shRNAs, representative blots from one of three independent experiments. h Representative images and i quantification of colony formation in soft agar by CL31 expressing a control shRNA (GFP) or one of two distinct ERBB2 shRNAs (Sh2 and Sh4). Scale bar, 500 μm. The number of colonies were normalized to that of shGFP control. Three independent experiments were summarized by mean ± SEM. p Values were computed using the one-way ANOVA test and corrected for multiple comparisons using the Dunnett’s method. j OCI-C5x parental cells were sorted into ERBB2-low and ERBB2-high expressing populations by FACS. k Representative images of colony formation in soft agar by the unsorted OCI-C5x parental line and the ERBB2-low and ERBB2-high populations. Scale bar, 250 μm. l Quantification of colony formation in soft agar in (k) by the indicated OCI-C5x populations. Data were normalized to that of the unsorted parental line. Three independent experiments were shown as mean ± SEM. p Values were computed using the one-way ANOVA test and corrected for multiple comparisons using the Dunnett’s method.
Fig. 4
Fig. 4. Overexpression of amphiregulin induces peritoneal metastasis of CL31.
a Heatmap of ligands identified by RNA-sequencing. Growth factors and cytokines that were expressed by one or more of the other clones and poorly expressed in CL31 were identified and filtered for those whose corresponding receptor(s) were expressed in CL31 (cpm > 2). The relative mRNA levels of the identified ligands/growth factors are shown. Data are mean centered Log2. FDR-corrected p values were calculated using the exact binomial test in edgeR. b Levels of AREG secreted into the media by the indicated clonal populations over the course of 36 h, as determined by an ELISA assay. Data represent as mean ± SEM from three independent experiments. c Tumor burden in vivo assessed by measurement of luciferase activity in whole blood samples collected at the indicated time points. Data presented as fold change in luciferase activity compared to 24 h post injection. Representative of two independent experiments. Data summarized by mean ± SD, p values were computed using the Student’s t test and FDR corrected. d Fold change in luciferase activity in blood samples of individual mice collected at the end point (10 weeks) relative to the 24 h time point. The data shown as mean ± SD. p Values were computed using the one-way ANOVA test and Dunnett’s multiple comparison test. e Representative H&E images of solid peritoneal metastases on the diaphragm of mice inoculated with CL31 expressing AREG or vector control. T tumor cells, D diaphragm. Scale bar, 2 mm. f Tumor burden score of solid metastases on the diaphragms of mice inoculated with CL31 expressing AREG or vector control, determined as in Fig. 2e. p Value was computed using the chi-square test with Monte Carlo simulation. df Data from two independent experiments, total n = 8 mice.
Fig. 5
Fig. 5. Transient exposure to CL17 or AREG is sufficient to promote peritoneal metastasis of CL31.
a Schematic depiction of experimental design of short-term supplementation with human recombinant AREG in vivo. b Representative H&E images of diaphragms collected from mice at the 10-week end point supplemented with AREG or BSA vehicle control as depicted in (a), representative images from one of two independent experiments. T tumor cells, D diaphragm, B bone. Scale bar, 2 mm. c Tumor burden score of solid metastases on the diaphragm generated by CL31 in mice treated with AREG or BSA vehicle control. Data from two independent experiments, total n = 8 mice. p Value was computed using the chi-square test with Monte Carlo simulation. d Fold change in luciferase activity in blood samples collected from individual mice at the end point (10 weeks) relative to the 24-h time point. Data from two independent experiments (total n = 8 mice) and shown as mean ± SD. p Value was computed using the Mann–Whitney test, two-tailed. NS not significant. e Representative H&E images of the diaphragms of mice inoculated with CL31 alone (3 × 106 cells) or a 1:1 mixture of CL31 and CL17 (3 × 106 total cells). T tumor cells, D diaphragm, L liver, B bone. Scale bar, 2 mm. f Tumor burden score of solid metastases on the diaphragm generated by the indicated cell inocula. Data from two independent experiments (total n = 6–7 mice) and shown as mean ± SD. p Values were computed using the chi-square test with Monte Carlo simulation. NS not significant. g Fold change in luciferase activity in blood samples collected from individual mice at the end point (10 weeks) relative to the 24-h time point. Data from two independent experiments (total n = 6–7 mice) and shown as mean ± SD. p Values were computed using the one-way ANOVA test and Dunnett’s multiple comparison test. NS not significant.
Fig. 6
Fig. 6. AREG blocking antibody reduces solid peritoneal metastasis.
a Tumor growth dynamics of an equal mixture of CL31 and CL17 (CL31:CL17) treated with 200 μg monoclonal AREG blocking antibody or vehicle control, assessed by measurement of luciferase activity in whole blood samples collected at the indicated time points. Data presented as fold change in luciferase activity compared to 24 h post injection. Data represents mean ± SD from two independent experiments, n = 9 mice each group. b Fold change in luciferase activity per mouse injected with CL31:CL17 determined as in (a) at the 10-week end point. p Value was computed using the Mann–Whitney test, two-tailed. c Malignant ascites cell pellet volume at the 10-week end point. p Value was computed using the Mann–Whitney test, two-tailed. d Tumor burden score of solid metastases on the diaphragm at 10-week end point generated by CL31:CL17 in mice treated with AREG blocking antibody or vehicle control. p Value was computed using the chi-square test with Monte Carlo simulation. e Weight of solid tumors on the diaphragms at 10-week end point of same tumors in (d). Data from two independent experiments, n = 9 mice in total for each group, and shown as mean ± SD. p Values from Mann–Whitney test, two-tailed. NS not significant. f Individual diaphragms from mice in one of the two experiments at the 10-week end point.
Fig. 7
Fig. 7. AREG enhances mesothelial clearance ability of CL31.
a Representative differential interference contrast (DIC) and pseudocolored confocal fluorescence images of ability of vehicle- or AREG-treated CL31 cell clusters expressing red fluorescent protein (RFP) to clear a mesothelial monolayer expressing green fluorescent protein (GFP) at the indicated time points. Scale bar, 50 μm. b Quantification of the mesothelial clearance area (black area within the green monolayer) cleared in 24 h by CL31 spheroids treated with vehicle or AREG from three independent experiments. Mesothelial area cleared at the end point was normalized to the initial (1 h) area of CL31 clusters (measured from the DIC images), as previously described. Relative clearance area of 20–30 clusters of CL31 of each condition per experiment were analyzed and averaged. Data shown as mean ± SEM of three independent experiments, shown in arbitrary units (AU), p value from Welch’s t test of the means. c Model illustrating the transient cooperative interactions involved in metastasis in this model system. CL31, which carries amplified ERBB2 and displays anchorage-independent growth in vitro, forms only malignant ascites, but is unable to form solid peritoneal metastasis. Transient and non-tumorigenic AREG-high clones can act at an early temporal window, and are later dispensable, to induce CL31 solid peritoneal metastasis. AREG is required for metastasis of CL31, but not expansion in ascites or metastatic sites.

References

    1. Heppner GH. Tumor heterogeneity. Cancer Res. 1984;44:2259–2265. - PubMed
    1. Minn AJ, et al. Distinct organ-specific metastatic potential of individual breast cancer cells and primary tumors. J. Clin. Investig. 2005;115:44–55. doi: 10.1172/JCI22320. - DOI - PMC - PubMed
    1. Meyer M, et al. Single cell-derived clonal analysis of human glioblastoma links functional and genomic heterogeneity. Proc. Natl Acad. Sci. USA. 2015;112:851–856. doi: 10.1073/pnas.1320611111. - DOI - PMC - PubMed
    1. Merlo LMF, Pepper JW, Reid BJ, Maley CC. Cancer as an evolutionary and ecological process. Nat. Rev. Cancer. 2006;6:924–935. doi: 10.1038/nrc2013. - DOI - PubMed
    1. Little, M. P. Cancer models, genomic instability and somatic cellular Darwinian evolution. Biol. Direct5, 19 (2010). - PMC - PubMed

Publication types

MeSH terms