. 2020 Nov 16;7(1):398.
doi: 10.1038/s41597-020-00726-5.

A new global dataset of bioclimatic indicators

Affiliations

A new global dataset of bioclimatic indicators

Sergio Noce et al. Sci Data. .

Abstract

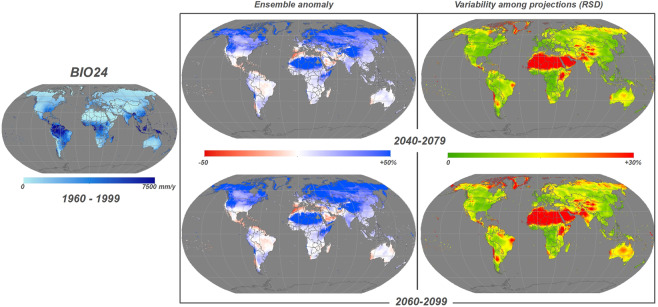
This study presents a new global gridded dataset of bioclimatic indicators at 0.5° by 0.5° resolution for historical and future conditions. The dataset, called CMCC-BioClimInd, provides a set of 35 bioclimatic indices, expressed as mean values over each time interval, derived from post-processing both climate reanalysis for historical period (1960-1999) and an ensemble of 11 bias corrected CMIP5 simulations under two greenhouse gas concentration scenarios for future climate projections along two periods (2040-2079 and 2060-2099). This new dataset complements the availability of spatialized bioclimatic information, crucial aspect in many ecological and environmental wide scale applications and for several disciplines, including forestry, biodiversity conservation, plant and landscape ecology. The data of individual indicators are publicly available for download in the commonly used Network Common Data Form 4 (NetCDF4) format.


Conflict of interest statement

The authors declare no competing interests.

Figures

Fig. 1
Fig. 1
Example of BIO34 - Potential Evapotranspiration (PET, mm/y) according to Hargreaves formulation for historical time interval 1960–1999 (left). Ensemble anomaly of the 11 CMIP5 simulations for the future period compared to the historical one expressed in percentage (center) and the variation among simulation expressed in Relative Standard Deviation (RSD) (right) for the two time horizons 2040–2079 (top) and 2060–2099 (bottom).
Fig. 2
Fig. 2
Example of BIO24 - Yearly positive precipitation (mm/y) for historical time interval 1960–1999 (left). Ensemble anomaly of the 11 CMIP5 simulations for the future period compared to the historical one expressed in percentage (center) and the variation among simulation expressed in Relative Standard Deviation (RSD) (right) for the two time horizons 2040–2079 (top) and 2060–2099 (bottom).
Fig. 3
Fig. 3
Workflow of the comparison between CMCC-BioClimInd 1.0 and WorldClim 2.0 for the historical period. The WorlClim dataset resampled to 0.5° by 0.5° grid (left); then overlapping of grid points from the two datasets, extraction of comparison table and creation of plots (right).
Fig. 4
Fig. 4
Comparison of 19 common indicators between WorldClim2.0 (x-axis) and CMCC-BioClimInd (y-axis).
Fig. 5
Fig. 5
Maps of differences calculated as CMCC-BioClimInd minus WorldClim2.0. Absolute difference ( °C) for Bio1 (left) and percentage difference for Bio12 (right).

References

    1. Walther G, et al. Ecological responses to recent climate change. Nature. 2011;416:389–395. doi: 10.1038/416389a. - DOI - PubMed
    1. Ehrlén J, Morris FM. Predicting changes in the distribution and abundance of species under environmental change. Ecology Letters. 2015;18:303–314. doi: 10.1111/ele.12410. - DOI - PMC - PubMed
    1. Valiente-Banuet A, et al. Beyond species loss: the extinction of ecological interactions in a changing world. Functional Ecology. 2015;29:299–307. doi: 10.1111/1365-2435.12356. - DOI
    1. The Intergovernamental Panel on Climate Change - IPCC Special Report on Climate Change and Land (2019).
    1. Ancillotto L, Santini L, Ranc N, Maiorano L, Russo D. Extraordinary range expansion in a common bat: the potential roles of climate change and urbanisation. The Science of Nature. 2016;103:15. doi: 10.1007/s00114-016-1334-7. - DOI - PubMed

Substances