. 2020 Nov 16;10(1):19834.
doi: 10.1038/s41598-020-76224-w.

Platycodin D enhances LDLR expression and LDL uptake via down-regulation of IDOL mRNA in hepatic cells

Affiliations

Platycodin D enhances LDLR expression and LDL uptake via down-regulation of IDOL mRNA in hepatic cells

Yu-Jeong Choi et al. Sci Rep. .

Abstract

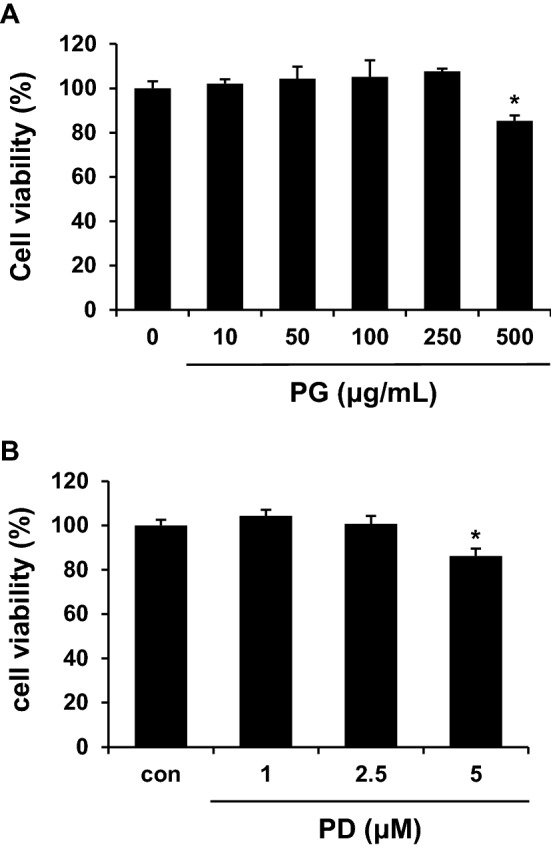
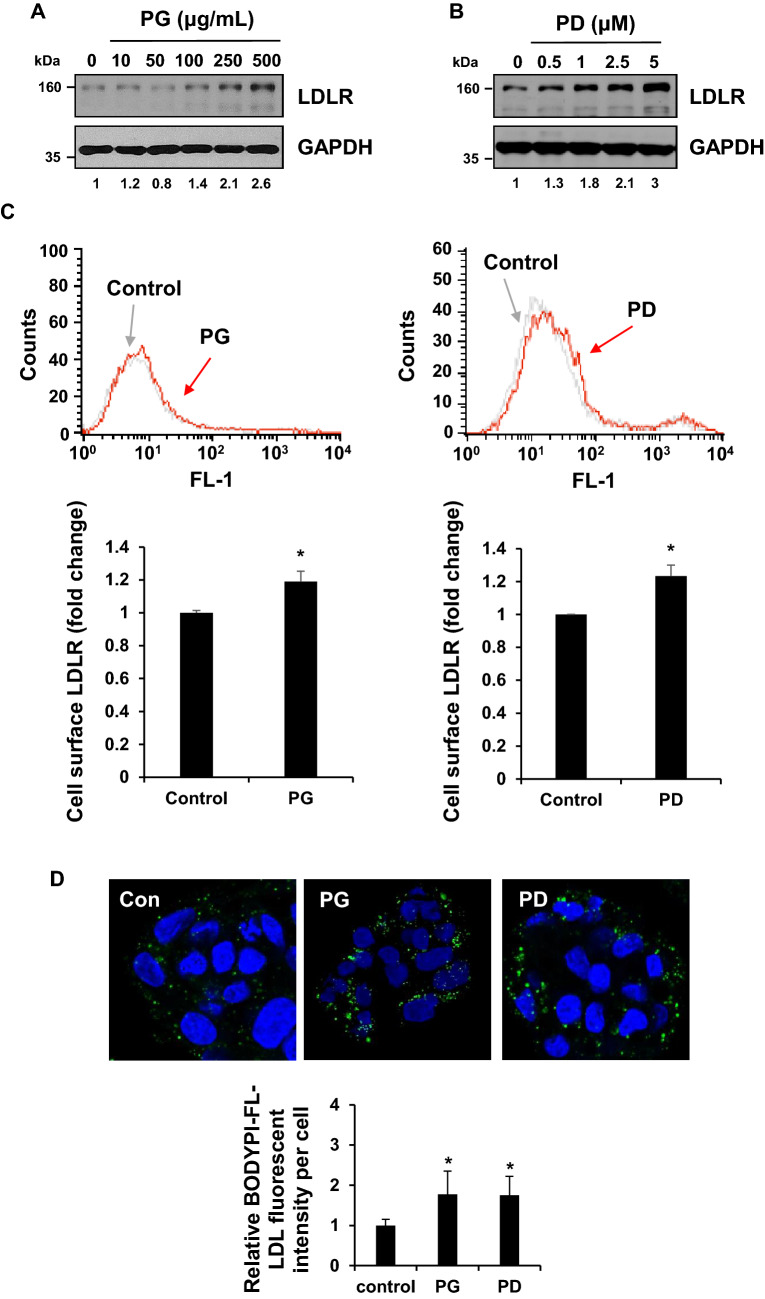
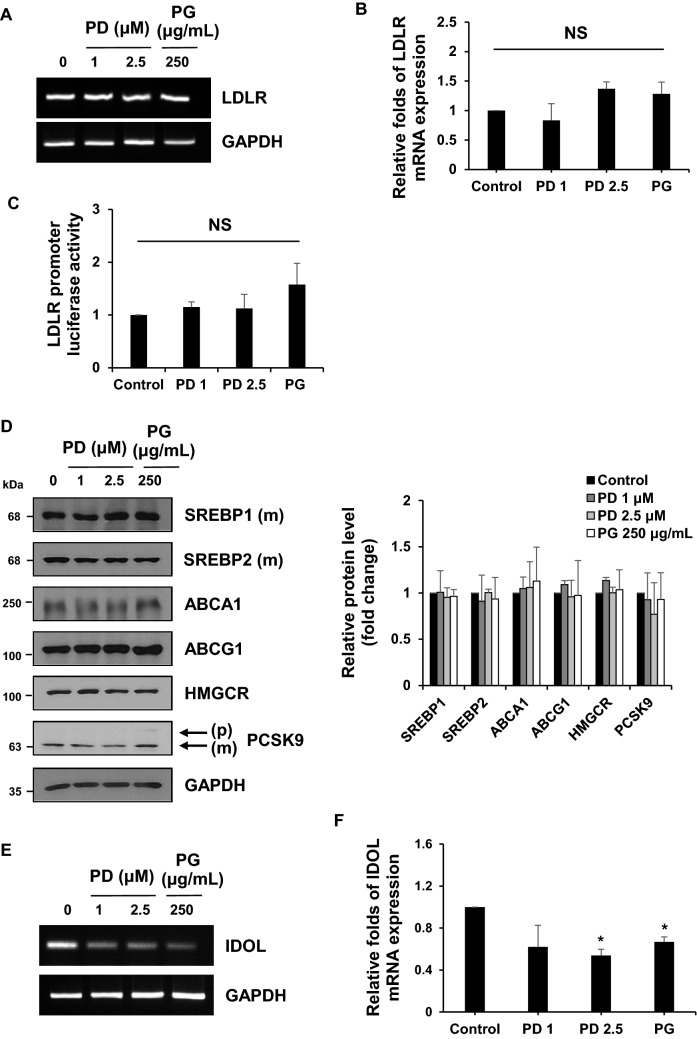
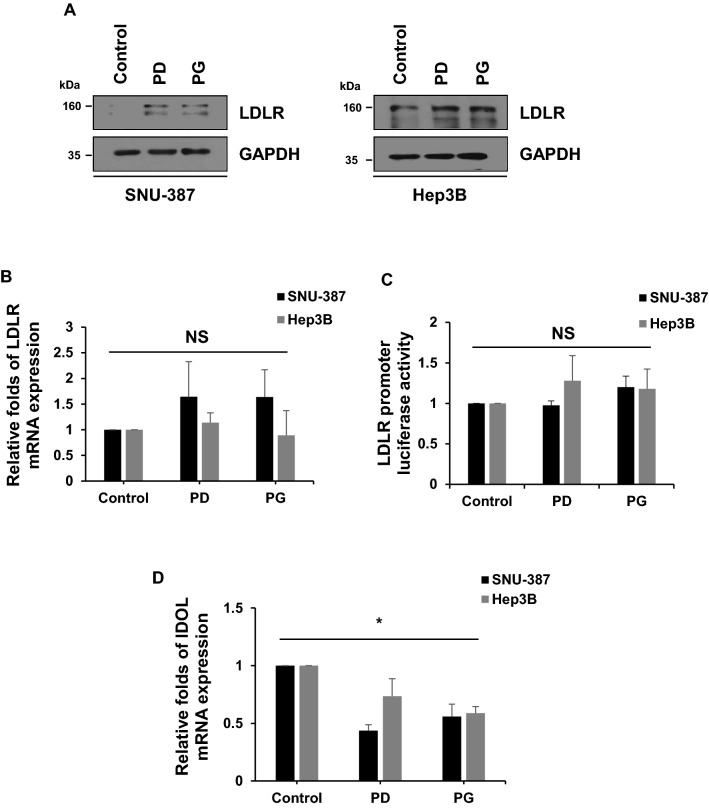
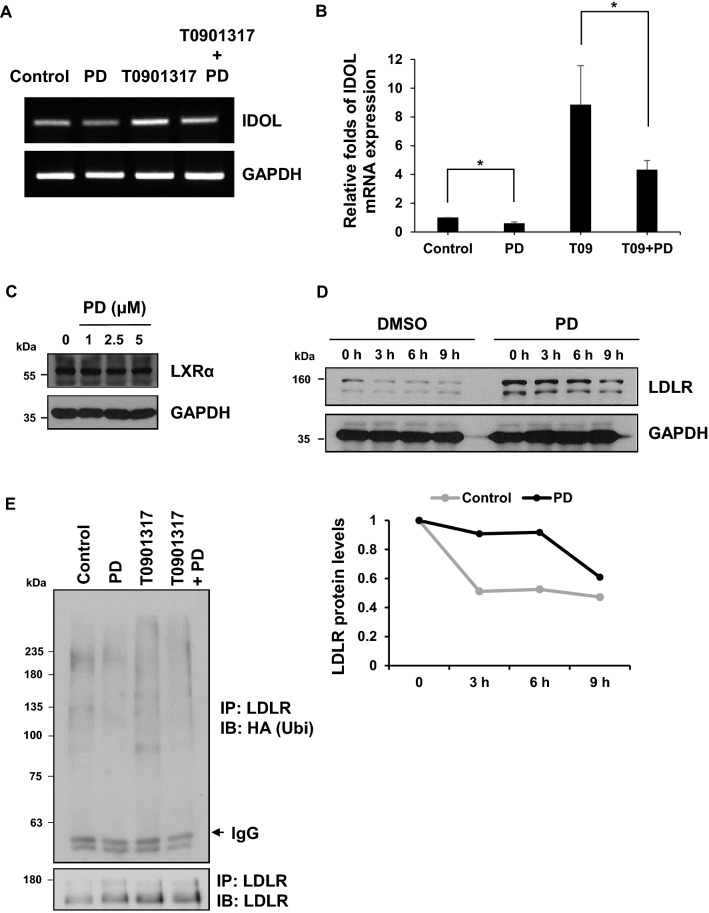
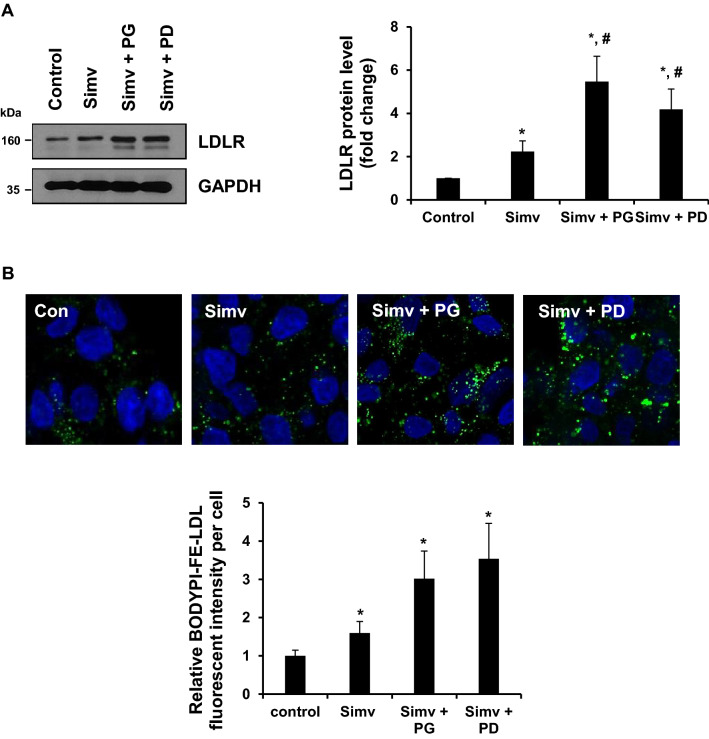
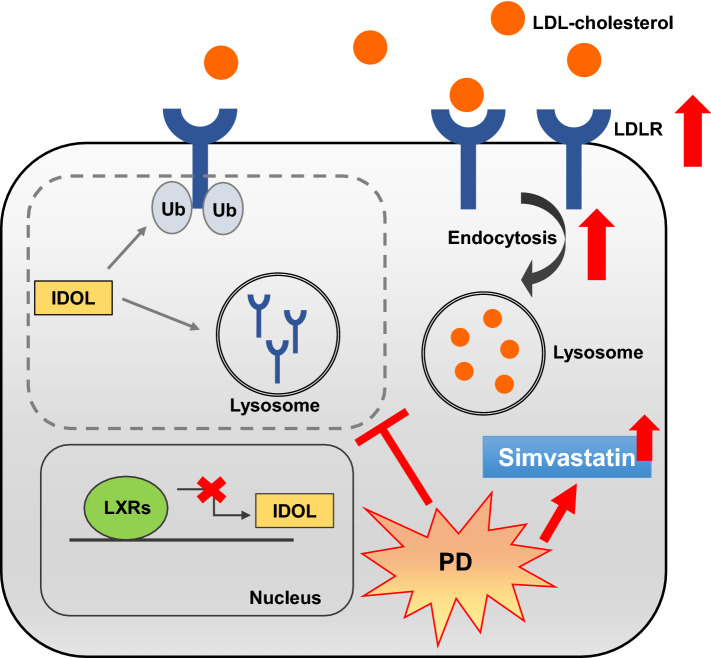
The root of Platycodon grandiflorum (PG) has long been used as a traditional herbal medicine in Asian country. Platycondin D (PD), triterpenoid saponin that is a main constituent of PG, exhibits various biological activities such as anti-inflammatory, anti-oxidant, anti-diabetic, and anti-cancer effects. A previous study showed that PD had cholesterol-lowering effects in mice that develop hypercholesterolemia, but the underlying molecular mechanisms have not been elucidated during the last decade. Here, we demonstrated that both PG and PD markedly increased levels of cell surface low-density lipoprotein receptor (LDLR) by down-regulation of the E3 ubiquitin ligase named inducible degrader of the LDLR (IDOL) mRNA, leading to the enhanced uptake of LDL-derived cholesterol (LDL-C) in hepatic cells. Furthermore, cycloheximide chase analysis and in vivo ubiquitination assay revealed that PD increased the half-life of LDLR protein by reducing IDOL-mediated LDLR ubiquitination. Finally, we demonstrated that treatment of HepG2 cells with simvastatin in combination with PG and PD had synergistic effects on the improvement of LDLR expression and LDL-C uptake. Together, these results provide the first molecular evidence for anti-hypercholesterolemic activity of PD and suggest that PD alone or together with statin could be a potential therapeutic option in the treatment of atherosclerotic cardiovascular disease.


Conflict of interest statement

The authors declare no competing interests.

Figures

Figure. 1
Figure. 1
Effects of PG and PD on the viability of HepG2 cells. HepG2 cells were treated with indicated concentrations of PG (A) and PD (B) for 24 h. Cell viability was measured using a WST-8. Data represented as mean ± standard deviation (SD). *P < 0.05 by Student’s t tests.
Figure. 2
Figure. 2
PG and PD induce LDLR expression and LDL-C uptake in HepG2 cells. (A, B) HepG2 cells were treated with indicated concentration of PG or PD for 24 h. Cell lysates were subjected to western blotting with anti-LDLR and anti-GAPDH antibodies. (C) HepG2 cells were treated with 250 μg/ml PG and 2.5 μM PD for 24 h, followed flow cytometry to determine the amount of cell surface LDLR expression. Data were analyzed using CellQuest Pro software version 5.2 and the average fluorescence intensity of LDLR was shown as fold change. Error bar represented the mean ± SD. *P < 0.05 by Student’s t tests. (D) HepG2 cells were treated with 250 μg/ml PG and 2.5 μM PD for 24 h, followed by incubation with 5 μg/mL Bodipy FL dye-labeled LDL for 1 h. The internalization of the fluorescence labeled LDL (green) was imaged using confocal microscopy. DAPI (blue) was used for nuclear DNA staining. Quantification of LDL fluorescence intensity per cells was analyzed using Image J. Bar graph represents the mean ± SD. *P < 0.05 by one-way ANOVA with Tukey’s post hoc test.
Figure 3
Figure 3
PG and PD inhibit IDOL transcription but not LDLR transcription and promoter activity in HepG2 cells. (A, B, E, F) HepG2 cells were treated with 250 μg/mL PG and 1, 2.5 μM PD for 24 h. RT-PCR and Real-time PCR assay were performed to measure the expression of LDLR mRNA (A, B) or IDOL mRNA (E, F). GAPDH was used as a reference gene for quantification analysis. Quantitative real-time PCR represent the mean ± SD from three independent experiments. *P < 0.05 by one-way ANOVA with Tukey’s post hoc test. NS not significant. (C) HepG2 cells were cotransfected with the pRL-TK vector and pLDLR-Luc plasmid. The cells were re-seeded in 12-well plate and treated with PG (250 μg/mL) or PD (1, 2.5 μM) for 24 h. The luciferase activities were measured and normalized with the respective Renilla activity. The data represent the mean ± SD of independent experiments. NS not significant. (D) After treatment of HepG2 cells with 250 μg/mL PG and 1, 2.5 μM PD for 24 h, cell lysates were subjected to western blotting with the indicated antibodies. The figure shows a representative western blot. The intensity of each protein bands from western blotting were determined by Image J software and normalized to that of GAPDH control. Bar graph shows the mean ± SD from three independent experiments.
Figure 4
Figure 4
PG and PD increase LDLR protein levels by inactivation of IDOL mRNA in hepatic cell lines. (A) SNU-387 and Hep3B cells were treated with 2.5 μM PD and 250 μg/mL PG for 24 h. Cell lysates were analyzed by western blotting with anti-LDLR and anti-GAPDH antibodies. (C) Hepatic cells were co-transfected with and pLDLR-Luc and pRL-TK vector for 24 h followed by treatment with 2.5 μM PD and 250 μg/mL PG for 24 h. Luciferase activity was measured and normalized by Renilla luciferase expression. (B, D) Hepatic cells were treated with 2.5 μM PD and 250 μg/mL PG for 24 h. LDLR (B) and IDOL (D) mRNA expression was analyzed by real-time PCR. The data represent mean ± SD of three independent experiments. *P < 0.05 by one-way ANOVA with Tukey’s post hoc test.
Figure 5
Figure 5
PD increases LDLR half-life by blocking LXR-induced IDOL expression. (A, B) HepG2 cells were treated with 10 μM T0901317 with or without 2.5 μM PD for 24 h. RT-PCR and Real-time PCR assay were performed to measure the mRNA levels of IDOL and GAPDH loading control. The IDOL mRNA expression levels represent the mean ± SD from three independent experiments. *P < 0.05 by one-way ANOVA with Tukey’s post hoc test. (C) HepG2 cells were treated with the indicated concentration of PD for 24 h. Western blot analysis was performed to determine the protein levels of LXRα and GAPDH from the cell lysates. (D) HepG2 cells were treated with either DMSO or 2.5 μM PD for 24 h and then added with 100 μg/mL CHX for the indicated time. LDLR protein was detected by western blotting and the intensity of LDLR protein was determined using Image J software and normalized to that of GAPDH control. (E) HepG2 cells were transfected with HA-ubiquitin plasmids (1 μg). The cells were treated with 2.5 μM PD or 10 μM T0901317 for 18 h and 50 nM Baf A1 for 6 h before being lysed. Cell lysates were immunoprecipitated with anti-LDLR and ubiquitinated LDLR was analyzed by immunoblotting as indicated.
Figure 6
Figure 6
The synergistic effect of PG or PD with simvastatin to enhance LDLR expression and LDL-C uptake. (A) HepG2 cells were treated with 1 μM simvastatin with or without 250 μg/mL PG and 2.5 μM PD for 24 h. Cell lysates were subjected to western blotting with anti-LDLR and anti-GAPDH antibodies. The intensity of LDLR protein was measured using Image J software and normalized to that of GAPDH control. Bar graph shows the mean ± SD from three independent experiments. *P < 0.05 by one-way ANOVA with Tukey’s post hoc test. (B) HepG2 cells were treated with 1 μM simvastatin with or without 250 μg/mL PG and 2.5 μM PD for 24 h, followed by incubation with 5 μg/mL Bodipy FL dye-labeled LDL for 1 h and confocal microscopic imaging. Quantification of LDL fluorescence intensity per cells was analyzed using Image J software. DAPI (blue) was used for nuclear DNA staining. Bar graph represents the mean ± SD. *P < 0.05 by one-way ANOVA with Tukey’s post hoc test.
Figure 7
Figure 7
Schematic model for the hypocholesterolemica action of PD. PD enhances LDL-C uptake via increasing hepatic LDLR protein stability through inhibiting LXR-IDOL pathway. Furthermore, co-treatment of PD with simvastatin enhances their cholesterol-lowering effect.

References

    1. Krause MR, Regen SL. The structural role of cholesterol in cell membranes: from condensed bilayers to lipid rafts. Acc. Chem. Res. 2014;47:3512–3521. doi: 10.1021/ar500260t. - DOI - PubMed
    1. Staels B, Fonseca VA. Bile acids and metabolic regulation: mechanisms and clinical responses to bile acid sequestration. Diabetes Care. 2009;32(Suppl 2):S237–245. doi: 10.2337/dc09-S355. - DOI - PMC - PubMed
    1. Daniels TF, Killinger KM, Michal JJ, Wright RW, Jr, Jiang Z. Lipoproteins, cholesterol homeostasis and cardiac health. Int. J. Biol. Sci. 2009;5:474–488. doi: 10.7150/ijbs.5.474. - DOI - PMC - PubMed
    1. Mourao PA, Bracamonte CA. The binding of human aortic glycosaminoglycans and proteoglycans to plasma low density lipoproteins. Atherosclerosis. 1984;50:133–146. doi: 10.1016/0021-9150(84)90017-0. - DOI - PubMed
    1. Willnow TE, Hammes A, Eaton S. Lipoproteins and their receptors in embryonic development: more than cholesterol clearance. Development. 2007;134:3239–3249. doi: 10.1242/dev.004408. - DOI - PubMed

Publication types