. 2020 Nov 16;11(1):5807.
doi: 10.1038/s41467-020-19668-y.

AdipoR1/AdipoR2 dual agonist recovers nonalcoholic steatohepatitis and related fibrosis via endoplasmic reticulum-mitochondria axis

Affiliations

AdipoR1/AdipoR2 dual agonist recovers nonalcoholic steatohepatitis and related fibrosis via endoplasmic reticulum-mitochondria axis

Hongjiao Xu et al. Nat Commun. .

Erratum in

Abstract

Chronic nonalcoholic steatohepatitis (NASH) is a metabolic disorder that often leads to liver fibrosis, a condition with limited therapy options. Adiponectin is an adipocytokine that regulates glucose and lipid metabolism via binding to its receptors AdipoR1 and AdipoR2, and AdipoRs signaling is reported to enhance fatty acid oxidation and glucose uptake. Here, we synthesize and report an adiponectin-based agonist JT003, which potently improves insulin resistance in high fat diet induced NASH mice and suppresses hepatic stellate cells (HSCs) activation in CCl4 induced liver fibrosis. Mechanistic studies indicate that JT003 simultaneously stimulates AdipoR1- and AdipoR2- mediated signaling pathways as well as the PI3K-Akt pathway. Moreover, JT003 treatment significantly improves ER-mitochondrial axis function, which contributes to the reduced HSCs activation. Thus, the AdipoR1/AdipoR2 dual agonist improves both NASH and fibrosis in mice models, which provides the pharmacological and biological foundation for developing AdipoRs-based therapeutic agents on liver fibrosis.


Conflict of interest statement

The authors declare no competing interests.

Figures
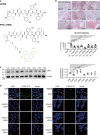
Fig. 1
Fig. 1. Peptides design and activity study.
a Chemical structures of JT003 and FITC-JT003. b Oil Red o staining of PA induced lipid accumulation in HepG2 cell line after treated with 200 μM peptides. Triplicates were performed. c Western blotting for αSMA expression in LX2 after peptides treated. Three separated experiments were performed. αSMA expression was normalized to that of GAPDH. Positive areas were analyzed with ImageJ. d HepG2 and LX2 cells were incubated with FITC-JT003 at 37 °C for 2 or 4 h. The nucleus was stained with Hochest33342. The green channel represents as FITC. For each experiment, triplicates were performed. For in vitro experiment, the concentration of JT003 is 200 μM. Here and later, for each assay, three separated experiments were performed. And for each experiment (n = 4 cell samples/group or n = 6 mice/group). For the in vivo experiment, the dose of JT003 is 500 μg kg−1. All the above data are presented as mean values ± SEM using unpaired Student’s t test. Source data are provided as a Source Data file.
Fig. 2
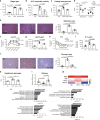
Fig. 2. JT003 ameliorates obesity and insulin resistance of HFD-induced NASH.
a, b Weight gain and serum ALT activity of mice treated with SD, HFD or HFD plus JT003 therapy. c, d Fasting blood glucose levels were recorded, fasting insulin and fasting adiponectin were measured by enzyme-linked immunosorbent assay (ELISA) in serum of mice treated with SD, HFD or HFD plus JT003 therapy. e Representative images of HE staining of liver sections on mice of indicated groups (red arrow represents the inflammation area; red circle represents the ballooning area) and steatosis area. Positive areas were analyzed with ImageJ. f–i Oral glucose tolerance test (OGTT) and insulin tolerance test (ITT) were performed at the 14th or 15th week of food administered, respectively. The corresponding area under curves (AUC) of blood glucose levels were calculated. j Representative images of periodic acid-schiff (PAS) staining on mice of indicated groups (red circle represents the glycogen area) and statistical glycogen area. The glycogen content (k) and the mRNA level of G6Pase (l) were measured in the liver samples of mice treated with SD, HFD or HFD plus JT003 therapy. (m) Genes related to glucose metabolism significantly up-regulated and down-regulated in RNAseq analysis (q < 0.001). n GO and KEGG pathway analysis. Scale bar in pane c applies to all images. Here and later, for each assay, three separated experiments were performed. And for each experiment (n = 4 cell samples/group or n = 6 mice/group). For the in vivo experiment, the dose of JT003 is 500 μg kg−1. All the above data are presented as mean values +/− SEM using unpaired Student’s t test. Source data are provided as a Source Data file.
Fig. 3
Fig. 3. JT003 improves lipid metabolism via AMPK, PPARα and PI3K-Akt-PPARγ pathways.
a, b Quantitative RT-PCR assay was performed to determine mRNA expression of genes related to lipogenesis, lipid β-oxidation in HepG2 cells of the indicated groups. PA treated cells were considered as model group, BSA treated cells were negative control group. c Genes related to AMPK and PI3K-Akt signal pathways significantly up-regulated and down-regulated in RNAseq analysis on mice treated with SD, HFD or HFD plus JT003 therapy (q < 0.001). d Representative images of oil red o staining of liver sections on mice treated with SD, HFD or HFD plus JT003 therapy (yellow circle represents the lipid droplets). Positive areas were analyzed with ImageJ. eg Hepatic TG, serun FFA and LDL-C content of mice in the indicated groups were measured. h–j mRNA level of genes related to lipogenesis, lipid β-oxidation, lipid uptake and cholesterol synthesis in liver samples of the indicated groups. k The expression level of key protein PPARα, AMPK/pAMPK in the liver of the indicated groups. Here and later, unless otherwise indicated, the quantifications of protein expression level were performed using three independent western blotting experiments. Proteins expression were normalized to that of GAPDH. l The expression level of key proteins PI3K/pPI3K, Akt/pAkt and PPARγ in PI3K-Akt signaling. For in vitro experiment, the concentration of JT003 is 200 μM. For the in vivo experiment, the dose of JT003 is 500 μg kg−1. Here and later, for each assay, three separated experiments were performed. And for each experiment (n = 4 cell samples/group or n = 6 mice/group). For the in vivo experiment, the dose of JT003 is 500 μg kg−1. All the above data are presented as mean values ± SEM using unpaired Student’s t test. Source data are provided as a Source Data file.
Fig. 4
Fig. 4. JT003 recovers NASH by ameliorating ER-Mitochondrial axis function.
a Quantitative RT-PCR assay was performed to determine mRNA expression of genes related to ER-mitochondrial axis in HepG2 cells of the indicated groups. b HepG2 cells of the indicated groups were stained with Mito Tracker followed by assessment with mitochondrial content assay. c Genes related to ER-mitochondrial axis which were significantly up-regulated or down-regulated in RNAseq analysis (q < 0.001). d, f mRNA transcription of the genes related to ER stress and mitochondrial function in the liver samples of mice treated with SD, HFD or HFD plus JT003 therapy. e The phosphorylation of PERK, eIF2α and JNK in response to ER-stress. g The expression level of PGC1α and CYP2E1 in the indicated groups. Here and later, for each assay, three separated experiments were performed. And for each experiment (n = 4 cell samples/group or n = 6 mice/group). For the in vivo experiment, the dose of JT003 is 500 μg kg−1. All the above data are presented as mean values ± SEM using unpaired Student’s t test. Source data are provided as a Source Data file.
Fig. 5
Fig. 5. JT003 inhibits the progress of CCl4-induced liver fibrosis.
a, b Representative images of HE staining, sirius red staining and IHC for αSMA and COL1α1 of liver sections and ALT activity on mice treated with Corn Oil, CCl4 or CCl4 plus JT003 therapy. c Western blotting assay of αSMA and COL1α1 measured in liver samples of mice treated with Corn Oil, CCl4 or CCl4 plus JT003 therapy. GAPDH serves as the loading control. d The fibrogenesis-related genes that significantly up-regulated or down-regulated in RNAseq analysis (q < 0.001). e GO and KEGG pathway analysis. For in vitro experiment, the concentration of JT003 is 200 μM. For the in vivo experiment, the dose of JT003 is 500 μg kg−1. Here and later, for each assay, three separated experiments were performed. And for each experiment (n = 4 cell samples/group or n = 6 mice/group). For the in vivo experiment, the dose of JT003 is 500 μg kg−1. All the above data are presented as mean values ± SEM using unpaired Student’s t test. Source data are provided as a Source Data file.
Fig. 6
Fig. 6. JT003 suppressed the activation of HSCs in CCl4-induced liver fibrosis.
a Quantitative RT-PCR assay was performed to determine mRNA transcription of the genes related to ECM accumulation and HSC activation in the indicated groups. b mRNA transcription of the genes related to ECM accumulation and HSC activation in the liver of mice treated with Corn Oil, CCl4 or CCl4 plus JT003 therapy. c The HSC activation related genes which were significantly up-regulated and down-regulated in RNAseq analysis (q < 0.001). d Western blotting assay of total NFκB (P65) and phosphorylated NFκB (pP65) measured in liver samples of mice in the indicated groups. For in vitro experiment, the concentration of JT003 is 200 μM. For the in vivo experiment, the dose of JT003 is 500 μg kg−1. Here and later, for each assay, three separated experiments were performed. And for each experiment (n = 4 cell samples/group or n = 6 mice/group). For the in vivo experiment, the dose of JT003 is 500 μg kg−1. All the above data are presented as mean values ± SEM using unpaired Student’s t test. Source data are provided as a Source Data file.
Fig. 7
Fig. 7. JT003 recovers CCl4-induced liver fibrosis via ER-mitochondrial axis.
a mRNA transcription of the genes related to ER-mitochondrial axis in LX2 cells. b LX2 cells were stained with Mito Tracker followed by assessment with mitochondrial content assay. c ER-mitochondrial axis related genes that significantly up-regulated and down-regulated in RNAseq analysis (q < 0.001). d mRNA transcription of the genes related to ER-stress and mitochondrial function in the liver of mice in the indicated groups. e, f The expression level of key proteins pJNK/JNK, peIF2α/eIF2α, pPERK/PERK, PGC1α and CYP2E1 in response to ER stress and mitochondrial dysfunction. For in vitro experiment, the concentration of JT003 is 200 μM. For the in vivo experiment, the dose of JT003 is 500 μg kg−1. Here and later, for each assay, three separated experiments were performed. And for each experiment (n = 4 cell samples/group or n = 6 mice/group). For the in vivo experiment, the dose of JT003 is 500 μg kg−1. All the above data are presented as mean values ± SEM using unpaired Student’s t test. Source data are provided as a Source Data file.
Fig. 8
Fig. 8. Suppression of AdipoR1/AdipoR2 blocks the downstream pathways activated by JT003.
a–f The mRNA and protein expression level of PPARα and PPARγ in HepG2 (a, b, c) and LX2 cells (d, e, f) of the indicated groups with AdipoR1 and/or AdipoR2 siRNA treatment. g, h Competitive binding of JT003 to globular adiponectin (gAd) AdipoR1 overexpression cells and AdipoR2 overexpression cells. i The Kd value of JT003, JT006 and ADP355 bind to AdipoR1 and AdipoR2 (n = 2/group). j Plasma concentration versus time profiles of ADP355 and JT003 in SD rats following a single intravenous dose of 0.5 mg kg−1 and 1.0 mg kg−1, respectively (n = 3/group). k Scheme of AdipoR1/AdipoR2 dual agonist JT003 in recovering NASH and related fibrosis. JT003 binds to AdipoR1 and AdipoR2, improves glucose and lipid metabolism, suppresses HSCs activation and modulates the ER-mitochondria axis function in the development of NASH and related fibrosis. Here and later, for each assay, three separated experiments were performed. And for each experiment (n = 4 cell samples/group). For the in vivo experiment, the dose of JT003 is 500 μg kg−1. All the above data are presented as mean values ± SEM using unpaired Student’s t test. Source data are provided as a Source Data file.

References

    1. Wesolowski SR, Kasmi KC, Jonscher KR, Friedman JE. Developmental origins of NAFLD: a womb with a clue. Nat. Rev. Gastroenterol. Hepatol. 2017;14:81–96. doi: 10.1038/nrgastro.2016.160. - DOI - PMC - PubMed
    1. Musso G, Cassader M, Gambino R. Non-alcoholic steatohepatitis: emerging molecular targets and therapeutic strategies. Nat. Rev. Drug Discov. 2016;15:249–274. doi: 10.1038/nrd.2015.3. - DOI - PubMed
    1. Friedman SL. Liver fibrosis in 2012: Convergent pathways that cause hepatic fibrosis in NASH. Nat. Rev. Gastroenterol. Hepatol. 2013;10:71–72. doi: 10.1038/nrgastro.2012.256. - DOI - PubMed
    1. Tilg H, Moschen AR. Evolution of inflammation in nonalcoholic fatty liver disease: the multiple parallel hits hypothesis. Hepatology. 2010;52:1836–1846. doi: 10.1002/hep.24001. - DOI - PubMed
    1. Nassir F, Ibdah JA. Role of mitochondria in nonalcoholic fatty liver disease. Int. J. Mol. Sci. 2014;15:8713–8742. doi: 10.3390/ijms15058713. - DOI - PMC - PubMed

Publication types

MeSH terms