. 2020 Nov 16;10(1):19888.
doi: 10.1038/s41598-020-76740-9.

DeepLMS: a deep learning predictive model for supporting online learning in the Covid-19 era

Affiliations

DeepLMS: a deep learning predictive model for supporting online learning in the Covid-19 era

Sofia B Dias et al. Sci Rep. .

Abstract

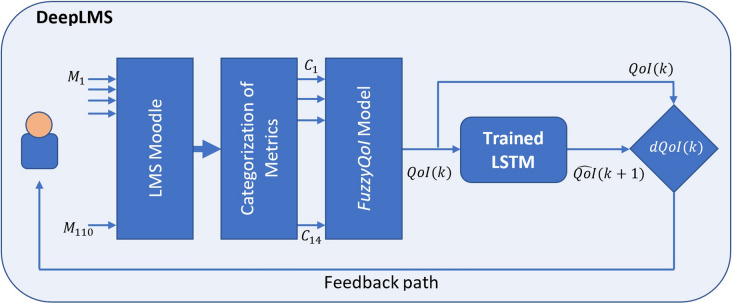
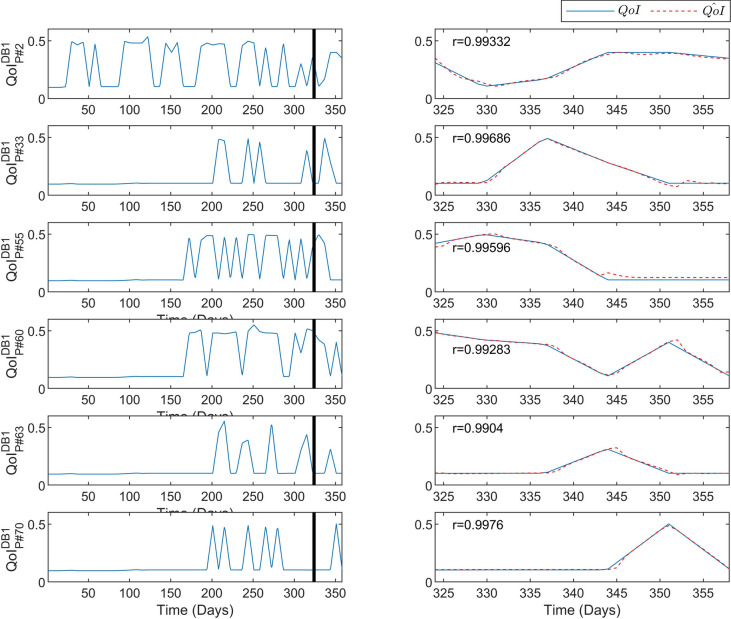
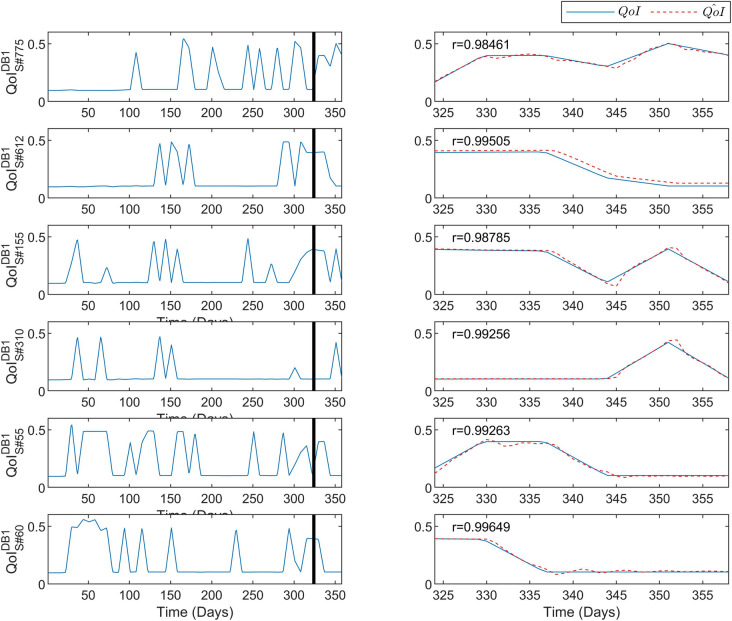
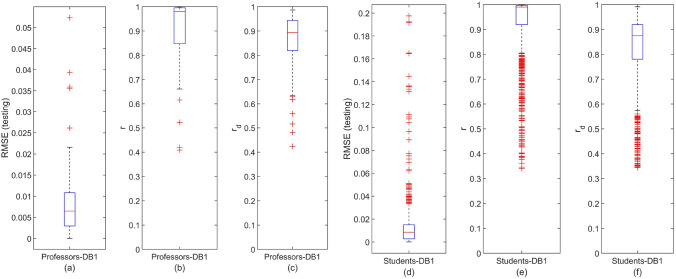
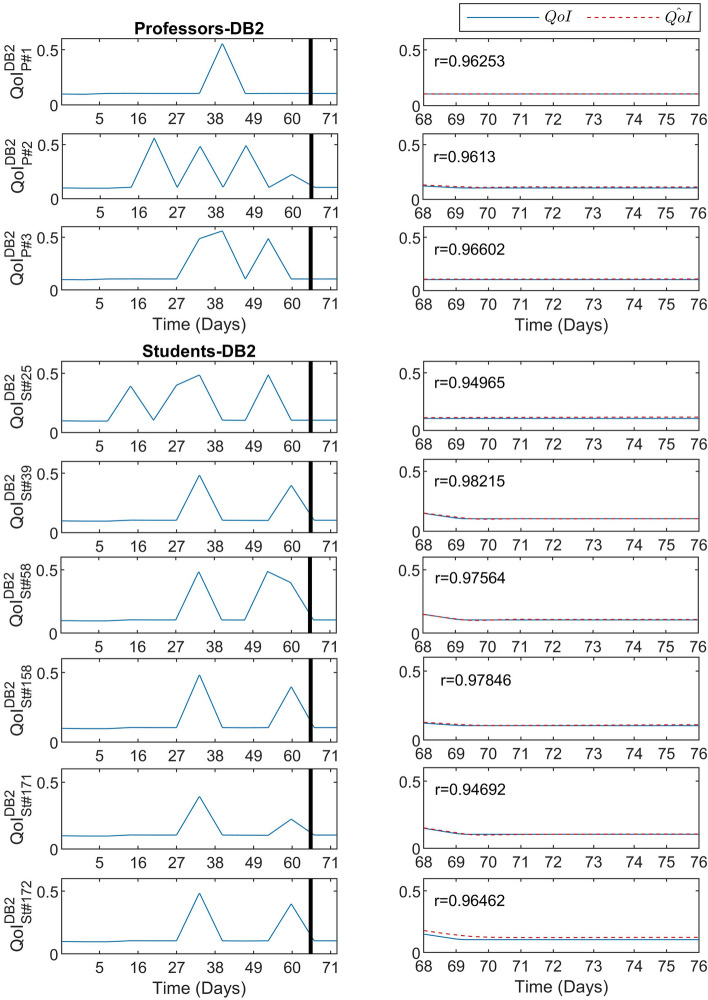
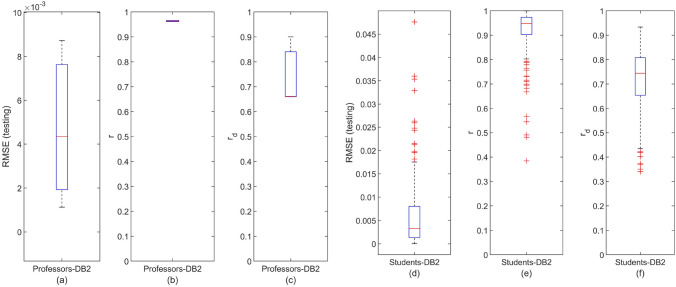
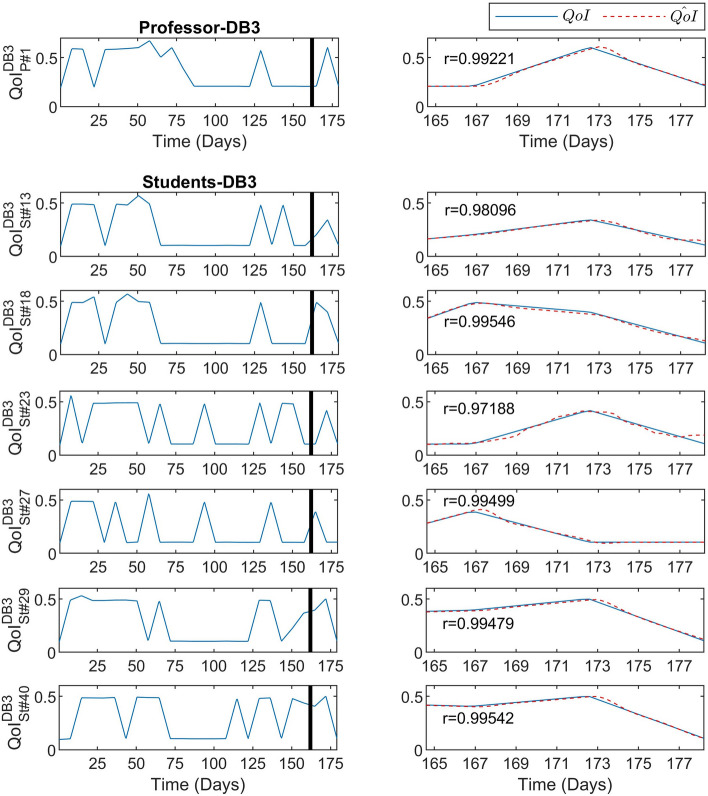
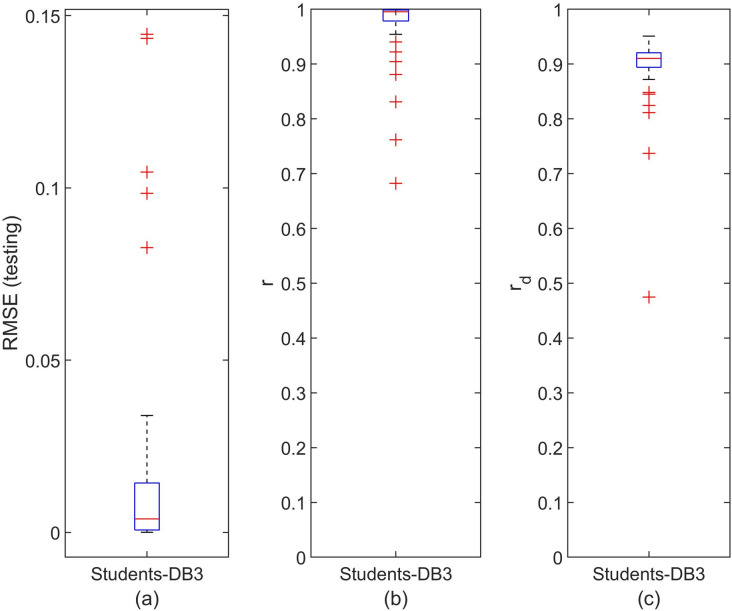
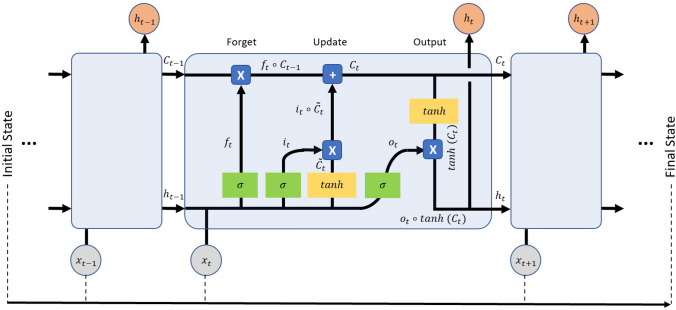
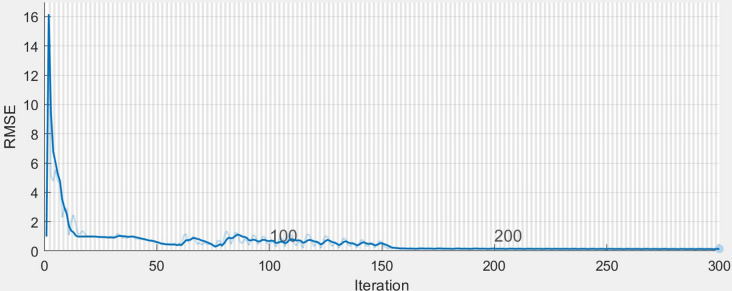
Coronavirus (Covid-19) pandemic has imposed a complete shut-down of face-to-face teaching to universities and schools, forcing a crash course for online learning plans and technology for students and faculty. In the midst of this unprecedented crisis, video conferencing platforms (e.g., Zoom, WebEx, MS Teams) and learning management systems (LMSs), like Moodle, Blackboard and Google Classroom, are being adopted and heavily used as online learning environments (OLEs). However, as such media solely provide the platform for e-interaction, effective methods that can be used to predict the learner's behavior in the OLEs, which should be available as supportive tools to educators and metacognitive triggers to learners. Here we show, for the first time, that Deep Learning techniques can be used to handle LMS users' interaction data and form a novel predictive model, namely DeepLMS, that can forecast the quality of interaction (QoI) with LMS. Using Long Short-Term Memory (LSTM) networks, DeepLMS results in average testing Root Mean Square Error (RMSE) [Formula: see text], and average correlation coefficient between ground truth and predicted QoI values [Formula: see text] [Formula: see text], when tested on QoI data from one database pre- and two ones during-Covid-19 pandemic. DeepLMS personalized QoI forecasting scaffolds user's online learning engagement and provides educators with an evaluation path, additionally to the content-related assessment, enriching the overall view on the learners' motivation and participation in the learning process.


Conflict of interest statement

The authors declare no competing interests.

Figures

Figure 1
Figure 1
The DeepLMS-based QoI prediction concept. A schematic representation of the proposed DeepLMS functionality, with the LMS Moodle user’s interaction metrics (M1,,M110; see Supplementary Table S1) categorized into 14 input parameters (C1,,C14; see Supplementary Table S1) fed to the FuzzyQoI model, outputting the estimated QoI(k) at instance k. The latter is then inputted to the trained LMST network (see “Methods” section) to predict the QoI^(k+1) at instance (k+1). Both QoI(k) and QoI^(k+1) are compared and their difference (dQoI(k)) is used to inform the user’s feedback path.
Figure 2
Figure 2
Predictive performance of the DeepLMS on QoI time series from DB1 Professors. The left column shows the QoI data from DB1 P#2, P#33, P#35, P#60, P#65, and P#70, used for training (from day 1 until day 323 where the vertical solid line lies) and for testing (day 324 until day 358), whereas the right column zooms into the testing QoI data (blue solid line) and the DeepLMS predicted QoI (red dashed line). Moreover, the estimated correlation coefficient r between the testing and the estimated QoI data (see “Methods” section) for each case is also superimposed in the right column plots.
Figure 3
Figure 3
Predictive performance of the DeepLMS on QoI time series from DB1 Students. The left column shows the QoI data from DB1 S#55, S#60, S#155, S#310, S#612, and S#775, used for training (from day 1 until day 323 where the vertical solid line lies) and for testing (day 324 until day 358), whereas the right column zooms into the testing QoI data (blue solid line) and the DeepLMS predicted QoI (red dashed line). Moreover, the estimated correlation coefficient r between the testing and the estimated QoI data (see “Methods” section) for each case is also superimposed in the right column plots.
Figure 4
Figure 4
Distribution of the DeepLMS predictive performance indices across users’ groups of DB1. (a) Box-plot of the distribution of RMSE between the testing and the estimated QoI data for the case of DB1 Professors, (b) box-plot of the distribution of the correlation coefficient r between the testing and the estimated QoI data for the case of DB1 Professors, (c) box-plot of the distribution of the correlation coefficient rd between the derivative of the testing and the derivative of the estimated QoI data for the case of DB1 Professors; (d-f) same as (ac), respectively, yet for the case of DB1 Students. Each box-plot visualises the interquartile range (height of rectangle), spanning the first (bottom) to the third quartile (top), the median value (horizontal red line inside the rectangle), the minimum and maximum values (ends of “whiskers” below and above the box, respectively) still within the interquartile range, and outlier values (individual red crosses below and above “whiskers”). Additional DeepLMS predictive performance indices are tabulated in Table 1.
Figure 5
Figure 5
Predictive performance of the DeepLMS on QoI time series from DB2 Professors and Students. The left column-top panel shows the QoI data from the three DB2 Professors, i.e., P#1, P#2, and P#3, used for training (from day 1 until day 68 where the vertical solid line lies) and for testing (day 69 until day 76), whereas the left column-bottom panel shows the QoI data from excerpts of DB2 Students, i.e., S#25, S#39, S#58, S#158, S#171, and S#172, for the same training and testing periods. The right column (both panels) zooms into the testing QoI data (blue solid line) and the DeepLMS predicted QoI (red dashed line), including also the estimated correlation coefficient r between the testing and the estimated QoI data for each case.
Figure 6
Figure 6
Distribution of the DeepLMS predictive performance indices across users’ groups of DB2. (a) Box-plot of the distribution of RMSE between the testing and the estimated QoI data for the case of DB2 Professors, (b) box-plot of the distribution of the correlation coefficient r between the testing and the estimated QoI data for the case of DB2 Professors, (c) box-plot of the distribution of the correlation coefficient rd between the derivative of the testing and the derivative of the estimated QoI data for the case of DB2 Professors; (df) same as (ac), respectively, yet for the case of DB2 Students. Additional DeepLMS predictive performance indices are tabulated in Table 1.
Figure 7
Figure 7
Predictive performance of the DeepLMS on QoI time series from DB3 Professor and Students. The left column-top panel shows the QoI data from the one DB3 Professor, i.e., P#1, used for training (from day 1 until day 163 where the vertical solid line lies) and for testing (day 164 until day 181), whereas the left column-bottom panel shows the QoI data from excerpts of DB3 Students, i.e., S#13, S#18, S#23, S#27, S#29, and S#40, for the same training and testing periods. The right column (both panels) zooms into the testing QoI data (blue solid line) and the DeepLMS predicted QoI (red dashed line), including also the estimated correlation coefficient r between the testing and the estimated QoI data for each case.
Figure 8
Figure 8
Distribution of the DeepLMS predictive performance indices across the DB3 Students. (a) Box-plot of the distribution of RMSE between the testing and the estimated QoI data for the case of DB3 Students, (b) box-plot of the distribution of the correlation coefficient r between the testing and the estimated QoI data for the case of DB3 Students, (c) box-plot of the distribution of the correlation coefficient rd between the derivative of the testing and the derivative of the estimated QoI data for the case of DB3 Students. Additional DeepLMS predictive performance indices are tabulated in Table 1.
Figure 9
Figure 9
Overview of an LSTM neural processing unit. Structural characteristics of an LSTM unit and its sequence across time. xt is the input data, ht is the hidden state, it, ot, and ft are gates controlling the flow of information, and Ct is the cell state. The x and + operators represent the element-wise product () and summation, respectively, whereas σ denotes the sigmoid function of σ(x)=(1+e-x)-1.
Figure 10
Figure 10
The estimated training RMSE across iterations. An example of the convergence of the estimated training RMSE to values <0.001 across the 300 iterations, when training the proposed LSTM network with data from DB1. The light and thick lines denote the actual and the smoothed values of the estimated training RMSE, respectively.

References

    1. Picard RW, et al. Affective learning-a manifesto. BT Technol. J. 2004;22:253–269. doi: 10.1023/B:BTTJ.0000047603.37042.33. - DOI
    1. Ponce OA, Gómez J, Pagán N. Current scientific research in the humanities and social sciences: central issues in educational research. Eur. J. Sci. Theol. 2019;15:81–95.
    1. Alexander, B. et al. EDUCAUSE Horizon Report 2019 Higher Education Edition. Tech. Rep., EDU19 (2019).
    1. Anderson T. The Theory and Practice of Online Learning. Edmonton: Athabasca University Press; 2008.
    1. Panigrahi R, Srivastava PR, Sharma D. Online learning: adoption, continuance, and learning outcome—a review of literature. Int. J. Inf. Manag. 2018;43:1–14. doi: 10.1016/j.ijinfomgt.2018.05.005. - DOI