. 2020 Nov 16;10(1):19930.
doi: 10.1038/s41598-020-76959-6.

Transcriptional signatures of the small intestinal mucosa in response to ethanol in transgenic mice rich in endogenous n3 fatty acids

Affiliations

Transcriptional signatures of the small intestinal mucosa in response to ethanol in transgenic mice rich in endogenous n3 fatty acids

Josiah E Hardesty et al. Sci Rep. .

Abstract

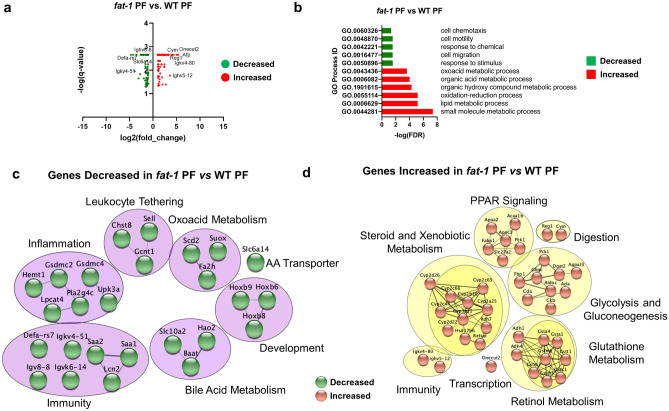
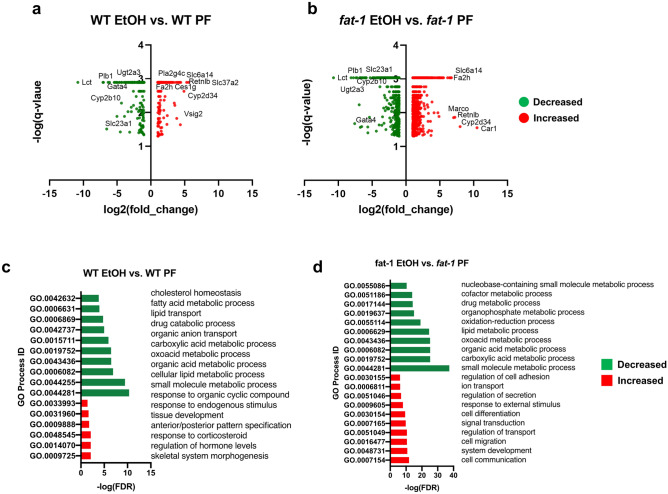
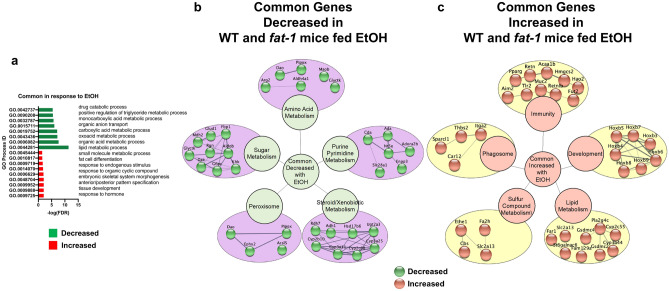
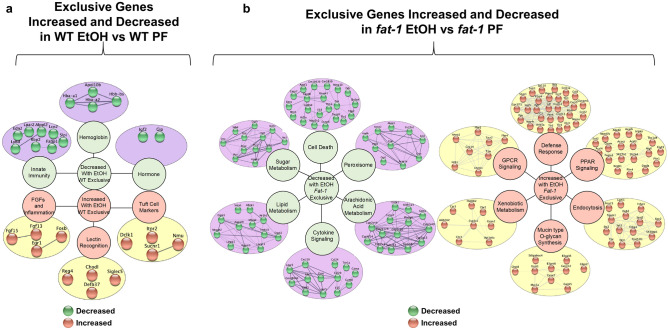
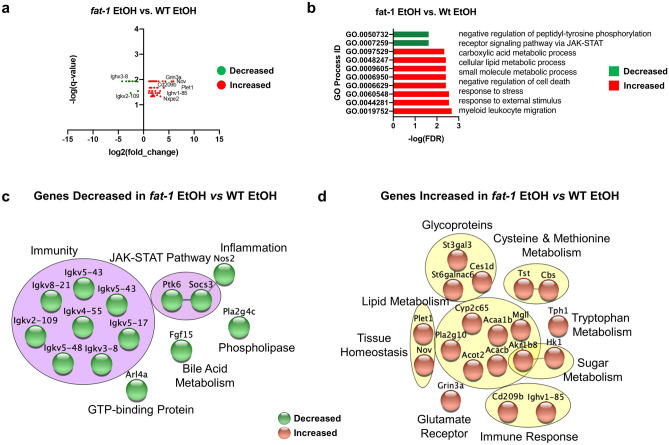
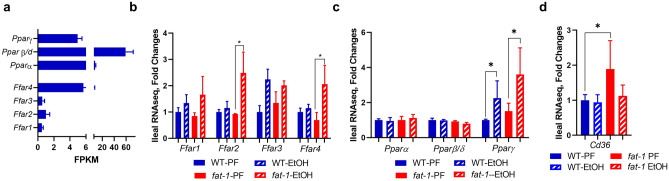
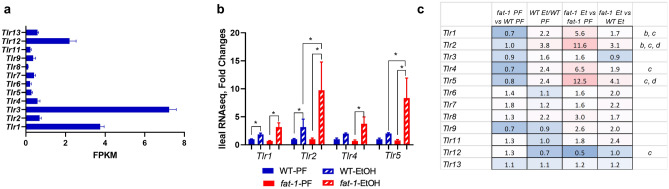
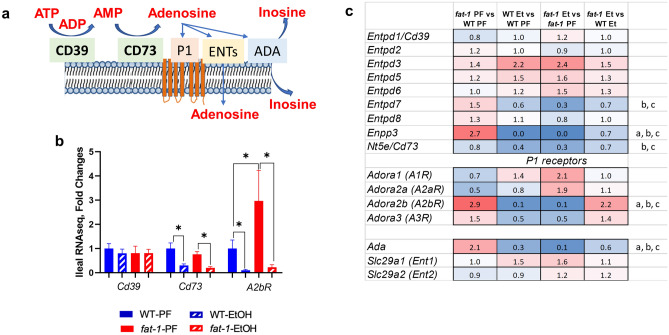
The intestine interacts with many factors, including dietary components and ethanol (EtOH), which can impact intestinal health. Previous studies showed that different types of dietary fats can modulate EtOH-induced changes in the intestine; however, mechanisms underlying these effects are not completely understood. Here, we examined intestinal transcriptional responses to EtOH in WT and transgenic fat-1 mice (which endogenously convert n6 to n3 polyunsaturated fatty acids [PUFAs]) to identify novel genes and pathways involved in EtOH-associated gut pathology and discern the impact of n3 PUFA enrichment. WT and fat-1 mice were chronically fed EtOH, and ileum RNA-seq and bioinformatic analyses were performed. EtOH consumption led to a marked down-regulation of genes encoding digestive and xenobiotic-metabolizing enzymes, and transcription factors involved in developmental processes and tissue regeneration. Compared to WT, fat-1 mice exhibited a markedly plastic transcriptome response to EtOH. Cell death, inflammation, and tuft cell markers were downregulated in fat-1 mice in response to EtOH, while defense responses and PPAR signaling were upregulated. This transcriptional reprogramming may contribute to the beneficial effects of n3 PUFAs on EtOH-induced intestinal pathology. In summary, our study provides a reference dataset of the intestinal mucosa transcriptional responses to chronic EtOH exposure for future hypothesis-driven mechanistic studies.


Conflict of interest statement

The authors declare no competing interests.

Figures

Figure 1
Figure 1
Differentially expressed genes between fat-1 and WT control pair-fed animals. (a) Volcano plot analysis of significant genes from the fat-1 PF vs WT PF comparison. Genes are plotted as log2(fold change) vs antilog(p-value). (b) GO Processes representative of decreased gene expression (green) and increased gene expression (red) for the fat-1 PF vs WT PF comparison. (c) Gene cluster analysis of genes decreased in fat-1 PF vs WT PF comparison (purple circles, green nodes). (d) Gene cluster analysis of genes increased in fat-1 PF vs WT PF comparison (yellow circles, copper nodes). Significant DEGs were selected based on a q-value < 0.05. Significant DEGs with fold-change greater than or equal to two-fold were used for analyses in (ad). n = 3–5 mice per group.
Figure 2
Figure 2
Changes in intestinal transcriptional responses to EtOH in WT and fat-1 mice. (a) Volcano plot analysis of significant genes from the WT EtOH vs WT PF comparison plotted as log2(fold change) vs antilog(p-value) for individual genes. (b) Volcano plot analysis for the fat-1 EtOH vs fat-1 PF comparison plotted as log2(fold change) vs antilog(p-value) for individual genes. (c) GO Process analysis representative of genes decreased in expression (green) and genes increased in expression (red) for the WT EtOH vs WT PF comparison. (d) GO Process analysis representative of genes decreased in expression (green) and genes increased in expression (red) for the fat-1 EtOH vs fat-1 PF comparison. Significant DEGs that met a two-fold threshold were used for the analyses in (ad). n = 3–5 mice per group.
Figure 3
Figure 3
Similarity in transcriptional responses of ileum tissue to EtOH in WT and fat-1 mice. (a) GO Process analysis representative of genes decreased in expression (green) and genes increased in expression (red) that were shared between genotypes in response to EtOH. (b) Gene cluster analysis of genes shared between genotypes that were decreased in response to EtOH (purple circles, green nodes). (c) Gene cluster analysis of genes shared between genotypes that were increased in response to EtOH (yellow circles, copper nodes). Significant DEGs that met a two-fold change threshold were used for the analyses in (ac). n = 3–5 mice per group.
Figure 4
Figure 4
Genotype exclusive transcriptional responses to EtOH in WT and fat-1 mice. (a) Cluster analysis of genes exclusively decreased (purple circles, green nodes) or increased in response to EtOH in WT mice (yellow circles, copper nodes). (b) Cluster analysis of genes exclusively decreased (purple circles, green nodes) or increased in response to EtOH in fat-1 mice (yellow circle, copper nodes). Significant DEGs that met a two-fold change threshold were used for the analyses in (a,b). n = 3–5 mice per group.
Figure 5
Figure 5
Differential transcriptional responses in fat-1 EtOH vs WT EtOH mice. (a) Volcano plot analysis of significant genes from the fat-1 EtOH vs WT EtOH comparison plotted as log2(fold change) vs. log(p-value) for individual genes. (b) GO Process analysis representative of genes decreased in expression (green) and genes increased in expression (red) from the fat-1 EtOH vs WT EtOH comparison. (c) Gene cluster analysis of genes decreased in the fat-1 EtOH vs WT EtOH comparison (purple circles, green nodes). (d) Gene cluster analysis of genes increased in the fat-1 EtOH vs WT EtOH comparison (yellow circles, copper nodes). Significant DEGs that met a two-fold change threshold were used for the analyses in (ad). n = 3–5 mice per group.
Figure 6
Figure 6
Expression of free fatty acid receptors in fat-1 vs WT mice. (a) Relative gene expression of FFA receptors (Ppars and Ffars) in ileal mucosa from WT PF mice. (b) Gene expression of Ffars in ileal mucosa among all treatment groups. (c) Gene expression of Ppars in ileal mucosa among all treatment groups. (d) Gene expression of Cd36 in ileal mucosa among all treatment groups. Data are presented as mean ± SEM for FPKM (a) and fold changes (bd). *p < 0.05. n = 3–5 mice per group.
Figure 7
Figure 7
Changes in the expression of microbial sensing genes in WT and fat-1 mice exposed to EtOH. (a) Relative gene expression of Tlr genes in ileal mucosa from WT PF mice. Data are presented as mean ± SEM for FPKM. (b) Gene expression of Tlr genes in ileal mucosa from all treatment groups. Data are expressed as fold changes vs WT PF set as 1, * p < 0.05. (c) Heatmap analysis of ileal mucosa Tlr genes across multiple comparisons. Data are expressed as fold changes for indicated groups. Significance for the fat-1 PF vs WT PF comparison is denoted by (a), for the WT EtOH vs WT PF (b), for fat-1 EtOH vs fat-1 PF (c), and for fat-1 EtOH vs WT EtOH (d). n = 3–5 mice per group.
Figure 8
Figure 8
Effects of EtOH on the expression of intestinal genes involved in adenosine signaling in WT and fat-1 mice. (a) Schematic of the adenosine signaling pathway. (b) Gene expression of Cd39, Cd73, and A2bR in ileal mucosa from all treatment groups. Data are expressed as fold changes vs WT PF set as 1, *p < 0.05. (c) Heatmap analysis of adenosine signaling genes in ileal mucosa across multiple comparisons. Data are expressed as fold changes for indicated groups. Significance for the fat-1 PF vs WT PF comparison is denoted by (a), for the WT EtOH vs WT PF (b), for fat-1 EtOH vs fat-1 PF (c), and for fat-1 EtOH vs WT EtOH (d). n = 3–5 mice per group.

Similar articles

Cited by

References

    1. Francescangeli F, De Angelis ML, Zeuner A. Dietary factors in the control of gut homeostasis, intestinal stem cells, and colorectal cancer. Nutrients. 2019;11:2936. doi: 10.3390/nu11122936. - DOI - PMC - PubMed
    1. Sugihara K, Morhardt TL, Kamada N. The role of dietary nutrients in inflammatory bowel disease. Front. Immunol. 2018;9:3183. doi: 10.3389/fimmu.2018.03183. - DOI - PMC - PubMed
    1. Spencer SP, Belkaid Y. Dietary and commensal derived nutrients: shaping mucosal and systemic immunity. Curr. Opin. Immunol. 2012;24:379–384. doi: 10.1016/j.coi.2012.07.006. - DOI - PMC - PubMed
    1. Kaliannan K, et al. Multi-omic analysis in transgenic mice implicates omega-6/omega-3 fatty acid imbalance as a risk factor for chronic disease. Commun. Biol. 2019;2:276. doi: 10.1038/s42003-019-0521-4. - DOI - PMC - PubMed
    1. Simopoulos AP. An increase in the omega-6/omega-3 fatty acid ratio increases the risk for obesity. Nutrients. 2016;8:128. doi: 10.3390/nu8030128. - DOI - PMC - PubMed

Publication types