. 2021 Apr;15(4):981-998.
doi: 10.1038/s41396-020-00825-6. Epub 2020 Nov 16.

Potential virus-mediated nitrogen cycling in oxygen-depleted oceanic waters

Affiliations

Potential virus-mediated nitrogen cycling in oxygen-depleted oceanic waters

M Consuelo Gazitúa et al. ISME J. 2021 Apr.

Abstract

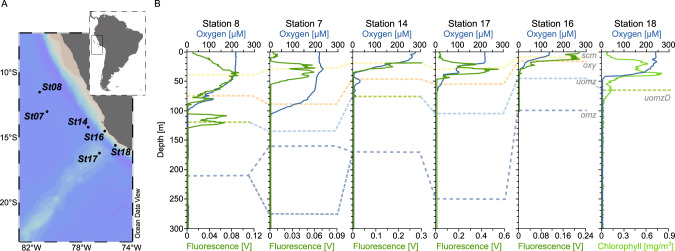
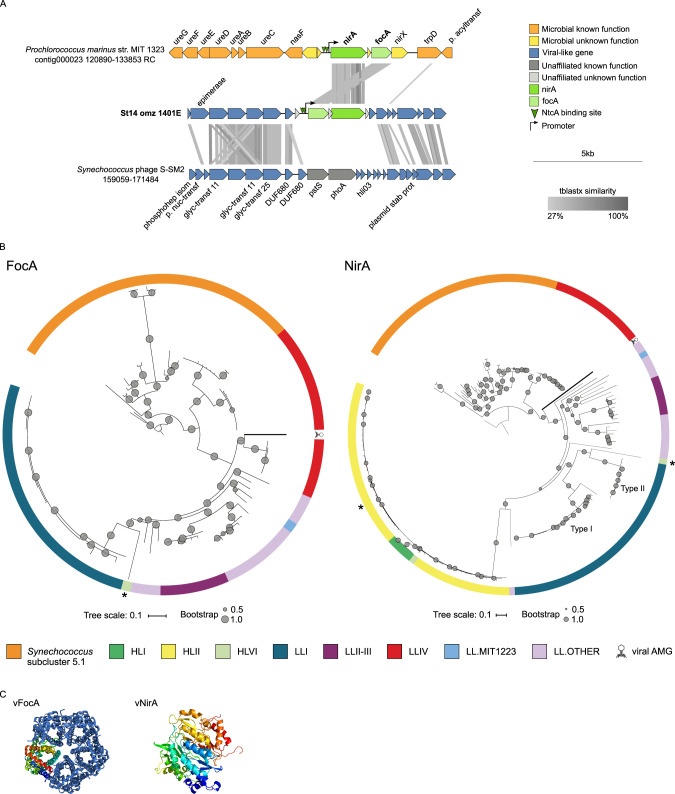
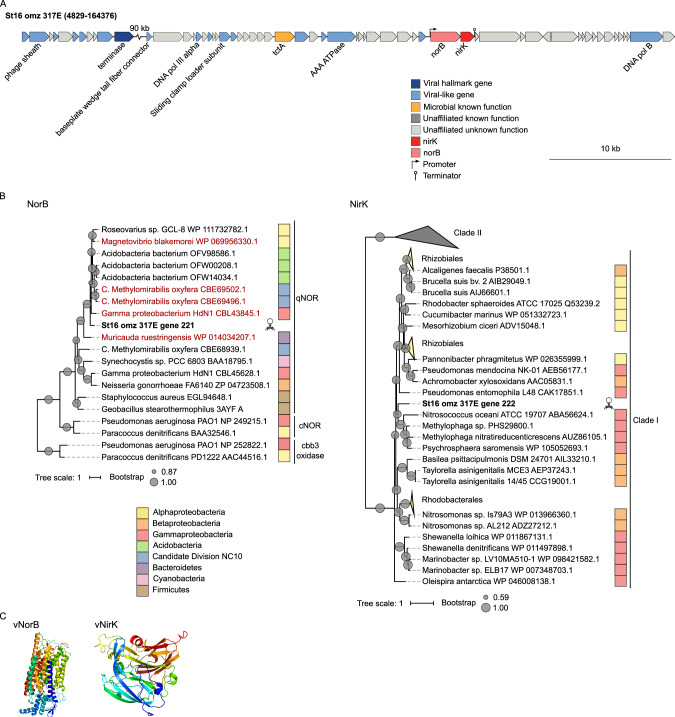
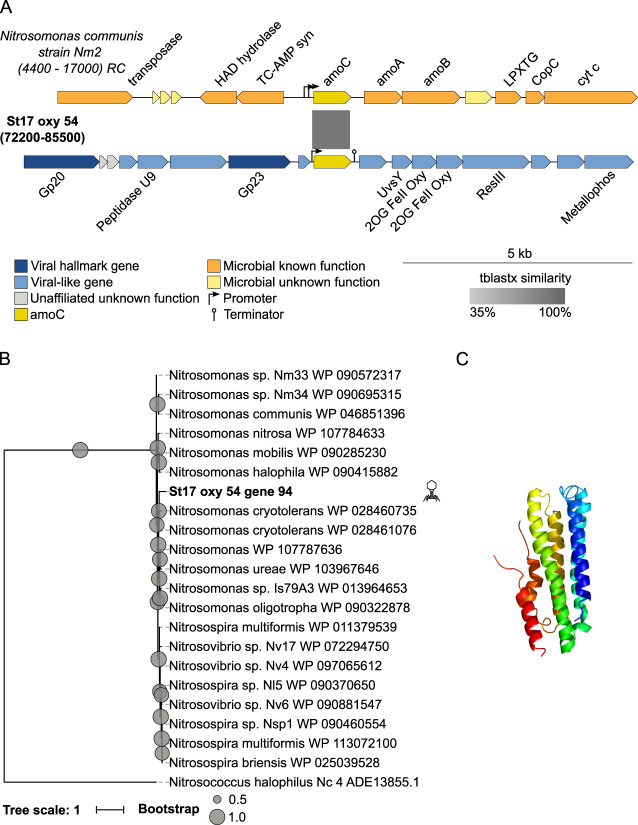
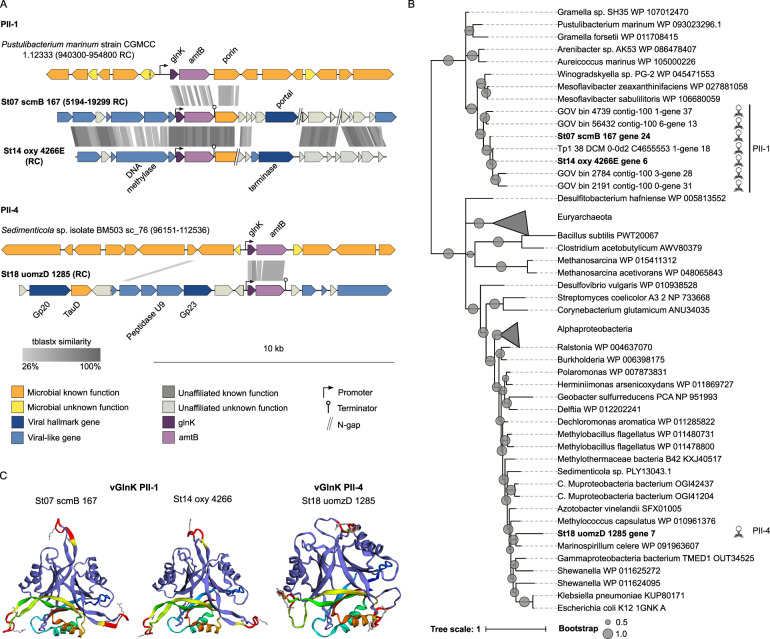
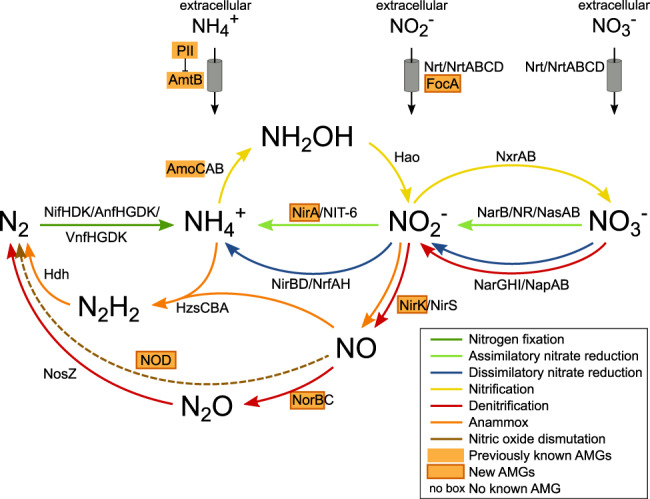
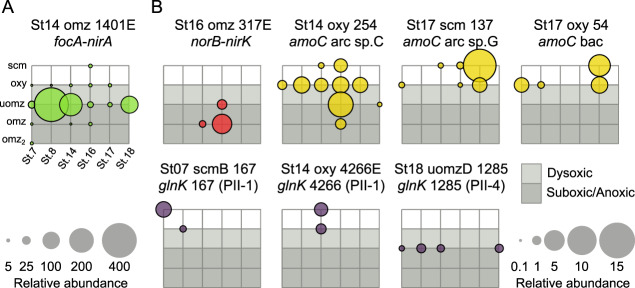
Viruses play an important role in the ecology and biogeochemistry of marine ecosystems. Beyond mortality and gene transfer, viruses can reprogram microbial metabolism during infection by expressing auxiliary metabolic genes (AMGs) involved in photosynthesis, central carbon metabolism, and nutrient cycling. While previous studies have focused on AMG diversity in the sunlit and dark ocean, less is known about the role of viruses in shaping metabolic networks along redox gradients associated with marine oxygen minimum zones (OMZs). Here, we analyzed relatively quantitative viral metagenomic datasets that profiled the oxygen gradient across Eastern Tropical South Pacific (ETSP) OMZ waters, assessing whether OMZ viruses might impact nitrogen (N) cycling via AMGs. Identified viral genomes encoded six N-cycle AMGs associated with denitrification, nitrification, assimilatory nitrate reduction, and nitrite transport. The majority of these AMGs (80%) were identified in T4-like Myoviridae phages, predicted to infect Cyanobacteria and Proteobacteria, or in unclassified archaeal viruses predicted to infect Thaumarchaeota. Four AMGs were exclusive to anoxic waters and had distributions that paralleled homologous microbial genes. Together, these findings suggest viruses modulate N-cycling processes within the ETSP OMZ and may contribute to nitrogen loss throughout the global oceans thus providing a baseline for their inclusion in the ecosystem and geochemical models.


Conflict of interest statement

The authors declare that they have no conflict of interest.

Figures

Fig. 1
Fig. 1. Map of the study area and vertical characterization of the sampling stations.
A Location of stations 7, 8, 14, 16, 17, and 18, off the coast of Peru in the ETSP oxygen minimum zones (OMZ). The map was created with Ocean Data View (http://odv.awi.de). B Oxygen (solid blue) and fluorescence/chlorophyll (solid green, dark/light) depth profiles from each station. Fluorescence is reported instead of chlorophyll for Station 18 due to differences in the sensors used during the collection of this sample. Sampling depths are indicated with dashed lines, connected by depth category: surface chlorophyll maximum (scm) in yellow, oxycline (oxy) in orange, upper OMZ with deep chlorophyll maximum (uomzD) in green, and without DCM (uomz) in light blue, and omz core (omz) in dark blue.
Fig. 2
Fig. 2. Genomic context, diversity, and protein structure of viral focA and nirA.
A Genetic map of the scaffold encoding nirA and focA and its alignment to a reference cyanobacterial genome and a reference cyanophage genome. Detailed annotation of the ETSP viral contig can be found in Supplementary Table S2. B Maximum-likelihood trees from amino-acid alignments of the viral FocA or NirA found in ETSP and cyanobacterial sequences. Branches from viral AMGs found in this study are highlighted with thick lines. Internal nodes and SH-like supports are represented by proportional circles (all nodes with support <0.50 were collapsed). Asterisks indicate Prochlorococcus sequences where horizontal gene transfer of nirA and focA (AG-363-P06 single cell (HLVI clade)) and nirA (Prochlorococcus MIT0604 (HLII clade)) have been proposed (from refs. [87, 88]). Colors represent Synechococcus subcluster 5.1, and Prochlorococcus high-light (HL) and low-light (LL) adapted clades. C Quaternary structure of viral FocA and tertiary structure of viral NirA.
Fig. 3
Fig. 3. Genomic context, diversity, and protein structure of viral norB and nirK.
A Genetic map of the scaffold encoding norB and nirK. Detailed annotation of this contig can be found in Supplementary Table S2. B Maximum-likelihood trees from amino-acid alignments of viral NorB or NirK found in ETSP and reference microbial sequences. The first tree represents the heme–copper oxidases superfamily, including cytochrome C oxidase cbb3-type (cbb3 oxidase), cytochrome c-dependent nitric oxide reductase (cNORs), and quinol-dependent nitric oxide reductases (qNORs) including the potential NO dismutases (in red) (from ref. [101]). Viral AMGs found in this study are highlighted in bold. Internal nodes and SH-like supports are represented by proportional circles (all nodes with support <0.50 were collapsed). C Tertiary structures of viral NorB and viral NirK.
Fig. 4
Fig. 4. Genomic context, diversity, and protein structure of viral amoC.
A Genetic map of the viral scaffold encoding the bacterial-like amoC, and alignment to a reference microbial genome containing this gene. Detailed annotation of the viral scaffold can be found in Supplementary Table S2. B A maximum-likelihood tree from an amino-acid alignment of the bacterial-like viral AmoC found in ETSP and reference microbial sequences. The viral AMG found in this study is bolded. Internal nodes and SH-like supports are represented by proportional circles (all nodes with support <0.50 were collapsed). C Tertiary structure of the bacterial-like viral AmoC.
Fig. 5
Fig. 5. Genomic context, diversity, and protein structure of viral glnK.
A Genetic map of the scaffolds encoding glnK, and alignment to reference microbial genomes containing this gene. Detailed annotation of the viral contigs can be found in Supplementary Table S2. B A maximum-likelihood tree from an amino-acid alignment of viral GlnK found in ETSP and reference microbial sequences. Viral AMGs found in this study are highlighted in bold. Internal nodes and SH-like supports are represented by proportional circles (all nodes with support <0.50 were collapsed). C Tertiary structure of viral GlnK.
Fig. 6
Fig. 6. Potential contribution of viruses to nitrogen cycling and transport.
The schematic represents the main pathways that drive the nitrogen cycle and the participating enzymes and transporters. Proteins with a viral version are highlighted in orange boxes. Viral NorB and NOD correspond to the same protein that is homologous to both nitric oxide reductase and nitric oxide dismutase. Nitrogen uptake is performed by the ammonia transporter (AmtB, which is regulated by PII), the MFS-type nitrate/nitrite transporter (Nrt), the ABC-type nitrate transporter (NrtABCD), and the formate/nitrite transporter (FocA). The enzymes that transform nitrogen are molybdenum-iron nitrogenase (NifHDK), iron-iron nitrogenase (AnfHGDK), vanadium-iron nitrogenase (VnfHGDK), an ammonia monooxygenase (AmoCAB), hydroxylamine dehydrogenase (Hao), nitrite oxidoreductase (NxrAB), ferredoxin-nitrate reductase (NarB), nitrate reductase (NAD(P)H) (NR), assimilatory nitrate reductase (NasAB), ferredoxin-nitrite reductase (NirA), nitrite reductase (NAD(P)H) (NIT-6), membrane-bound nitrate reductase (NarGHI), periplasmic nitrate reductase (NapAB), nitrite reductase (NADH) (NirBD), cytochrome c nitrite reductase (NnfAH), copper-containing nitrite reductase (NirK), heme-containing nitrite reductase (NirS), nitric oxide reductase (NorBC), nitrous oxide reductase (NosZ), hydrazine synthase (HzsCBA), hydrazine dehydrogenase (Hdh), and nitric oxide dismutase (NOD).
Fig. 7
Fig. 7. Distribution of N-AMG-containing viral populations across the ETSP OMZ samples.
Bubble plots representing the relative abundances, in terms of normalized coverage, of viral populations containing the focA and nirA genes (panel A, in green), norB and nirK genes (panel B, in red), amoC genes (panel B, in yellow) and the glnK genes (panel B, in purple). The x axis of each grid represents the stations (7, 8, 14, 16, 17, and 18), and the y axis represents the sampling depths (from top to bottom: surface chlorophyll maximum (scm), oxycline (oxy), upper OMZ (uomz) and core of the OMZ (omz)). Station 7 had a second core OMZ sample (omz2) and station 18 was only sampled in the upper OMZ. Gray boxes represent the OMZ: light gray for dysoxic waters below the oxycline, and dark gray for suboxic and anoxic waters in the upper and core of the OMZ.

References

    1. Falkowski PG, Fenchel T, Delong EF. The microbial engines that drive Earth’s biogeochemical cycles. Science. 2008;320:1034–9. doi: 10.1126/science.1153213. - DOI - PubMed
    1. Field CB, Behrenfeld MJ, Randerson JT, Falkowski P. Primary production of the biosphere: integrating terrestrial and oceanic components. Science. 1998;281:237–40. doi: 10.1126/science.281.5374.237. - DOI - PubMed
    1. Fuhrman JA. Marine viruses and their biogeochemical and ecological effects. Nature. 1999;399:541–8. doi: 10.1038/21119. - DOI - PubMed
    1. Wommack KE, Colwell RR. Virioplankton: viruses in aquatic ecosystems. Microbiol Mol Biol Rev. 2000;64:69–114. doi: 10.1128/MMBR.64.1.69-114.2000. - DOI - PMC - PubMed
    1. Suttle CA. Viruses in the sea. Nature. 2005;437:356–61. doi: 10.1038/nature04160. - DOI - PubMed

Publication types