. 2020 Nov 16;10(1):19912.
doi: 10.1038/s41598-020-76709-8.

The maturity in fetal pigs using a multi-fluid metabolomic approach

Affiliations

The maturity in fetal pigs using a multi-fluid metabolomic approach

Gaëlle Lefort et al. Sci Rep. .

Abstract

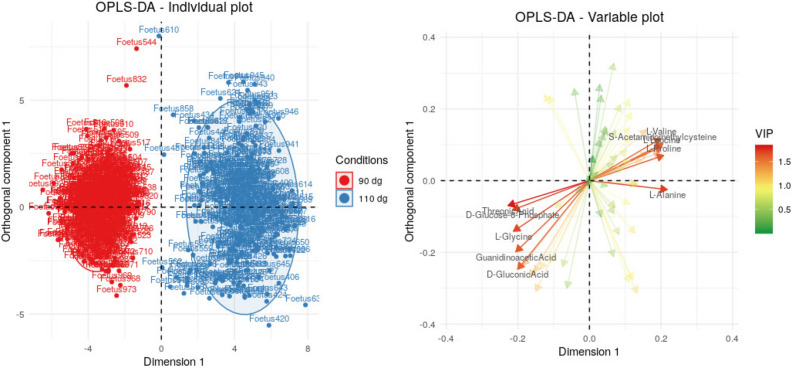
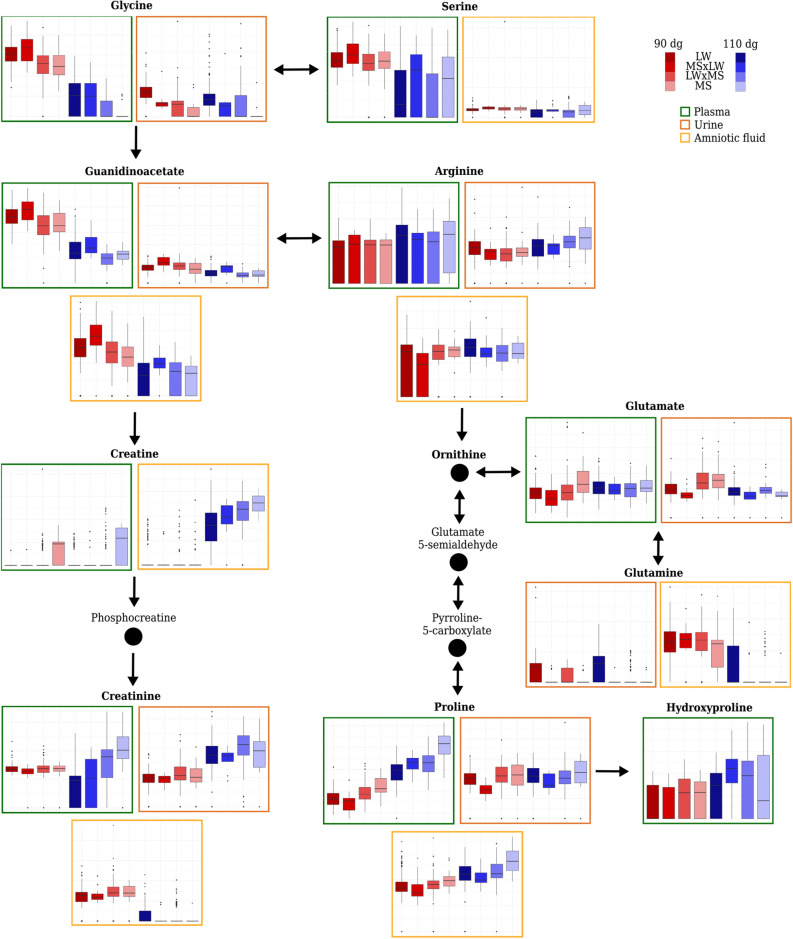
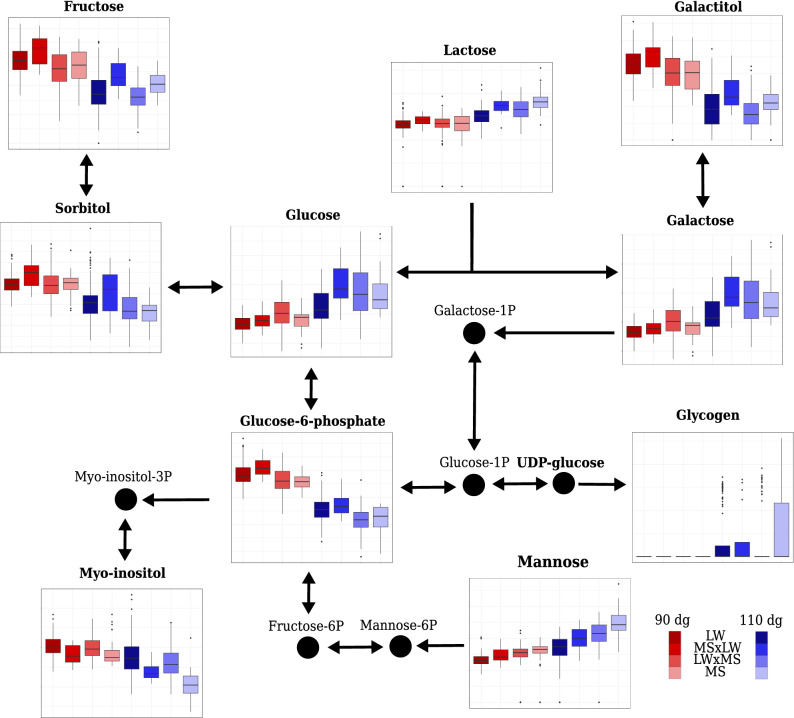
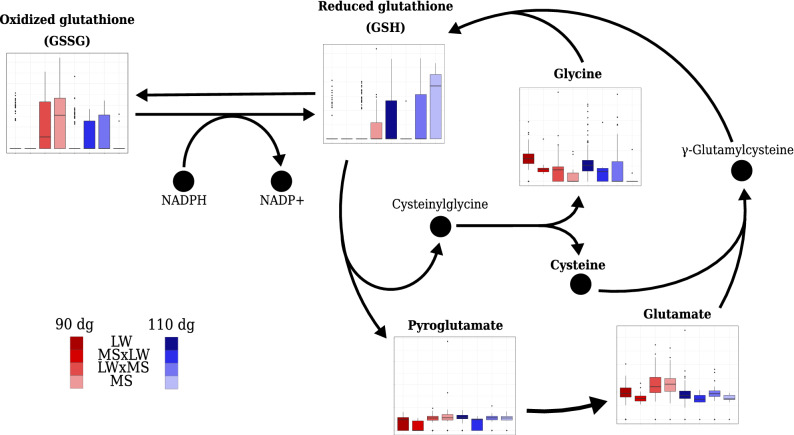
In mammalian species, the first days after birth are an important period for survival and the mortality rate is high before weaning. In pigs, perinatal deaths average 20% of the litter, with important economic and societal consequences. Maturity is one of the most important factors that influence piglet survival at birth. Maturity can be defined as the outcome of complex mechanisms of intra-uterine development and maturation during the last month of gestation. Here, we provide new insights into maturity obtained by studying the end of gestation at two different stages (3 weeks before term and close to term) in two breeds of pigs that strongly differ in terms of neonatal survival. We used metabolomics to characterize the phenotype, to identify biomarkers, and provide a comprehensive understanding of the metabolome of the fetuses in late gestation in three fluids (plasma, urine, and amniotic fluid). Our results show that the biological processes related to amino acid and carbohydrate metabolisms are critical for piglet maturity. We confirm the involvement of some previously described metabolites associated with delayed growth (e.g., proline and myo-inositol). Altogether, our study proposes new routes for improved characterization of piglet maturity at birth.


Conflict of interest statement

The authors declare no competing interests.

Figures

Figure 1
Figure 1
Individual and variable plots for the first two axes of the Orthogonal Projections to Latent Structures Discriminant Analyses (OPLS-DA) on n=611 fetuses. Figures were obtained using the quantifications from plasma spectra for both days of gestation (90 dg and 110 dg) and all genotypes (LW, MS and cross fetuses together). VIP Variable Influence on Projection.
Figure 2
Figure 2
Relative concentrations of some metabolites involved in amino acid metabolism (“arginine and proline metabolism” and “glycine, serine and threonine metabolism”) in plasma, urine and amniotic fluid at the two stages of gestation (90 dg and 110 dg, in red and blue respectively) and fetal genotypes (LW, MS × LW, LW × MS and MS, from left to right respectively). For the sake of clarity, only nine and seven metabolites out of 15 in plasma and 15 differential metabolites in urine are shown. Metabolites in bold are those included in the ASICS reference library. The coordinates of the y axes in boxplots can not be compared between two metabolites because the relative concentration limits of the boxplots are adapted to each metabolite.
Figure 3
Figure 3
Relative concentrations of some metabolites involved in the carbohydrate metabolism pathways (“galactose metabolism” and “starch and sucrose metabolism”) in plasma according to the stage of gestation (90 dg and 110 dg, in red and blue respectively) and fetal genotypes (LW, MS × LW, LW × MS and MS, from left to right, respectively). Metabolites in bold are those included in the ASICS reference library. The coordinates of the y axes in boxplots cannot be compared between two metabolites because the relative concentration limits of the boxplots are adapted to each metabolite.
Figure 4
Figure 4
Relative concentrations in urine according to the stage of gestation (90 dg and 110 dg, in red and blue respectively) and the fetal genotype (LW, MS × LW, LW × MS and MS, from left to right) for some metabolites in the “glutathione pathway”. For the sake of clarity, only the γ-glutamyl-cycle is represented in this figure. Metabolites in bold are those included in the ASICS reference library. The coordinates of the y axes in boxplots can not be compared between two metabolites because relative concentration limits of the boxplots are adapted to each metabolite.

Similar articles

Cited by

References

    1. UNICEF, WHO, World Bank Group and United Nations. Levels and trends in child mortality 2019. Estimates developed by the UN Inter-agency group for child mortality estimation. Tech. Rep., UN-IGME (2019). 10.1016/S0301-6226(98)00147-X. https://www.unicef.org/reports/levels-and-trends-child-mortality-report-....
    1. Edwards S, Baxter E. Piglet mortality: causes and prevention. In: Farmer C, editor. The Gestating and Lactating Sow. Wageningen: Academic Publishers; 2015. pp. 253–278.
    1. Baxter EM, et al. Investigating the behavioural and physiological indicators of neonatal survival in pigs. Theriogenology. 2008;69:773–783. doi: 10.1016/j.theriogenology.2007.12.007. - DOI - PubMed
    1. Leenhouwers JI, Knol EF, de Groot PN, Vos H, van der Lende T. Fetal development in the pig in relation to genetic merit for piglet survival. J. Anim. Sci. 2002;80:1759–1770. doi: 10.2527/2002.8071759x. - DOI - PubMed
    1. Basso O, Wilcox A. Mortality risk among preterm babies: Immaturity versus underlying pathology. Epidemiology. 2010;21:521–527. doi: 10.1097/EDE.0b013e3181debe5e. - DOI - PMC - PubMed

Publication types