. 2020 Dec;23(12):1580-1588.
doi: 10.1038/s41593-020-00737-w. Epub 2020 Nov 16.

Acute targeting of pre-amyloid seeds in transgenic mice reduces Alzheimer-like pathology later in life

Affiliations

Acute targeting of pre-amyloid seeds in transgenic mice reduces Alzheimer-like pathology later in life

Ruth E Uhlmann et al. Nat Neurosci. 2020 Dec.

Abstract

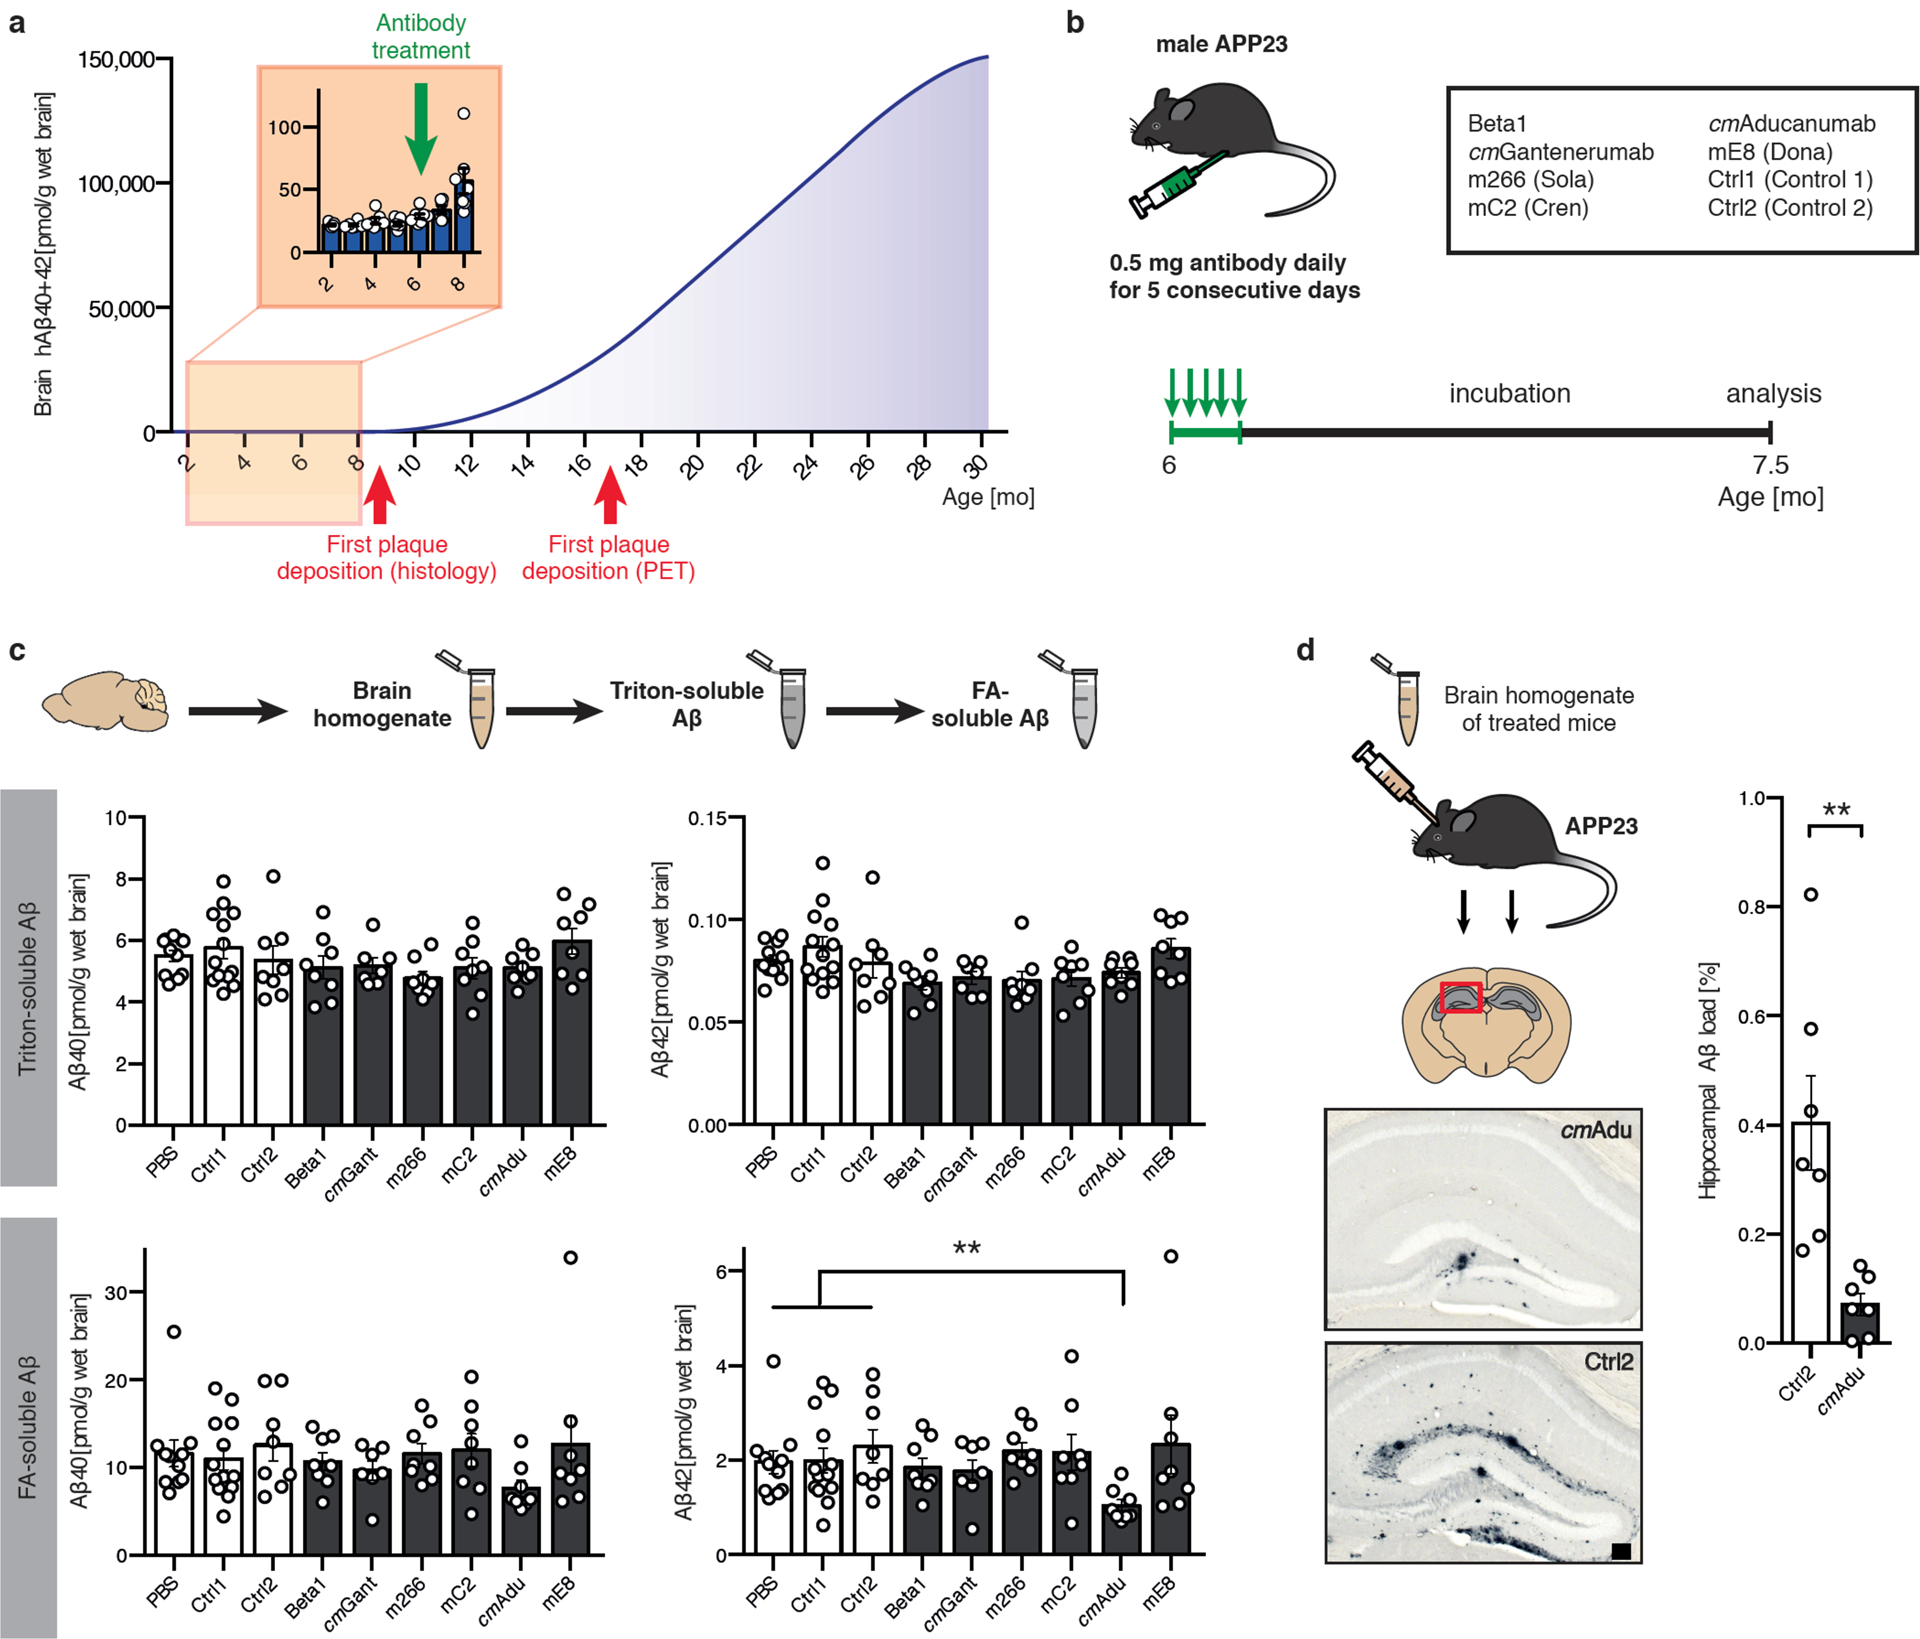
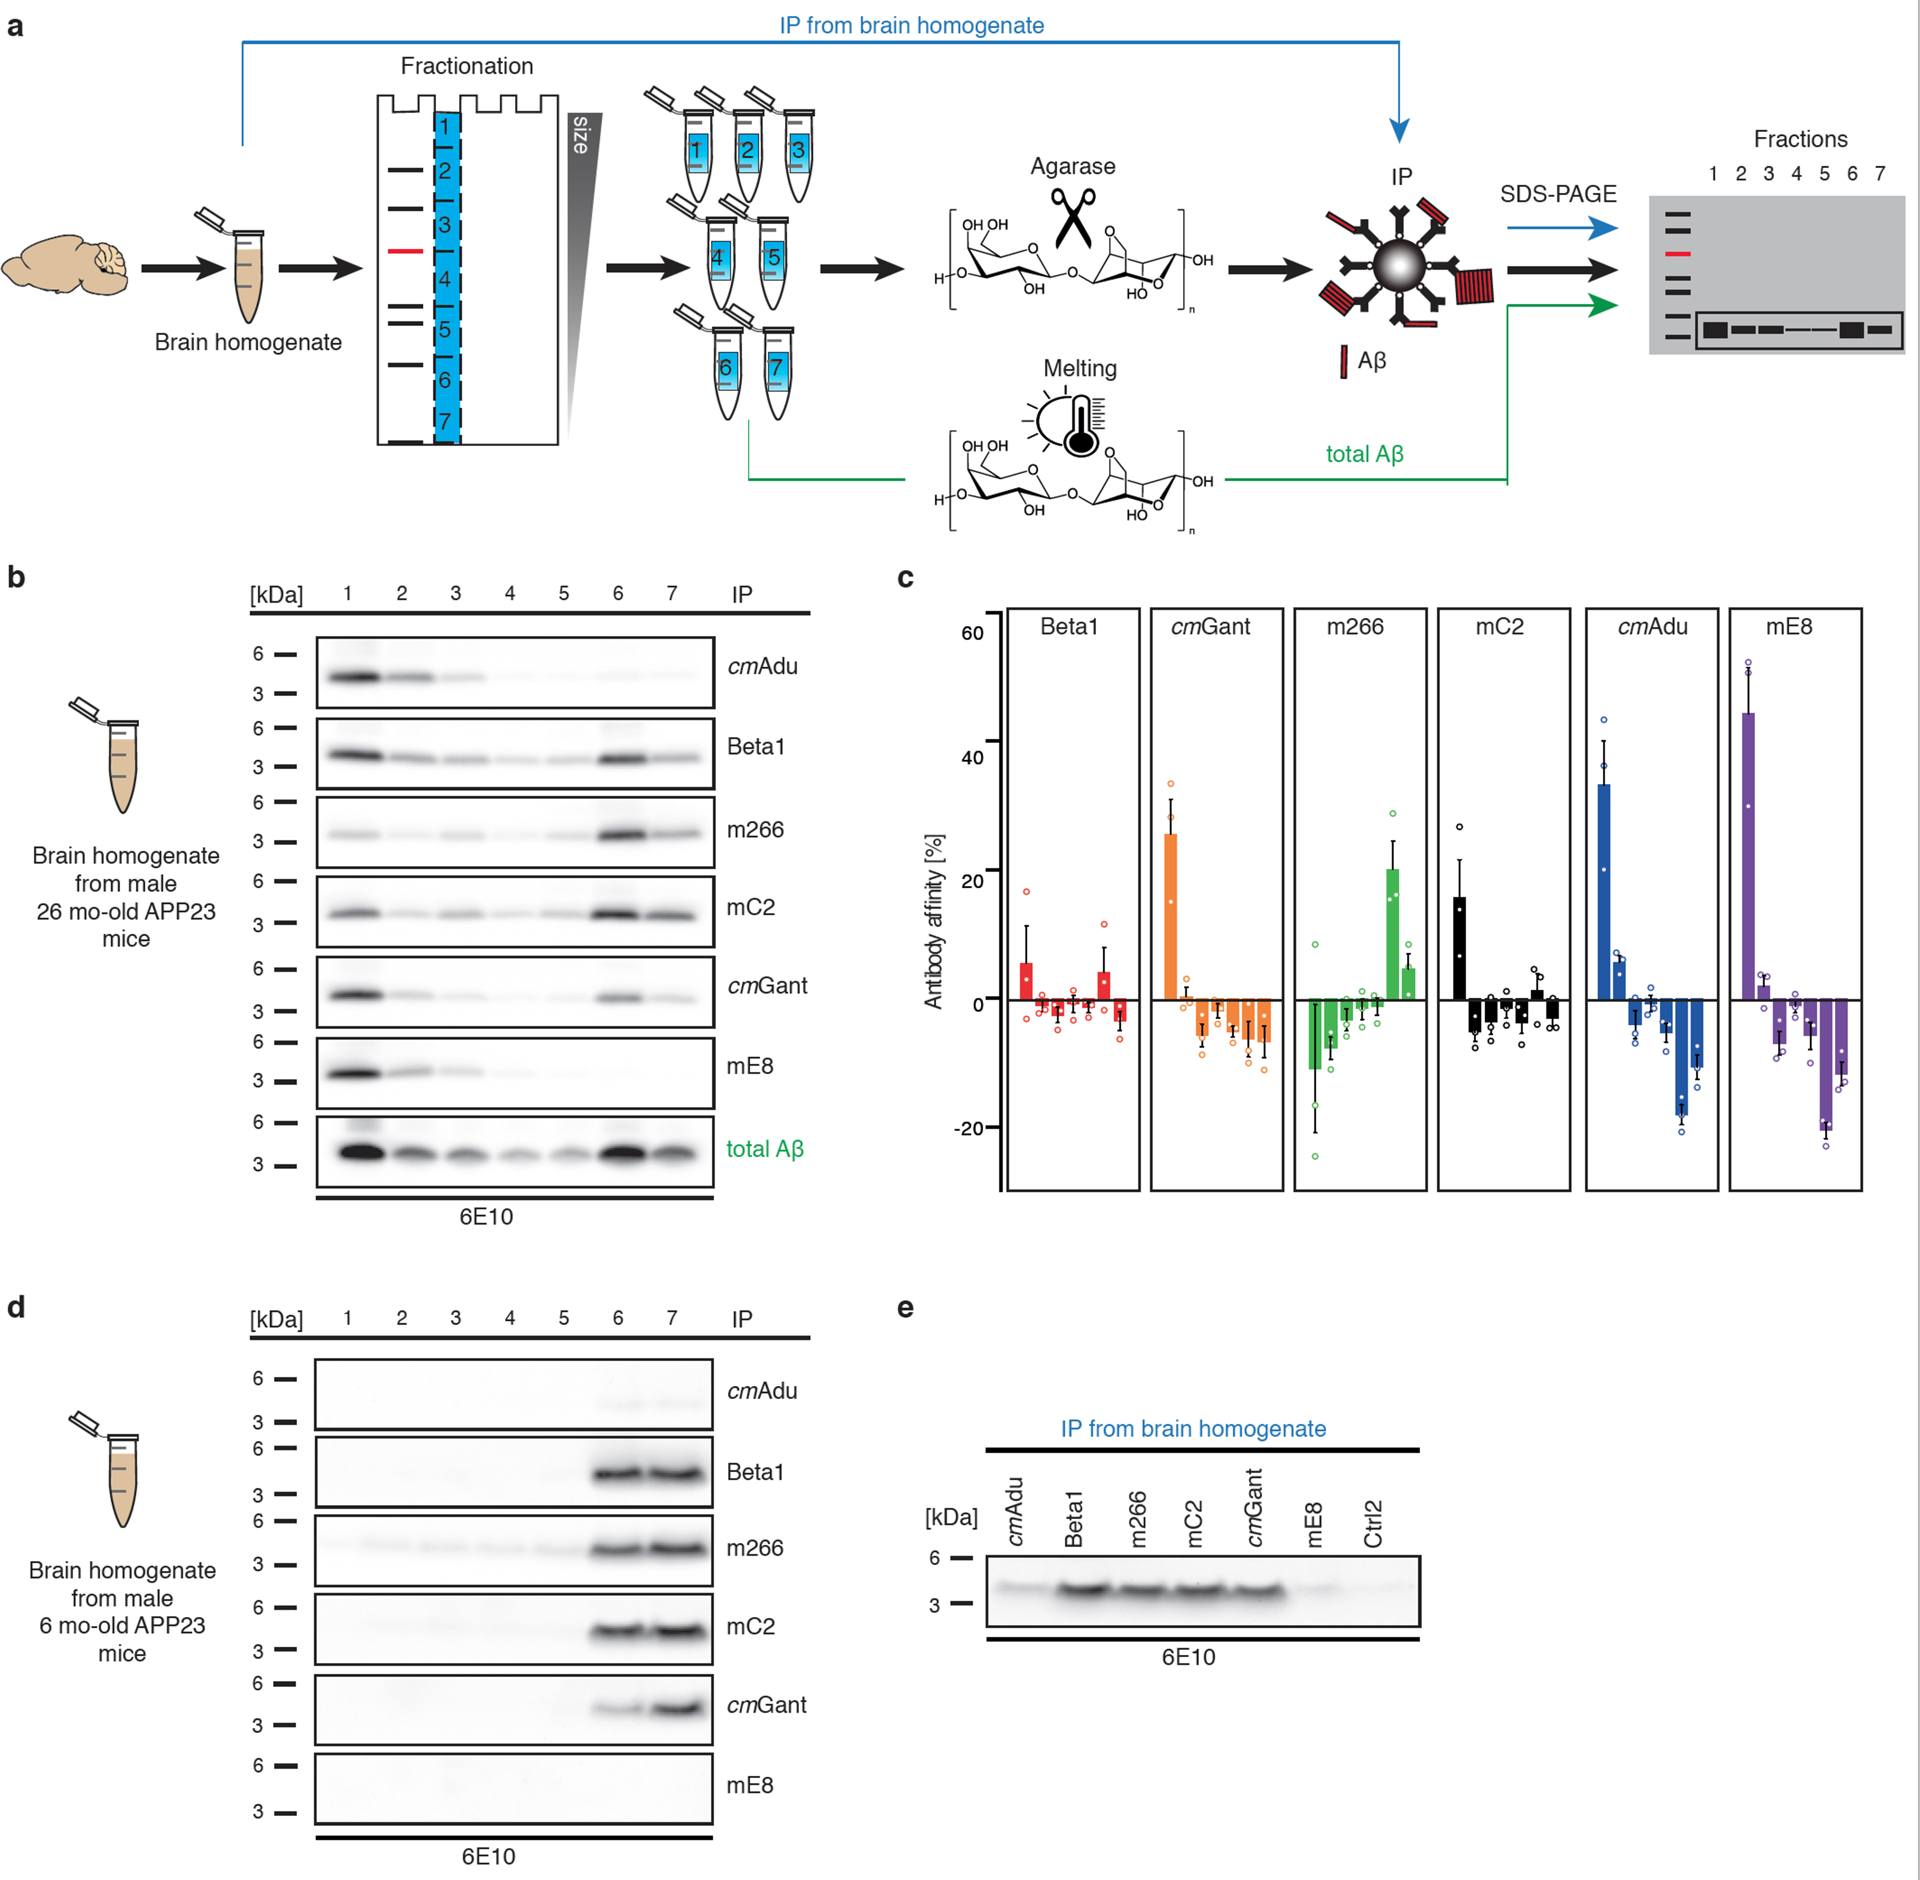
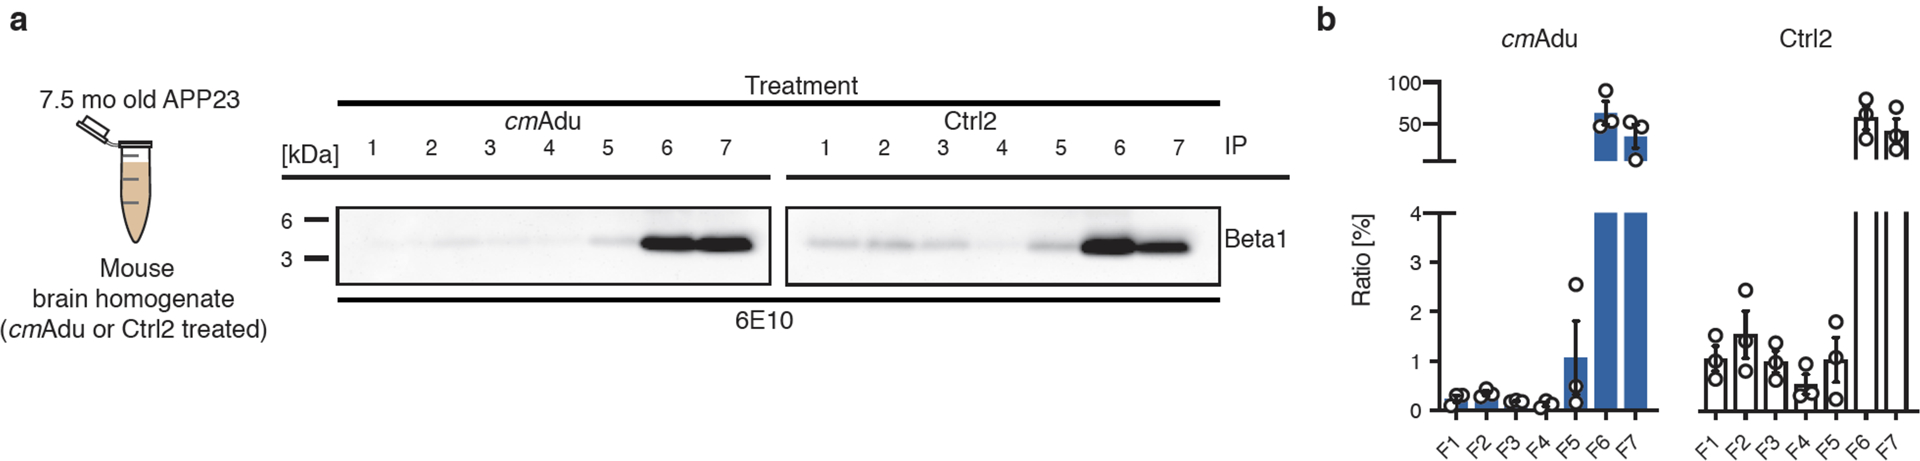
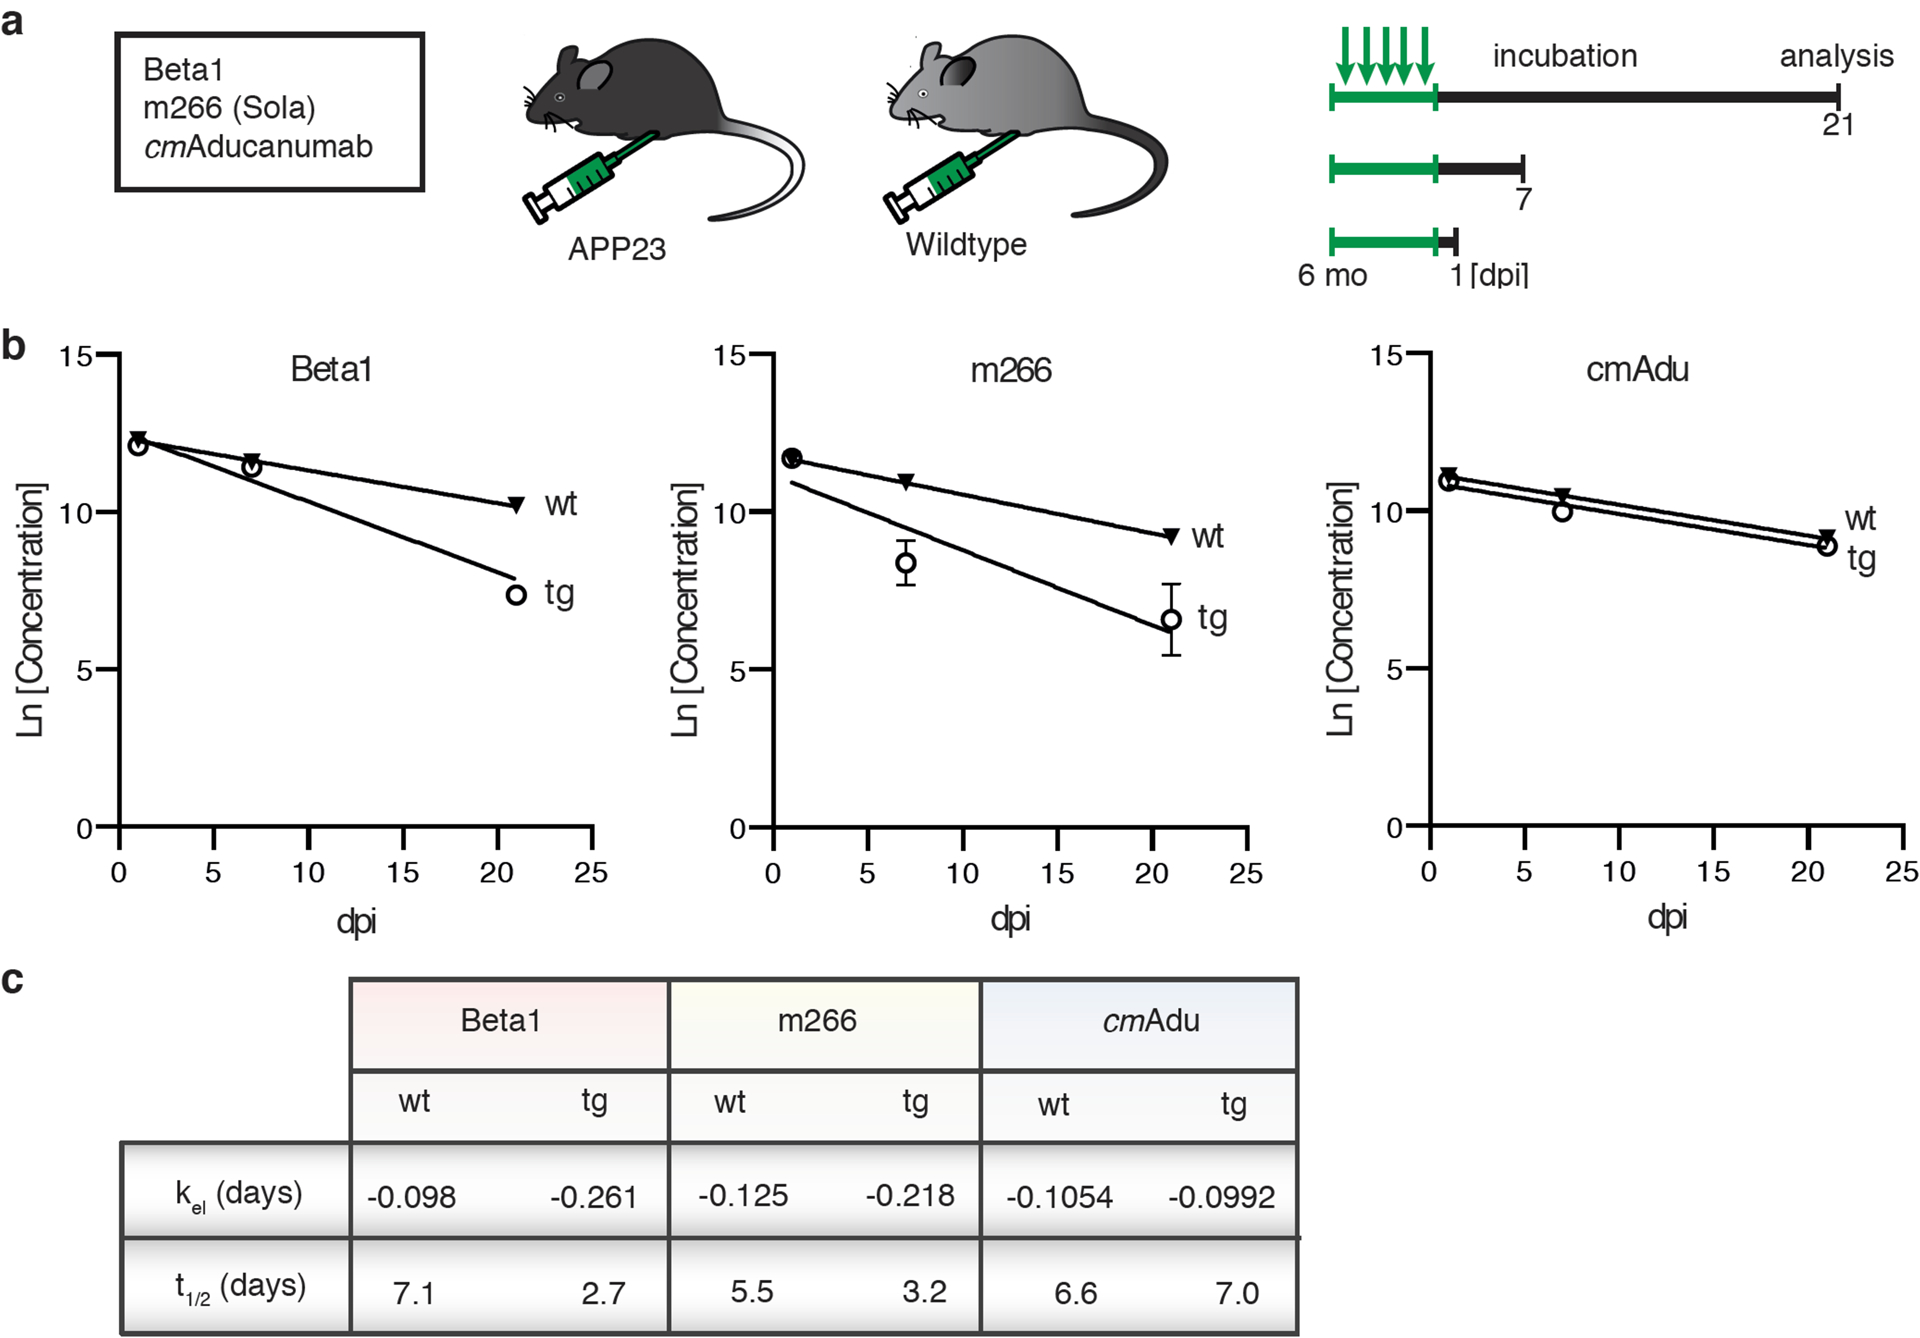
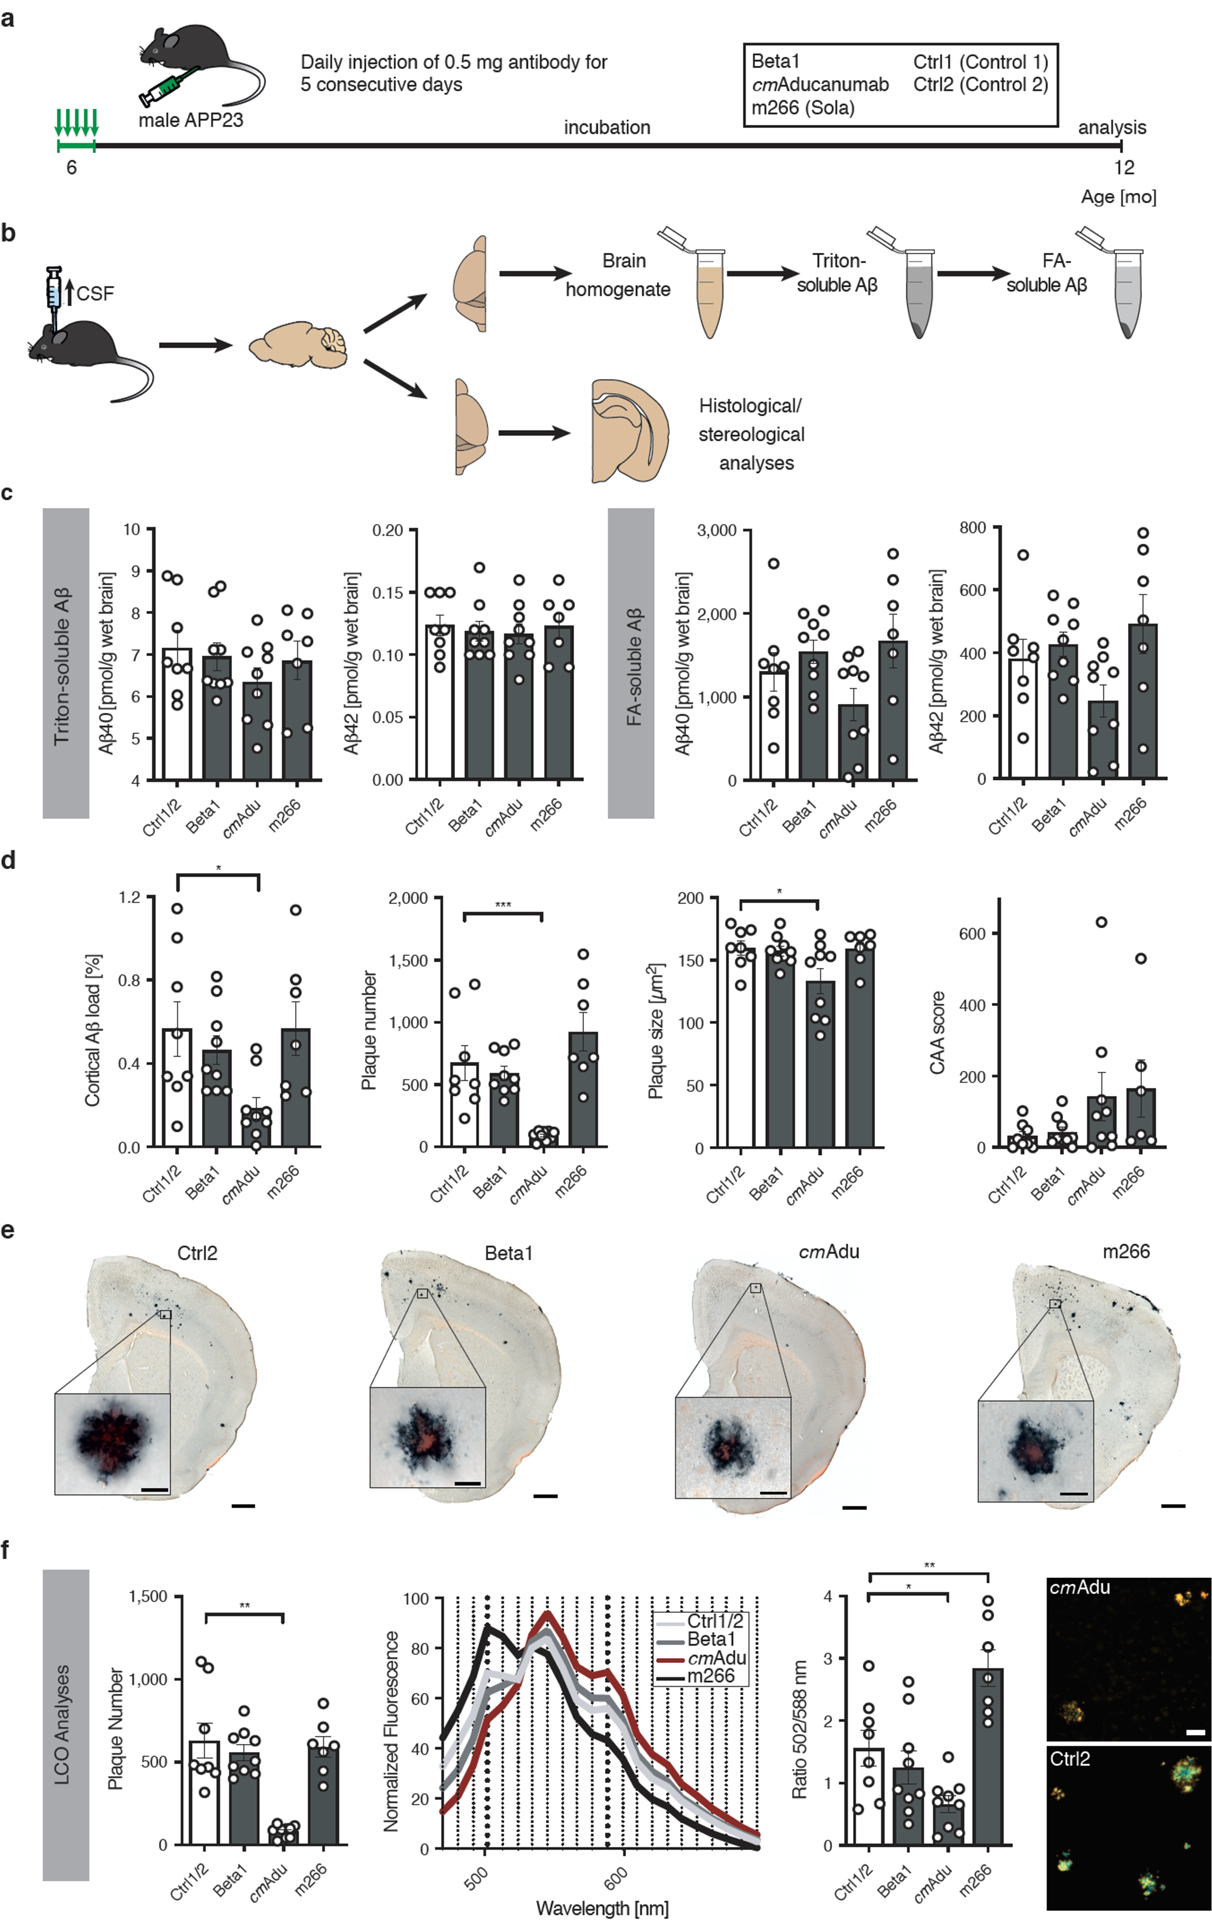
Amyloid-β (Aβ) deposits are a relatively late consequence of Aβ aggregation in Alzheimer's disease. When pathogenic Aβ seeds begin to form, propagate and spread is not known, nor are they biochemically defined. We tested various antibodies for their ability to neutralize Aβ seeds before Aβ deposition becomes detectable in Aβ precursor protein-transgenic mice. We also characterized the different antibody recognition profiles using immunoprecipitation of size-fractionated, native, mouse and human brain-derived Aβ assemblies. At least one antibody, aducanumab, after acute administration at the pre-amyloid stage, led to a significant reduction of Aβ deposition and downstream pathologies 6 months later. This demonstrates that therapeutically targetable pathogenic Aβ seeds already exist during the lag phase of protein aggregation in the brain. Thus, the preclinical phase of Alzheimer's disease-currently defined as Aβ deposition without clinical symptoms-may be a relatively late manifestation of a much earlier pathogenic seed formation and propagation that currently escapes detection in vivo.


Conflict of interest statement

COMPETING FINANCIAL INTERESTS:

S.C., F.K., and J.B.S are current or former employees of Lundbeck; F.Q., P.H.W., and T.B. are current employees and/or shareholders of Biogen; J.-U.R and H.C. are former employees of Probiodrug AG; M.S. is a former employee of Novartis. The other authors have no competing interest.

Figures

Extended Data Figure 1.
Extended Data Figure 1.. Semi-native agarose gel electrophoresis of synthetic Aβ.
Semi-native agarose gel electrophoresis was performed using monomeric, oligomeric and fibrillar Aβ, in the same fashion as the first steps of the ARPA method, to determine Aβ distribution among fractions. Monomeric Aβ was prepared using Aβ1–40 (Bachem) in DMSO. The oligomeric preparation followed a protocol for Aβ-derived diffusible ligands using Aβ1–42, and fibrils were prepared by incubating 100μM Aβ1–42 at 37°C for 24 hours. Agarose lanes were cut as described in Fig. 2a and the Methods section; agarose gel pieces were melted followed by denaturing immunoblotting and then probed for Aβ with antibody 6E10. Chemiluminescent signal was captured with Amersham Hyperfilm ECL (in contrast to the chemiluminescent imager used for quantitative analysis in Fig. 2). See also Methods for details. Note that (presumed) monomeric Aβ runs in fractions 6 and 7, whereas oligomeric Aβ species are additionally seen in fractions 4 and 5, and Aβ fibrils are in fractions 1 to 3. This experiment was done independently twice with similar results.
Extended Data Figure 2.
Extended Data Figure 2.. Aβ assemblies from AD brain, ARPA and seeding activity.
(a) PBS-homogenates from the frontal cortex of three AD subjects (Braak stage VI) were pooled to get a representative sample. ARPA (see Fig. 2 for a description) is shown for the various antibodies. Immunoblots were probed with Aβ-antibody 6E10. The experiment was repeated 3 times with similar results. (b) AD brain fractions (F)1–7 and their dilutions were injected into the hippocampus of young, pre-depositing 2- to 3-month-old male APP23 host mice. Brains were immunohistochemically analyzed for Aβ deposition 8 months later. (c) Results for F2 and F5 (both undiluted) is shown and reveal a high seeding activity for F2 and no seeding for F5. Scale bar: 500 μm. (d) Number of mice with induced Aβ deposition/total mice per group at each dilution from the various fractions (initially all groups had 6–7 mice, of which 4 treated with the undiluted F2 fraction died). (e) SD50 for the different fractions was defined as the negative log10 of the brain extract dilution at which 50% of the host mice showed induced Aβ deposition (see Methods). The specific seeding activity (SD50/total Aβ) for each fraction is shown and indicates a peak for F4.
Extended Data Figure 3.
Extended Data Figure 3.. Semiquantitative comparison of signals obtained by ARPA in young, predepositing APP23 mice.
ARPA was performed in PBS homogenates from young, 6-month-old male APP23 brains as presented in Fig. 2d. For semiquantitative analysis, densitometric values of fractions (F) 6 and 7 obtained from the chemiluminescence imager were normalized to the time of exposure. The signal per second was calculated from the five longest exposure times or the five exposure times before signal saturation and the mean was taken. The obtained signal per second for Ctrl1/2 was considered as background, and therefore subtracted from the values calculated for all other antibodies, which were in total set equal to 100%. Relative values for each fraction were plotted. Beta1 and mC2 show similar signal-to-second values. The highest signal-per-second was obtained from m266, whereas the lowest signals were calculated for cmAdu and mE8 (see insert). All data are represented as means (n=3 experiments) ± SEMs. For details see Fig. 2d.
Extended Data Figure 4.
Extended Data Figure 4.. Lack of detectable Aβ antibody titers in normal and Ctrl antibody-treated APP23 mice.
Plasma was taken for analysis from randomly selected 6-month-old male APP23 tg mice, either non-treated (tg, n=5) or treated for 5 consecutive days with Ctrl1 or Ctrl2 antibody and analyzed 6 weeks later (n=5/group; same mice as presented in Fig. 1). As a positive control, plasma from the Beta1- and cmAdu-injected mice one day after the injection were included (n=5 each) together with a pool of non-tg mice as a further negative control. Two different ELISA setups were used and performed on two consecutive days, one optimized to measure Beta1 titers (a) and another one optimized to measure cmAdu titers (b-d) (see Methods). Data are represented as group means ± SEMs. Results reveal that the injections of Ctrl antibodies into APP23 tg or non-tg mice did not induce Aβ antibody titers. Further, no detectable titers were found in untreated APP23 tg or non-tg mice.
Figure 1.
Figure 1.. Targeting Aβ seeds at the pre-amyloid stage.
(a) Brain Aβ in male APP23 mice as a function of age. The polynomial (4th degree) curve for human (h) Aβ concentration (Aβx-40 and Aβx-42 combined) at 10–30 months of age was calculated based on previous publications,,. In addition, hAβx-40 and Aβx-42 were measured in 2- to 8-month-old male APP23 mice, revealing a first notable increase at 7–8 months of age (n=7, 6, 7, 7, 7, 6, 7 for the 2, 3, 4, 5, 6, 7, 8 month-old mice, respectively). This is at least 1 month earlier than Aβ plaque deposition becomes apparent histologically in male APP23 mice,,, and 9 months earlier than plaque deposition has been reported by PET imaging. (b) Schematic overview of antibody screening (see also extended Data Table 1). Six-month-old male APP23 mice intraperitoneally received 0.5 mg of one of the six antibodies directed against Aβ, corresponding control (Ctrl) antibodies, or PBS on 5 consecutive days (n=11 [PBS], 13 [Ctrl1], 8 [Ctrl2], 8 [Beta1], 7 [cmGantanerumab {cmGant}], 8 [m266], 8 [mC2], 8 [cmAducanumab {cmAdu}], 8 [mE8]). All groups initially had n=8 mice. One [cmGant] animal died. mE8 immunization and additional controls were performed in a separate experiment, explaining the higher number of mice receiving control antibody. Mice were sacrificed and analyzed at 7.5 months of age. (c) Brain homogenates were extracted by Triton and subsequently with formic acid (FA). Number of mice/group see above. PBS, Ctrl1, and Ctrl2 were pooled for this analysis. Kruskal-Wallis-Test indicated no group differences for the Triton-extracted Aβ (Aβx-40, H(6)=8.865, P=0.1813; Aβx-42, H(6)=14.84, P=0.0215; no significant group differences between controls and any other group with post hoc Dunn’s multiple comparison). For FA-extracted Aβ, group differences were found for Aβx-42 (H(6)=14.73; P=0.0225, post hoc Dunn’s multiple comparison test between cmAdu-injected mice and controls, P=0.006). Note that Aβ was determined with MSD immunoassays while the measurements in panel (a) were done using Simoa assays and direct FA extraction, thus there are minor differences in absolute amounts (see Methods). (d) Brain homogenates from cmAdu- and Ctrl2-treated (7.5-month-old) mice were inoculated into the hippocampus of 3-month-old male APP23 hosts. After an 8-month incubation period, the brain homogenate of cmAdu-treated mice induced markedly less Aβ deposition (n=7 for both cmAdu and Ctrl2, two-tailed unpaired t-test; t(12)=3.726; P=0.003). All data are represented as group means ± SEMs; **P<0.01; Scale bar in d: 100μm.
Figure 2.
Figure 2.. Brain Aβ assemblies recognized by the various antibodies.
(a) Schematic overview of Antibody Recognition Profiling of Aβ assemblies (ARPA). In a first step, brain PBS-homogenates are immunoprecipitated with the various antibodies followed by denaturing immunoblotting using 6E10 antibody. In a second step, brain PBS-homogenates are subjected to semi-native agarose gel electrophoresis. Liquefied agarose fractions containing Aβ assemblies of various sizes are then achieved by cutting the agarose gels into pieces and treating the pieces with agarase. Within each individual fraction, Aβ is then immunoprecipitated with one of the various antibodies followed by denaturing immunoblotting. As a control for the total amount of Aβ in the individual fractions, agarose gel pieces are melted and subjected to denaturing immunoblotting. For a more detailed description of ARPA, see extended Data Fig. 1 and Methods. (b) In fresh-frozen, amyloid-laden tissue samples from aged, male 26-month-old APP23 mice (hemibrains from three mice were pooled to get a representative sample), ARPA revealed that cmAdu and mE8 recognized almost exclusively larger Aβ assemblies while Beta1 and mC2 (and to some degree also cmGant) recognized larger but also low molecular weight (presumably monomeric) Aβ (bands 6 and 7). Antibody m266 mainly recognized monomeric Aβ. (c) Bands were quantified and the difference in intensity compared to total Aβ in the melted fraction is shown (the experiment was repeated 3 times; means and SEMs are shown). Positive antibody affinity values indicate that the antibody recognizes Aβ species better than predicted from the total amount of Aβ, while a negative antibody affinity indicates that the antibody recognizes an Aβ species less than expected from the total amount of Aβ in this fraction. (d) In PBS homogenates from young, 6-month-old APP23 brains (hemibrains from at least three animals were pooled per experiment to get representative samples), ARPA revealed recognition of monomeric Aβ by Beta1, mC2, cmGant, and m266, but these antibodies failed to detect larger Aβ assemblies. No signal and a signal barely above background were obtained with mE8 and cmAdu, respectively (the experiment was performed three times, for quantification see extended Data Fig. 3). However, (e) using direct immunoprecipitation, cmAdu recognized Aβ species, while no similar signal was found for mE8. Note that in amyloid-laden mouse (panel b) and human brain (extended Data Fig. 2), monomeric Aβ largely runs in fraction 6 while in the young (pre-amyloid) brain it runs equally in 6 and 7.
Figure 3.
Figure 3.. Removal of higher molecular Aβ assemblies in cmAducanumab-treated mice.
(a) Six month-old APP23 mice acutely treated with cmAducanumab (cmAdu) and Control antibody (Ctrl2) were examined at 7.5-months of age (see Fig. 1 for details). Brain PBS homogenates of all 8 cmAdu- and 8 Ctrl2-treated mice were pooled. Homogenates were examined with ARPA (see Fig. 2 for a description of the ARPA methodology) using Beta1 antibody as capture antibody to pull down Aβ. Beta1 was used since it recognizes all Aβ species fairly equally in this assay (see Fig. 2). Note the faint bands in the higher molecular fractions in the Ctrl2-treated mice that appear diminished in the cmAdu-treated mice. (b) For semi-quantitative analysis, densitometric values obtained from a chemiluminescence imager were normalized to the time of exposure. For each fraction, the signal per second was calculated for five exposure times before signal saturation and means were taken. For comparison, all signal-per-second values for a treatment group were set equal to 100% and the relative value for each fraction was plotted. The experiment was repeated 3 times and the means ± SEMs are shown. Similar results were obtained in an additional experiment with the antibody 4G8 (BioLegend, San Diego, CA) as capture antibody.
Figure 4.
Figure 4.. Pharmacokinetics and target engagement of antibodies at pre-amyloid stages.
(a) Schematic overview of antibody titer measurements. Six-month-old male transgenic (tg) APP23 mice or 6-month-old male wildtype (wt) mice received intraperitoneally 0.5 mg of either Beta1, m266, or cmAducanumab (cmAdu) on 5 consecutive days (n=5/group/antibody). Mice were analyzed 1, 7, or 21 days post-immunization (dpi). (b) Plasma logarithmic changes (Ln) in antibody concentration over time (days) in APP23 and wild-type mice. For Beta1 in the tg group, there were 1 and 4 mice below detection at 7 and 21 dpi, respectively. (c) Calculated elimination rate (kel) and half-life (t1/2) of antibody elimination in plasma suggest binding of Beta1 and m266 to blood Aβ, thus accelerating removal from blood, whereas no such acceleration is seen for cmAdu. Antibody titer assays were optimized for best detection of different monoclonal antibodies (see Methods). To exclude the possibility that different assay conditions affected the results, Beta1 titers were also measured with the cmAdu setup; however, similar accelerated antibody elimination was observed in tg vs wt mice (Beta1: t1/2= 4.7 and 1.8, respectively). All data are represented as group means ± SEMs. No detectable titers of Aβ antibodies were found in untreated six-month-old or Ctrl-antibody-treated APP23 mice (see extended Data Fig. 4).
Figure 5.
Figure 5.. Targeting pre-amyloid Aβ seeds leads to long-lasting reduction of cerebral β-amyloidosis.
(a) Schematic overview of long-term incubation after acute early seed removal. Six-month-old male APP23 mice received i.p. injections of either 0.5 mg Beta1, cmAducanumab (cmAdu), m266, or Ctrl antibody on 5 consecutive days. Mice were sacrificed and analyzed at 12 months of age. (b) Schematic overview of tissue processing. CSF was taken prior to perfusion and collection of tissue. The fresh-frozen left hemisphere was homogenized for biochemical analyses. Brain homogenates were extracted by Triton and subsequently with formic acid (FA). The paraformaldehyde-fixed right hemisphere was used for immunohistochemical analyses. (c) Measurement of the Triton-soluble Aβx-40 and Aβx-42 did not indicate any differences among the groups (Kruskal-Wallis-Test; Aβx-40, H(3)=1.718; P=0.6329; Aβx-42, H(3)=0.4967; P=0.9196). In contrast, FA-soluble Aβx-40 and Aβx-42 appeared to be reduced in cmAdu-treated mice although the reduction did not reach statistical significance (one-way ANOVA: Aβx-40, F(3,29)=2.360, P=0.0920; Aβx-42, F(3,29)=3.0170, P=0.0459, subsequent post hoc Dunnettś multiple comparisons test did not indicate a difference between the combined Ctrl1/2 and any treatment group). All groups initially had n=10 mice (each of the two controls n=5). During the 6 month-incubation period, one animal in each group died while in the m266 group three animals died. The final numbers were n=4 [Ctrl1], 4 [Ctrl2], 9 [Beta1], 9 [cmAdu], 7 [m266]. (d) Stereological quantification of Aβ-immunostaining (CN6 antibody) in the cortex revealed that Aβ load was significantly lower in mice receiving early cmAdu treatment compared to controls (one-way ANOVA: F(3,29)=3.613; P=0.0248, post hoc Dunnettś multiple comparisons test: P=0.0223). An even larger reduction was found for plaque number (ANOVA: F(3,29)=12.35; P<0.0001; post hoc Dunnettś multiple comparisons test: P=0.0007). Plaque size was also reduced, but to a lesser extent (ANOVA: F(3,29)=3.6320; P=0.0247; post hoc Dunnettś multiple comparisons test: P=0.0268). The amount of CAA was not significantly different in antibody-treated mice, although two mice treated with cmAdu and three treated with m266 had relatively high CAA counts. (e) Immunostaining with the Aβ-specific CN6 antibody along with Congo Red. This staining was done for all the mice in panel c. Representative sections from a 12-month-old APP23 mouse are shown for each experimental group. Scale bars = 500 μm (inserts = 20μm). (f) Staining of amyloid with the combination of two (qFTAA and hFTAA) luminescent conjugated oligothiophenes (LCOs). The number of total LCO-positive cortical plaques was again lower in cmAdu-treated mice vs controls (Kruskal-Wallis-Test: H(3)=19,11; P=0.0003; Dunn’s multiple comparison P=0.0013). The mean fluorescence emission pattern of plaque cores is shown in the middle panel and the ratio at 502/588nm was quantified (right panel; ANOVA: F(3,29)=13.10; P<0.0001; post hoc Dunnettś multiple comparisons test Ctrl2 vs cmAdu: P=0.037; Ctrl vs m266: P=0.004). Note the red-shifted plaques for cmAdu vs. Ctrl2. While the spectral changes in the cmAdu-treated mice are consistent with less mature (i.e. younger) plaques, the reason for the blue-shifted plaques after m266 treatment is not clear. Scale bar = 25 μm. All data are represented as group means ± SEMs; *P < 0.05; **P<0.01; ***P < 0.001.
Figure 6.
Figure 6.. Targeting pre-amyloid Aβ seeds reduces pTau-positive neuronal dystrophy and microglial activation.
The same animals as in Fig. 5 are presented, n=4 [Ctrl1], 4 [Ctrl2], 9 [Beta1], 9 [cmAdu], 7 [m266]. (a) All Congo red-positive plaques (red) were surrounded by pTau (AT8)-positive dystrophic neurites (punctate black staining). Shown is the cortex of a Ctrl2- and a cmAdu-treated mouse. Scale bar = 100 μm. (b) The area of the pTau-positive staining over the area of the plaque within 10μm (blue line), 20μm (red line), and 50μm (black line) from the outer edge of the congophilic plaque was quantified. No difference between the treatment groups was found, suggesting similar neurotoxicity of plaques among the treatment groups. (c) In contrast, a substantial reduction of the total cortical pTau-positive neuritic dystrophy was found in cmAdu- compared to Ctrl1/2-treated mice, consistent with the reduced plaque-load of the cmAdu-treated mice. Shown is the area of AT8-positive boutons per plaque area (here shown within the 10μm-wide space adjacent to the core) multiplied by the total number of cortical Congo red-positive plaques (Kruskal-Wallis-Test: H(3)=16.90, P=0.0007, post hoc Dunn’s multiple comparison test, P=0.0061). (d) Iba-1-immunostained microglia around congophilic plaques in the cortex of a Ctrl2- and cmAdu-treated mouse (left panels) and the categorized and colored microglia based on size (red: area <50μm2 [resting]; yellow: 50μm2 ≤ area < 80μm2 [resting-intermediate]; green: 80μm2 ≤ area < 120μm2 [activated]; blue: area ≥ 120μm2 [activated, plaque-associated]) (right panels). Blue microglia are hypertrophic and activated and largely intimately associated with the plaques, whereas green microglia mainly appeared in the more distant vicinity of plaques. Scale bar=100 μm. Schematic drawing of microglia was created with BioRender.com. (e) Quantification of the microglia categorized by size. A significant reduction of the activated, plaque-associated microglia (blue) in cmAdu- vs Ctrl1/2-treated mice was found (ANOVA: F(3,29)=5.982, P=0.0026, post hoc Dunnett’s multiple comparison test, P=0.0245), and a trend toward reduction was observed for the more peripheral activated microglia (green) P=0.0529). (f) Individual microglia around congophilic plaques were identified via Pu.1-nuclear staining. Scale bar=25 μm. The number of microglia per plaque area was not significantly changed (ANOVA: F(3,29)=1.524, P=0.2291), whereas (g) the total number of cortical plaque-associated (and thus activated) microglia after cmAdu-treatment was reduced. Shown is the microglial number per plaque area multiplied by the total number of cortical Congo red-positive plaques (ANOVA: F(3,29)=7.516; P=0.0007; post hoc Dunnettś multiple comparisons test: P=0.0049). All data are represented as group means ± SEMs; *P < 0.05; **P<0.01.

References

    1. Jack CR et al. NIA-AA Research Framework: Toward a biological definition of Alzheimer’s disease. Alzheimer’s Dement. 14, 535–562 (2018). - PMC - PubMed
    1. Long JM & Holtzman DM Alzheimer Disease: An update on pathobiology and treatment strategies. Cell 179, 312–339 (2019). - PMC - PubMed
    1. Panza F, Lozupone M, Seripa D & Imbimbo BP Amyloid-β immunotherapy for Alzheimer disease: Is it now a long shot? Ann. Neurol 85, 303–315 (2019). - PubMed
    1. McDade E et al. Longitudinal cognitive and biomarker changes in dominantly inherited Alzheimer disease. Neurology 91, 1295–1306 (2018). - PMC - PubMed
    1. Villemagne VL, Doré V, Burnham SC, Masters CL & Rowe CC Imaging tau and amyloid-β proteinopathies in Alzheimer disease and other conditions. Nat. Rev. Neurol 14, 225–236 (2018). - PubMed

Publication types

MeSH terms