. 2021 Feb;17(2):161-168.
doi: 10.1038/s41589-020-00695-1. Epub 2020 Nov 16.

YY1 interacts with guanine quadruplexes to regulate DNA looping and gene expression

Affiliations

YY1 interacts with guanine quadruplexes to regulate DNA looping and gene expression

Lin Li et al. Nat Chem Biol. 2021 Feb.

Abstract

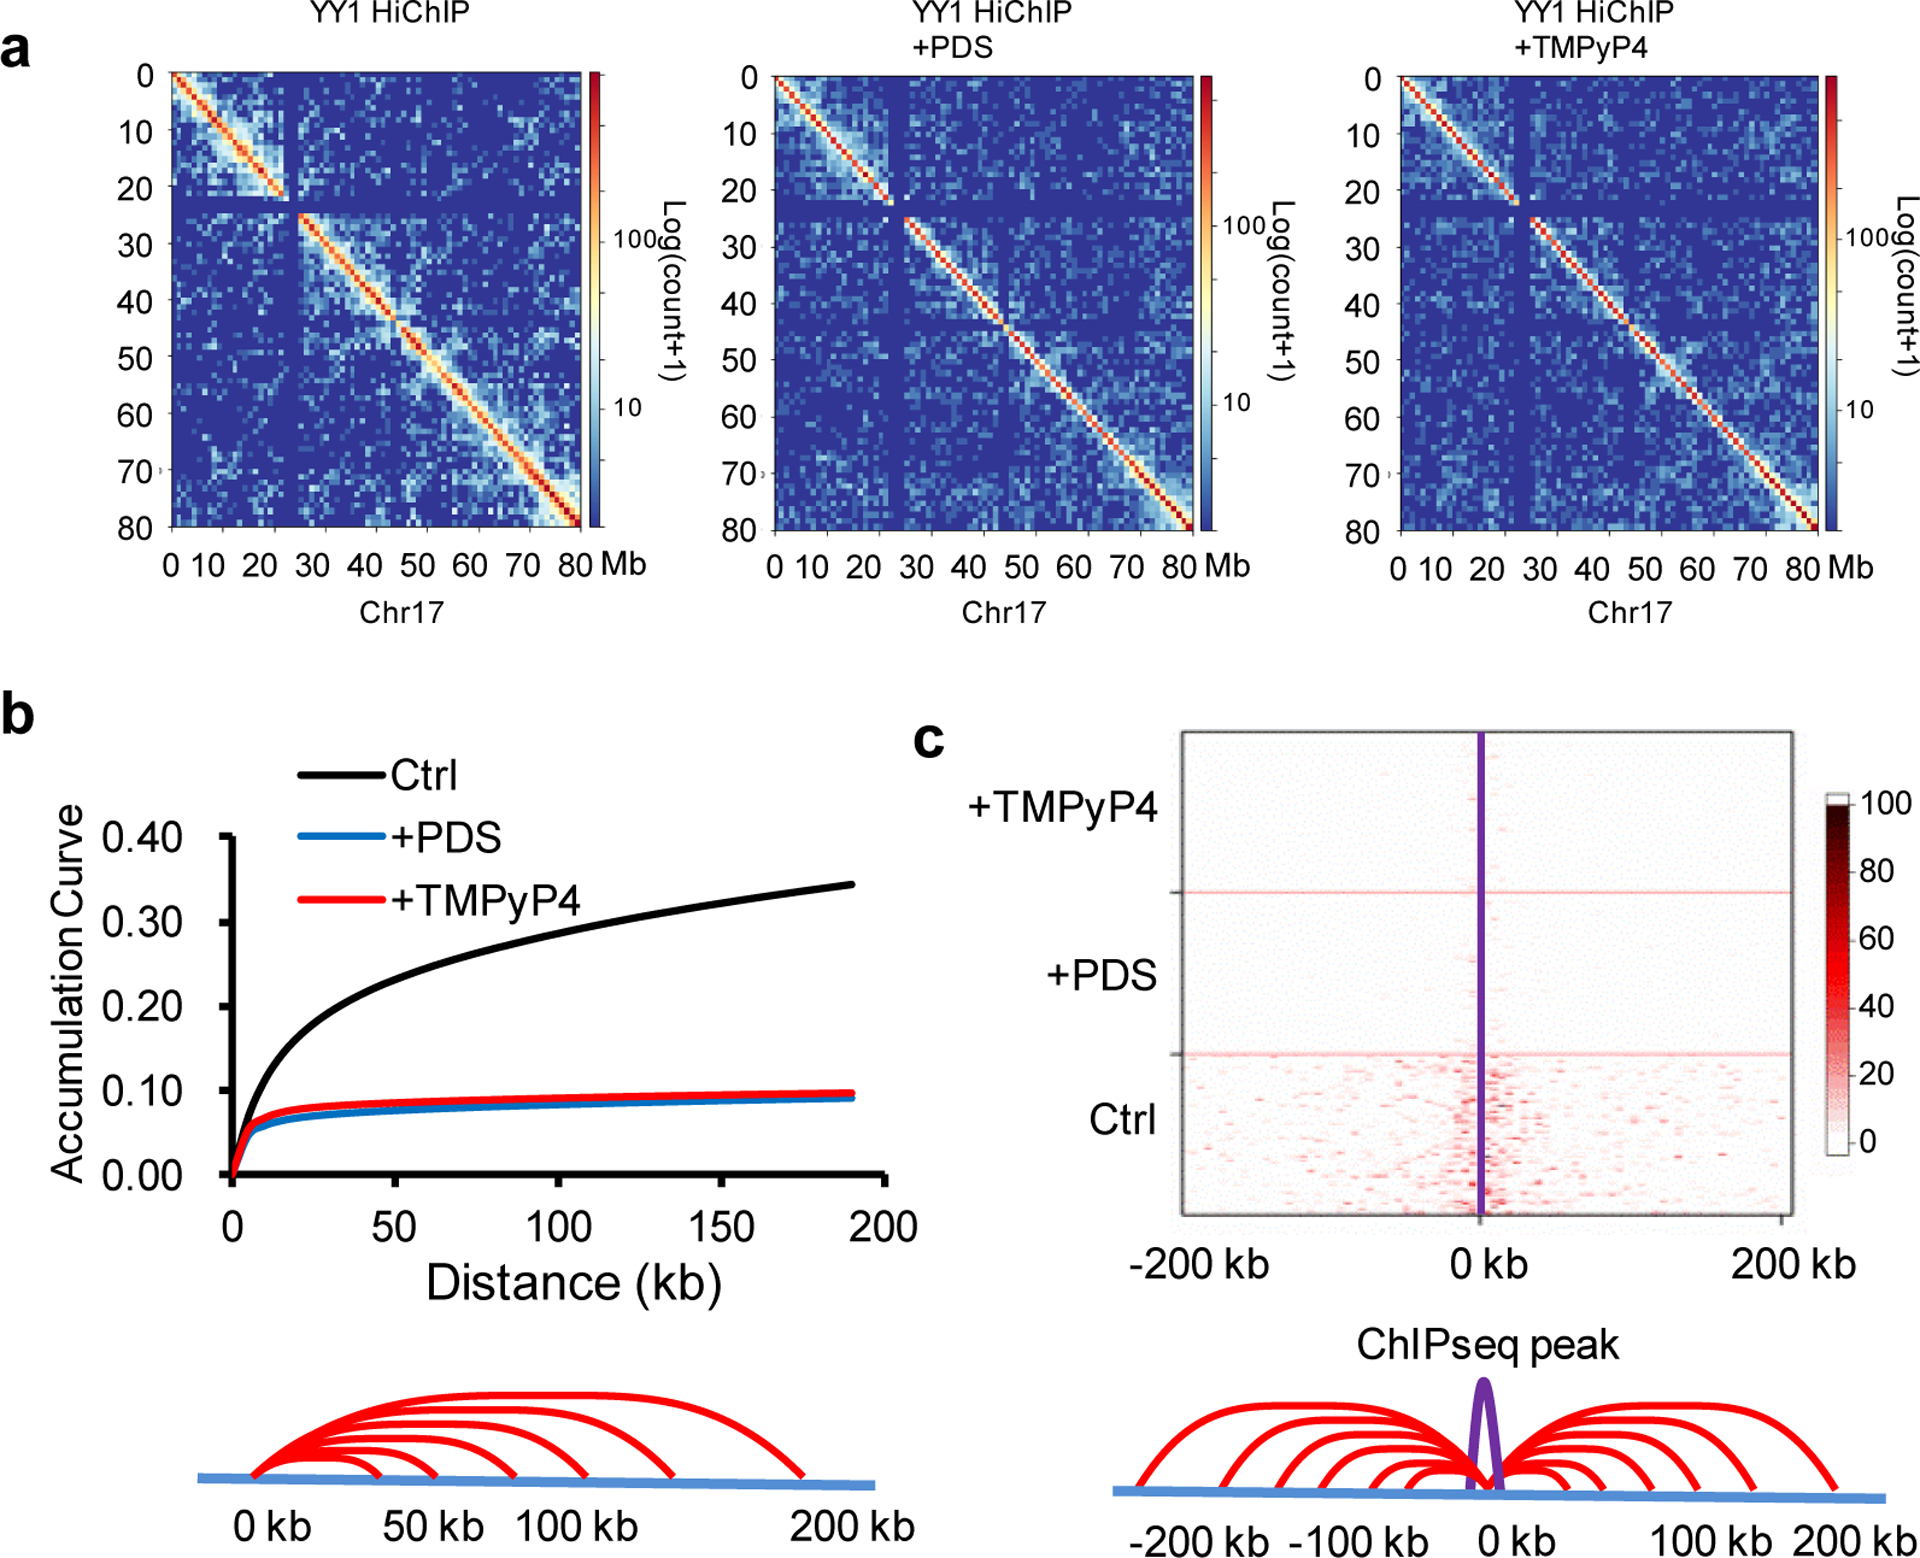
The DNA guanine quadruplexes (G4) play important roles in multiple cellular processes, including DNA replication, transcription and maintenance of genome stability. Here, we showed that Yin and Yang 1 (YY1) can bind directly to G4 structures. ChIP-seq results revealed that YY1-binding sites overlap extensively with G4 structure loci in chromatin. We also observed that the dimerization of YY1 and its binding with G4 structures contribute to YY1-mediated long-range DNA looping. Displacement of YY1 from G4 structure sites disrupts substantially the YY1-mediated DNA looping. Moreover, treatment with G4-stabilizing ligands modulates the expression of not only those genes with G4 structures in their promoters, but also those associated with distal G4 structures that are brought to close proximity via YY1-mediated DNA looping. Together, we identified YY1 as a DNA G4-binding protein, and revealed that YY1-mediated long-range DNA looping requires its dimerization and occurs, in part, through its recognition of G4 structure.


Conflict of interest statement

Declaration of Interests

The authors declare that they have no conflicts of interest with the contents of this article.

Figures

Extended Data Fig. 1
Extended Data Fig. 1. Proteome-wide identification of G quadruplex-binding proteins.
Volcano plots showing the quantification results of G quadruplex-binding proteins identified from SILAC-based interaction screening. The −Log10(P value) was plotted against the log2(ratio G4/M4). YY1 is labeled in red.
Extended Data Fig. 2
Extended Data Fig. 2. Circular dichroism (CD) spectra of the three G4 sequences in the absence or presence of tag-free YY1 protein.
a-c, CD spectra of cMYC G4 (a), YY1 (b) and cMYC G4-YY1 complex (c). d-f, Comparison of CD spectra for G4 probes in the presence or absence of YY1 protein. The CD spectra for the G4 probes in the presence of YY1 protein were obtained by subtracting the CD spectrum of the YY1 protein from the composite spectra of the protein-G4 DNA complexes.
Extended Data Fig. 3
Extended Data Fig. 3. Zinc finger domain of YY1 is essential, but not sufficient for the specific binding toward G4 structure.
a, A schematic diagram depicting the domain structure of YY1 protein. b-e, Fluorescence anisotropy for monitoring the bindings of mutant (YY1C360S) and truncated (YY11–382, YY1231–414, and YY1293–414) YY1 proteins with hTEL G4 and the corresponding M4 DNA probes. The data represent the mean ± S.E.M. of results obtained from 3 independent experiments.
Extended Data Fig. 4
Extended Data Fig. 4. Statistical analyses of YY1 ChIP-Seq and BG4 ChIP-Seq data.
a, The ChIP-seq signal enrichment of YY1 ChIP-Seq and BG4 ChIP-Seq based on the overlapped peaks for the two datasets. The YY1 ChIP-Seq and BG4 ChIP-Seq average signal enrichments are plotted against the BG4 overlapped peaks. b, Analysis of peak width distribution for YY1 ChIP-seq and BG4 ChIP-seq data.
Extended Data Fig. 5
Extended Data Fig. 5. Unwinding of G4 structures with the overexpression of BLM helicase disrupts the YY1-mediated DNA looping.
a-b, Reads enrichment of two regions from BG4 ChIP-Seq and YY1 ChIP-Seq. The long-range DNA interactions monitored in HiChIP-PCR experiment are labeled with red arches, and the regions monitored in BG4 ChIP PCR experiments are indicated with blue triangles. c-d, BG4 ChIP and YY1 ChIP enrichments at the two sites were markedly diminished after ectopic overexpression of BLM helicase (BLM-O.E.). e, YY1-mediated DNA looping is disrupted by overexpression of BLM helicase. HiChIP-PCR quantification results of YY1-mediated DNA looping in HEK293T cells with and without the overexpression of BLM. Shown in (c-e) are mean ± S.E.M. of results obtained from 3 independent experiments. The p values were calculated by using two-tailed, unpaired Student’s t test: **, p < 0.01; ***, p < 0.001.
Extended Data Fig. 6
Extended Data Fig. 6. Analysis of YY1 dimerization and binding stoichiometry of the YY1-G4 DNA complex.
a-b, Gel filtration chromatography revealed the dimerization of YY1 and truncated YY1231–414, but not YY1293–414. c-d, The binding stoichiometry of YY1:G4 DNA was analyzed using EMSA. The stoichiometry in binding of YY1 to G4 DNA matches with the theoretical curve in 1:1 binding stoichiometry. The data represent mean ± S.E.M. from 4 independent experiments.
Extended Data Fig. 7
Extended Data Fig. 7. YY1 promotes interactions between DNA elements containing its consensus sequence motifs (Motif), G4 DNA (G4), or both.
a, A scheme depicting the in vitro proximity ligation assay for assessing the ability of YY1 to enhance DNA-DNA interactions involving G4 structures and/or YY1 consensus motifs. b, qPCR quantification results of the proximity ligation products formed between motifs, between G4 structures, and between motif and G4 structure in the presence or absence of YY1 protein. c, qPCR quantification results revealed the inability of YY1 in promoting the ligation between M4 (i.e. mutated sequence of G4 that can no longer fold into G4 structure) and G4, motif, or M4. d, qPCR quantification results of the proximity ligation products formed between G4 structures in the absence or presence of PDS or TMPyP4. The data represent mean ± S.E.M. of results from three independent experiments.
Extended Data Fig. 8
Extended Data Fig. 8. Dimerization of YY1 promotes long-range DNA looping.
a, SDS-PAGE for monitoring the purified recombinant truncated forms of YY1 that is incapable of dimerization, but able to discriminate G4 structure from single-stranded DNA. b, Gel filtration chromatography revealed that YY1Δ231–290 (calculated monomer MW: 38.4 kDa) exists as a monomer, and GST-YY1Δ231–290 is present as a dimer (calculated monomer MW: 66.3 kDa). c-d, Fluorescence anisotropy for monitoring the binding of YY1Δ231–290 and GST-YY1Δ231–290 protein with G4 structure and the corresponding mutated sequence (M4) derived from the MYC promoter. e, Proximity ligation assay showing that YY1 and GST-YY1Δ231–290, but not YY1Δ231–290, is capable of promoting ligation between G4 DNA sequences.
Extended Data Fig. 9
Extended Data Fig. 9. Regulation of gene expression by YY1-promoter G4 interactions.
a-c, Quantification of mRNA expression levels of MYC (a), SLC25A28 (b) and TMEM145 (c) genes after shRNA-mediated knockdown of YY1 and/or PDS/TMPyP4 treatment. Top of each panel shows read enrichments from BG4 ChIP-Seq and YY1 ChIP-Seq. The data represent mean ± S.E.M. of results from three independent experiments.
Extended Data Fig. 10
Extended Data Fig. 10. YY1-G4 binding participates in transcription regulation of EHD3 genes through long-range DNA looping.
a, Read enrichments obtained from BG4 ChIP-seq and YY1 ChIP-Seq experiments. b, Normalized interaction frequency between the two sites linked with a red arch in a in HEK293T cells with or without PDS/TMPyP4 treatment, as captured by YY1 HiChIP. c, Quantification results for the mRNA expression levels of EHD3 genes in HEK293T cells after knockdown of YY1 and/or with PDS/TMPyP4 treatment. The data represent mean ± S.E.M. of results from three independent experiments.
Fig. 1.
Fig. 1.
Tag-free YY1 binds selectively with G quadruplex DNA. a-c, Fluorescence anisotropy for monitoring the binding of YY1 protein with G4 structures and the corresponding mutated sequences derived from the promoters of KIT (a) and MYC (b) genes, or the human telomere (c). The data in (a-c) represent mean ± S.E.M. from 3 independent experiments. d-f, EMSA results showing the binding of YY1 towards G4 structure without treatment (d) or upon treatment with different concentrations of PDS (e) or TMPyP4 (f). The EMSA experiments were performed independently for three times with similar results.
Fig. 2.
Fig. 2.
YY1 interacts with G4 structure in cells. a, Comparisons of YY1 ChIP-Seq data with BG4 ChIP-Seq data. b, A Venn diagram showing the overlap between YY1 ChIP-Seq and BG4 ChIP-Seq peaks. c, Comparison of YY1 ChIP-Seq data acquired for cells with or without PDS/TMPyP4 treatment. The p values were calculated by using the hypergeometric test. d-e, Enrichment ratios of YY1 ChIP-Seq peaks containing different motifs after treatment with PDS or TMPyP4. BG4, peaks overlapped with BG4 ChIP-Seq peaks; Y, peaks containing YY1 consensus motif; BG4Y, peaks containing both YY1 consensus motif and overlapped with BG4 ChIP-Seq. The data in (d-e) represent mean ± S.E.M. In d, n = 370, 1194 and 638 for BG4, Y, and BG4Y, respectively; In e, n = 378, 1198 and 639 for BG4, Y and BG4Y, respectively. In d-e, the two-tailed Student’s t test was used to calculate the p values. ***, p < 0.001. p = 3.1E-15 for Y, and p = 1.6E-20 for BG4Y in d; p = 2.0E-6 for Y, and p = 5.0E-11 for BG4Y in e. f-g, Chromatin localization of YY1 after PDS (f) or TMPyP4 (g) treatment, where the experiments were performed independently for three times with similar results.
Fig. 3.
Fig. 3.
Disruption of YY1’s binding with G4 structure attenuates YY1-mediated DNA looping. a, HiChIP interaction map of chromosome 17 in 293T cells that were untreated (left), or treated with PDS (middle) or TMPyP4 (right). b, Statistical analysis of HiChIP interaction distance of 5–200 kb after PDS or TMPyP4 treatment. c, A heat map depicting the interactions between YY1 ChIP-Seq peaks and the surrounding region (−200 kb to 200 kb) after PDS or TMPyP4 treatment.
Fig. 4.
Fig. 4.
YY1-G4 interaction and dimerization of YY1 promote long-range DNA looping. a, A schematic diagram showing the design of CRISPR/Cas9-based editing of an endogenous G4-forming sequence. b-c, BG4 ChIP and YY1 ChIP enrichments of the site were substantially attenuated after mutation of the G4 sequence. d, YY1-mediated DNA looping was disrupted by mutation of the G4 sequence. Shown are the HiChIP-qPCR quantification results of YY1-mediated DNA looping in HEK293T cells with or without mutation of G4 sequence. e, A schematic diagram depicting the truncated YY1 protein that is defective in dimerization. f, ChIP enrichments for YY1Δ231–290 and GST-YY1Δ231–290 at Sites 1 and 2. Sites 1 and 2 are the same sites as described in Extended Data Fig. 5. g, HiChIP-qPCR quantification results of YY1Δ231–290- and GST-YY1Δ231–290-mediated DNA looping. The data represent mean ± S.E.M. of results obtained from 3 independent experiments. The p values were calculated by using two-tailed Student’s t test: **, p < 0.01. ***, p < 0.001. p = 0.0012 in b; p = 0.0015 in c; p = 0.0011 in d; p = 0.000031 and 0.0013 for YY1 and GST-YY1Δ231–290, respectively, for site 1, and p = 0.0000034 and p = 0.0047 for YY1 and GST-YY1Δ231–290, respectively, for site 2 in g.
Fig. 5.
Fig. 5.
Regulation of gene expression by YY1-promoter G4 interactions. a-d, Dot plot showing the correlation of gene expression between PDS-treated and shYY1-treated or shYY1+PDS-treated cells. Shown are average ratios of RNA-seq results from two biological replicates. n = 14707 genes for Pearson correlation calculation in a-d. e-g Quantification of mRNA expression levels of MANF (e), PDHB (f) and PGBD5 (g) genes in HEK293T cells with shRNA-mediated knockdown of YY1 and/or after PDS/TMPyP4 treatment. Top of each panel shows read enrichments from BG4 ChIP-Seq and YY1 ChIP-Seq. The data represent mean ± S.E.M. of results from three independent experiments.
Fig. 6.
Fig. 6.
YY1-G4 binding participates in transcription regulation of the TRMT12 gene through long-range DNA looping. a, Read enrichments obtained from BG4 ChIP-seq and YY1 ChIP-Seq results. b, Normalized interaction frequency involving the sites linked with a red arch in a in HEK293T cells with or without PDS or TMPyP4 treatment, as captured by YY1 HiChIP. c, Quantification of mRNA expression levels of TRMT12 in HEK293T cells after knockdown of YY1 and/or with PDS/TMPyP4 treatment. The data represent mean ± S.E.M. of results from three independent experiments.

Comment in

  • Bringing distant DNA together.
    Zhao H, Kwok CK. Zhao H, et al. Nat Chem Biol. 2021 Feb;17(2):125-126. doi: 10.1038/s41589-020-00705-2. Nat Chem Biol. 2021. PMID: 33483700 No abstract available.

References

    1. Bochman ML, Paeschke K & Zakian VA DNA secondary structures: stability and function of G-quadruplex structures. Nat. Rev. Genet 13, 770–780 (2012). - PMC - PubMed
    1. Hansel-Hertsch R, Di Antonio M & Balasubramanian S DNA G-quadruplexes in the human genome: detection, functions and therapeutic potential. Nat. Rev. Mol. Cell Biol 18, 279–284 (2017). - PubMed
    1. Mao SQ, et al. DNA G-quadruplex structures mold the DNA methylome. Nat. Struct. Mol. Biol 25, 951–957 (2018). - PMC - PubMed
    1. Huppert JL & Balasubramanian S Prevalence of quadruplexes in the human genome. Nucleic Acids Res 33, 2908–2916 (2005). - PMC - PubMed
    1. Biffi G, Tannahill D, McCafferty J & Balasubramanian S Quantitative visualization of DNA G-quadruplex structures in human cells. Nat. Chem 5, 182–186 (2013). - PMC - PubMed

Publication types