. 2020 Nov;2(11):1265-1283.
doi: 10.1038/s42255-020-00305-3. Epub 2020 Nov 16.

Senescent cells promote tissue NAD+ decline during ageing via the activation of CD38+ macrophages

Affiliations

Senescent cells promote tissue NAD+ decline during ageing via the activation of CD38+ macrophages

Anthony J Covarrubias et al. Nat Metab. 2020 Nov.

Erratum in

  • Author Correction: Senescent cells promote tissue NAD+ decline during ageing via the activation of CD38+ macrophages.
    Covarrubias AJ, Kale A, Perrone R, Lopez-Dominguez JA, Pisco AO, Kasler HG, Schmidt MS, Heckenbach I, Kwok R, Wiley CD, Wong HS, Gibbs E, Iyer SS, Basisty N, Wu Q, Kim IJ, Silva E, Vitangcol K, Shin KO, Lee YM, Riley R, Ben-Sahra I, Ott M, Schilling B, Scheibye-Knudsen M, Ishihara K, Quake SR, Newman J, Brenner C, Campisi J, Verdin E. Covarrubias AJ, et al. Nat Metab. 2021 Jan;3(1):120-121. doi: 10.1038/s42255-020-00328-w. Nat Metab. 2021. PMID: 33303985 No abstract available.

Abstract

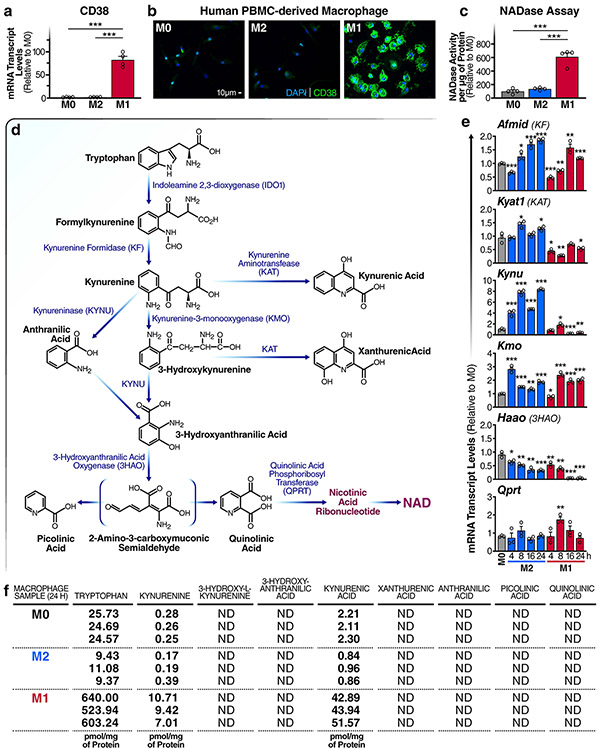
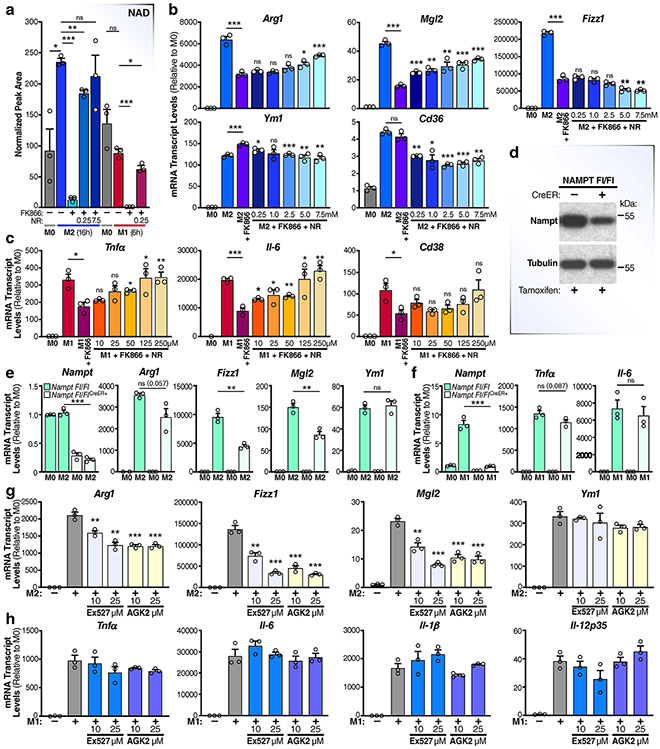
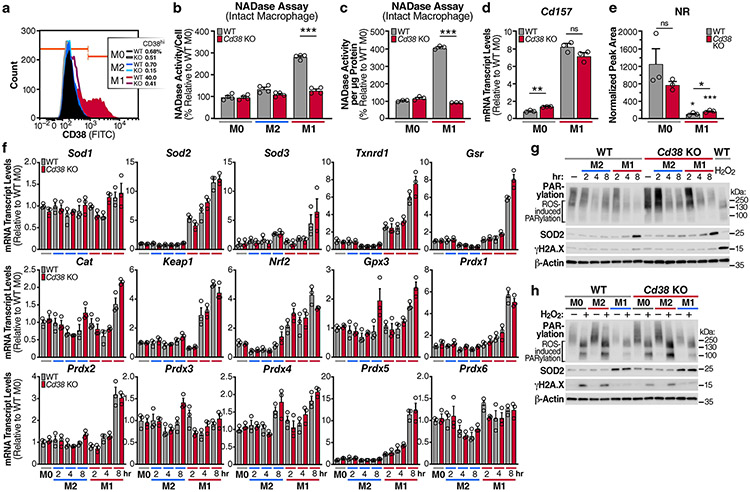
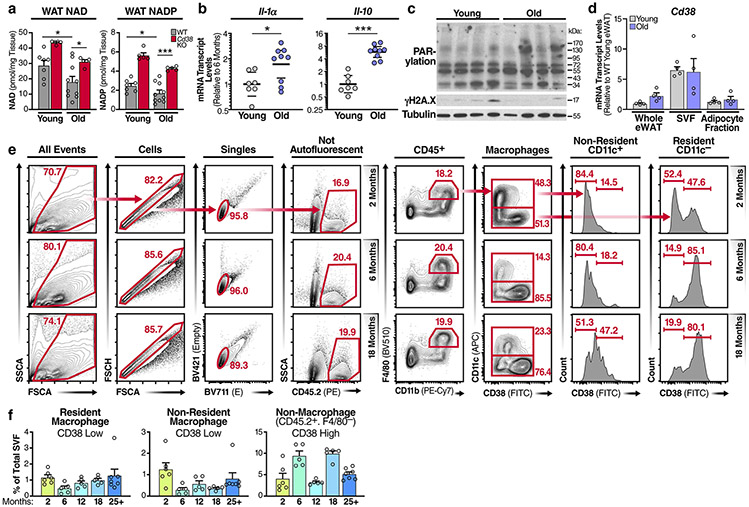
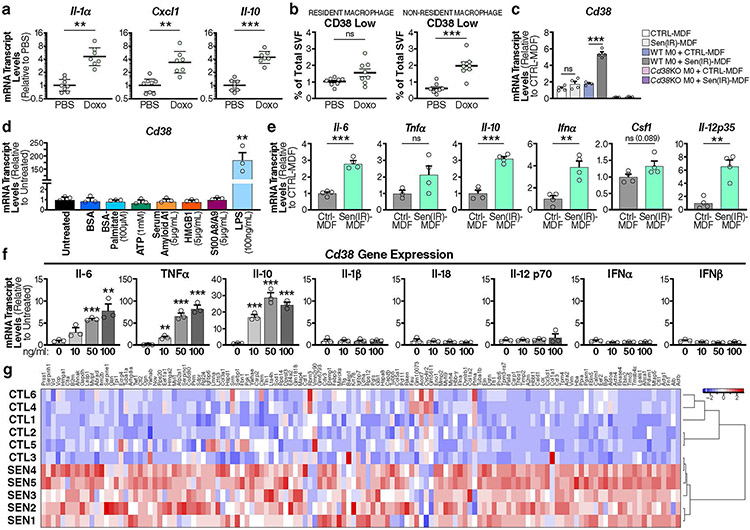
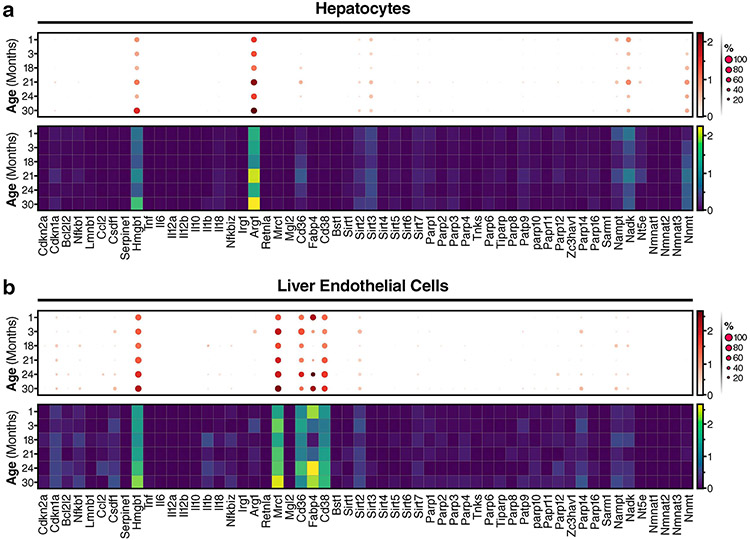
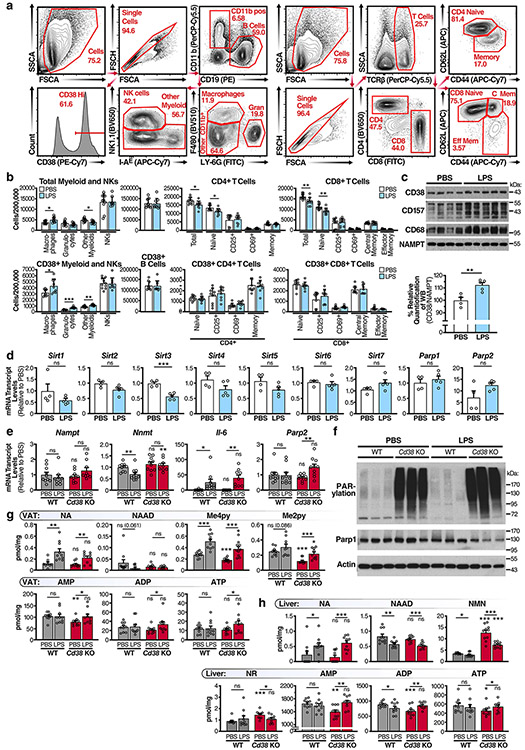
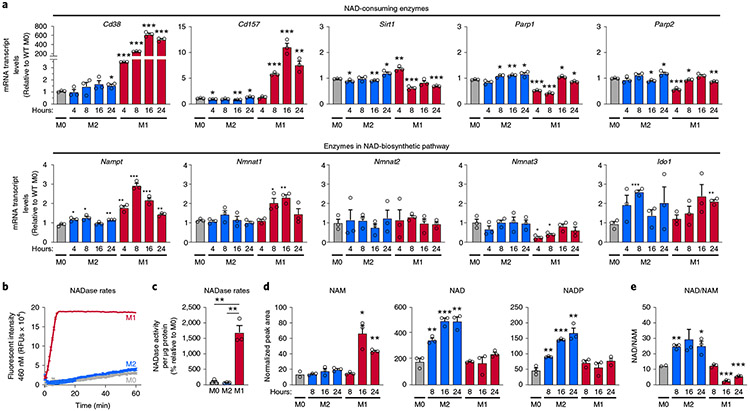
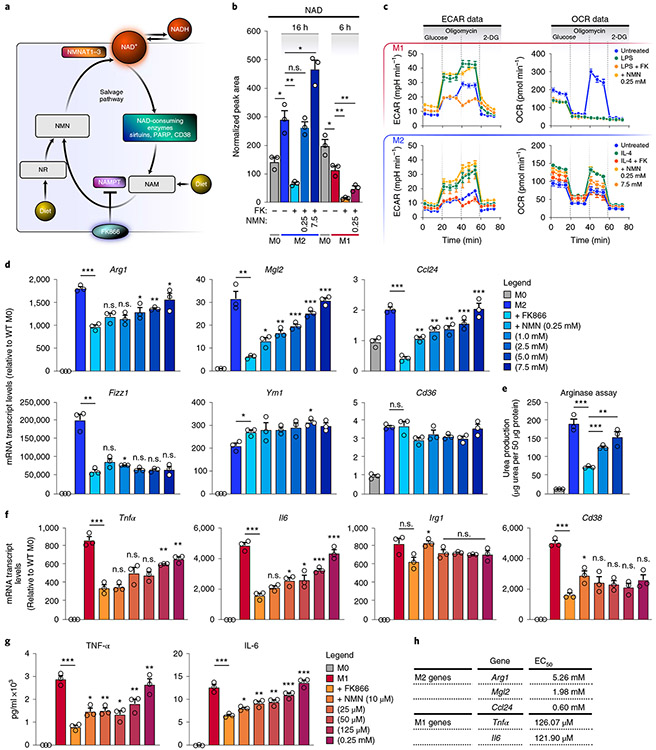
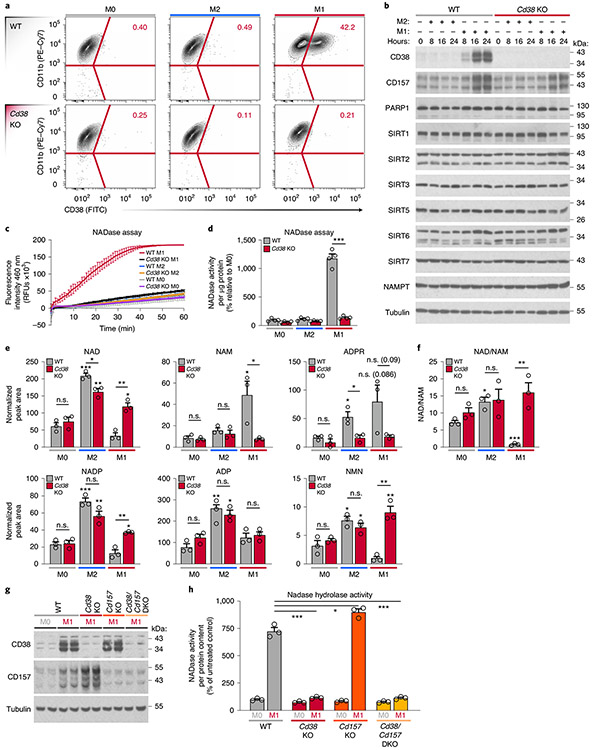
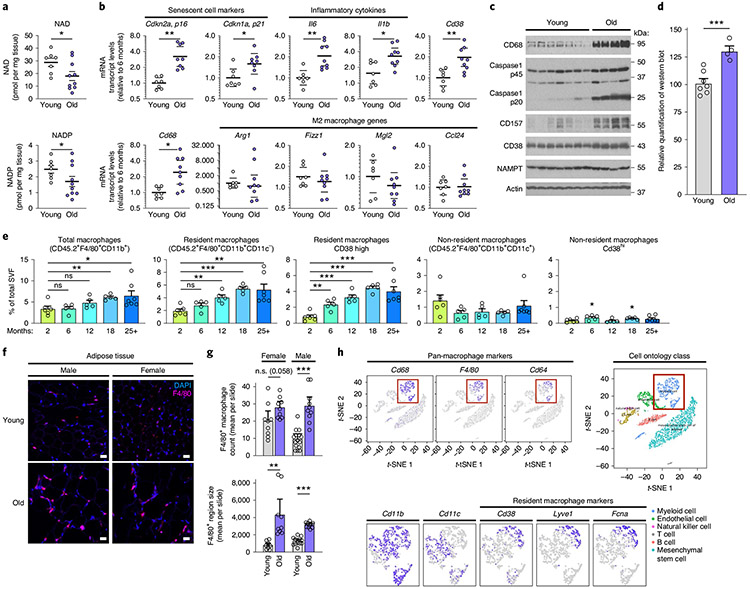
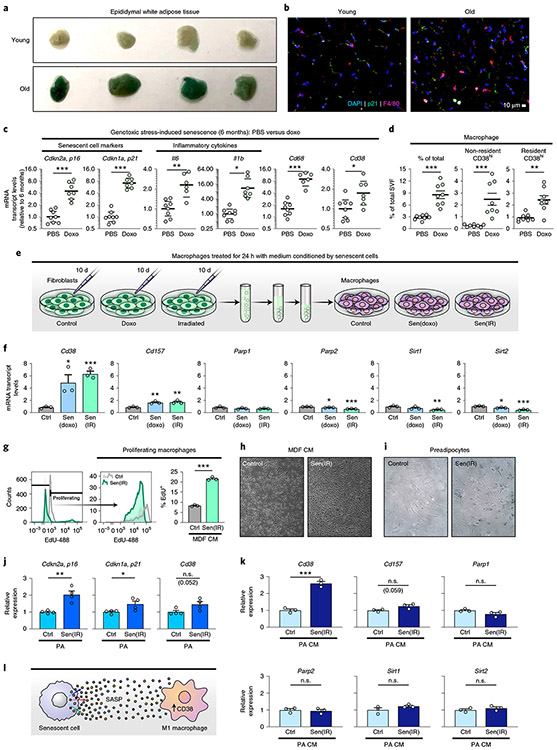
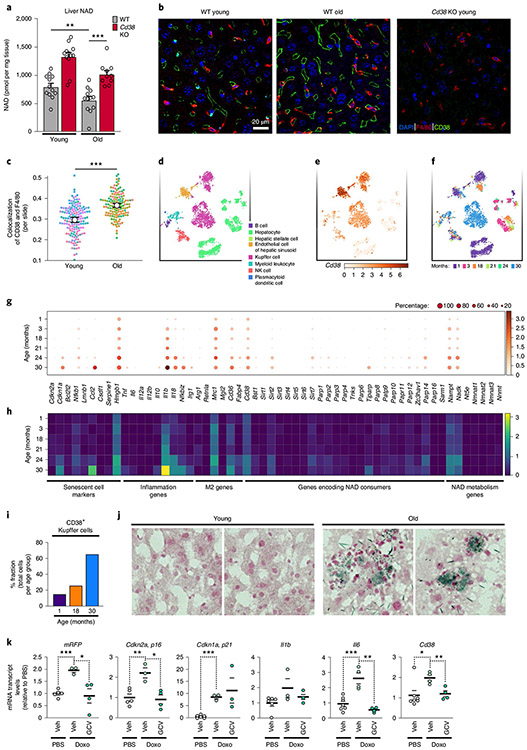
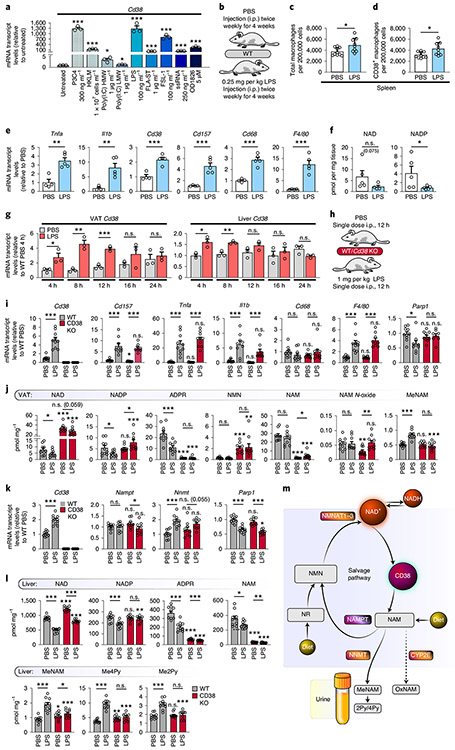
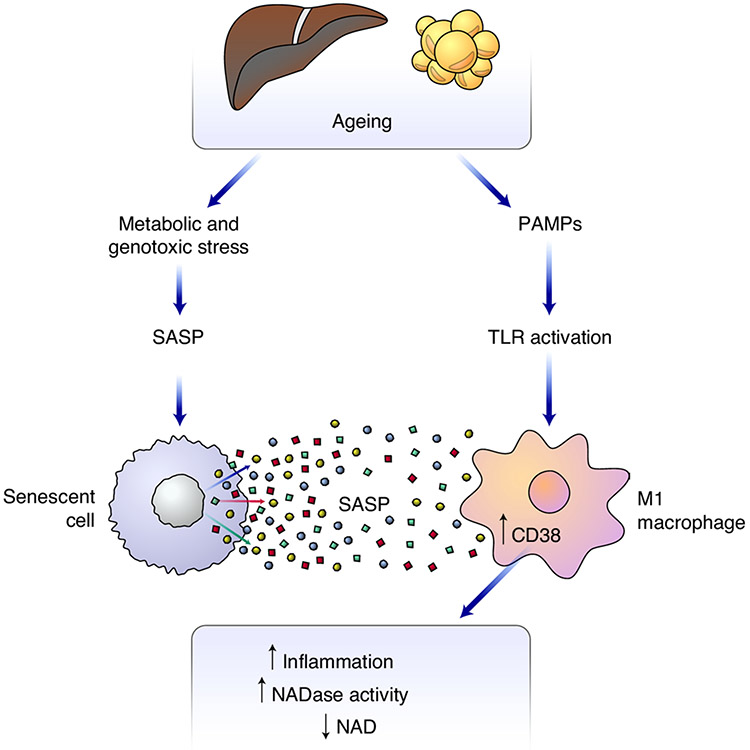
Declining tissue nicotinamide adenine dinucleotide (NAD) levels are linked to ageing and its associated diseases. However, the mechanism for this decline is unclear. Here, we show that pro-inflammatory M1-like macrophages, but not naive or M2 macrophages, accumulate in metabolic tissues, including visceral white adipose tissue and liver, during ageing and acute responses to inflammation. These M1-like macrophages express high levels of the NAD-consuming enzyme CD38 and have enhanced CD38-dependent NADase activity, thereby reducing tissue NAD levels. We also find that senescent cells progressively accumulate in visceral white adipose tissue and liver during ageing and that inflammatory cytokines secreted by senescent cells (the senescence-associated secretory phenotype, SASP) induce macrophages to proliferate and express CD38. These results uncover a new causal link among resident tissue macrophages, cellular senescence and tissue NAD decline during ageing and offer novel therapeutic opportunities to maintain NAD levels during ageing.


Figures

Extended Data Fig. 1 ∣
Extended Data Fig. 1 ∣. CD38 expression in human M1 macrophages and analysis of the de novo NAD pathway in BMDMs.
a, mRNA levels of CD38 in human peripheral blood monocytes (PBMC)-derived macrophages treated with recombinant human IL-4 (M2) or LPS (M1) for 18 hours. Representative data from one of three patient samples. (n = 4 independent biological experiments) b, Immunofluorescence of human PBMC derived macrophages stimulated as described above using an anti-human CD38 antibody (Green) and nuclei with DAPI (Blue). Scale bars represents 10μm. Analyzed in PBMCs derived from one patient. c, NADase activity in human PBMC-derived macrophages treated with recombinant human IL-4 (M2) or LPS (M1) for 18 hours. Shown is the mean of two separate experiments from different donors with 2 replicates each. d, Schematic of the de novo NAD synthesis pathway. e, mRNA levels of de novo NAD synthesis pathway enzymes. f, Quantification of tryptophan metabolites measured by LC-MS in M0, M2 and M1 mouse BMDMs activated for 24 hours. ND=not detected. Data shows the mean ± SEM n=3 independent experiments except in A and B. Statistical significance indicated as *P<0.05, **P<0.01, and ***P<0.001; two-sided Student’s t-test.
Extended Data Fig. 2 ∣
Extended Data Fig. 2 ∣. Analysis of the role of the NAM-salvage pathway and sirtuins in macrophage activation and polarization.
a, NAD levels quantified by LC-MS in M0, M1 and M2 BMDMs pre-treated or not with 50 nM FK866 and NR for 6 hours prior to stimulation with LPS for an additional 6 hours or IL-4 for 16 hours. b, mRNA levels of M2 genes in BMDMs pre-treated or not with FK866 and NR for 6 hours prior to stimulation with IL-4 for 16 hours. All statistical comparisons are relative to M2 + FK866. c, mRNA levels of M1 genes in BMDMs pre-treated or not with FK866 and NR for 6 hours prior to stimulation with LPS for 6 hours. All statistical comparisons are relative to M1 + FK866. d, Western analysis of Nampt Fl/Fl CreER and Nampt Fl/Fl BMDMs treated with 1 ug/ml tamoxifen. e, mRNA levels of M2 genes in Nampt Fl/Fl CreER and Nampt Fl/Fl BMDMs treated with IL-4 for 16 hours. f, mRNA levels of M1 genes in Nampt Fl/Fl CreER and Nampt Fl/Fl BMDMs treated with LPS for 6 hours. g, mRNA levels of M2 genes in WT BMDMs pretreated with the indicated concentration of the sirtuin inhibitors Ex527 and AGK2 for 30 minutes prior to stimulation with IL-4 for 16 hours. All statistical comparisons are relative to M2. h, mRNA levels of M1 genes in WT BMDMs pretreated with the indicated concentration of the sirtuin inhibitors Ex527 and AGK2 for 30 minutes prior to stimulation with LPS for 6 hours. All statistical comparisons are relative to M1. Data show the mean ± SEM. (n=3 independent experiments). Statistical significance defined as *P<0.05, **P<0.01, and ***P<0.001; two-sided Student’s t-test.
Extended Data Fig. 3 ∣
Extended Data Fig. 3 ∣. Heightended NADase activity in M1 macrophages is CD38 dependent and PARP1 independent.
a, Flow cytometry results comparing CD38 surface staining in naive (M0) WT and Cd38 KO BMDMs or BMDMs treated with IL-4 (M2) and LPS (M1) for 16 hours. b-c, NADase activity measured with non-cell permeable εNAD in intact M0, M2, and M1 WT and Cd38 KO BMDMs activated for 16 hours relative to cell number (B) and protein content (C). d, mRNA levels of Cd157 in M0 and M1 WT and Cd38 KO BMDMs treated for 16 hours. e, LC-MS quantification of NR in M0 and M1 WT and Cd38 KO BMDMs treated for 16 hours. f, mRNA levels of anti-oxidant genes in WT and Cd38 KO BMDMs treated with IL-4 (M2) and LPS (M1) for the indicated intervals. g, Western analysis of PARP activity (PARylation) and DNA damage (γH2AX) in WT and Cd38 KO BMDMs treated with IL-4 (M2) and LPS (M1) for the indicated intervals compared to WT MO macrophage treated with 1 mM H2O2 for 10 minutes. h, Western analysis of PARP activity (PARylation) and DNA damage (γH2AX) in WT and Cd38 KO BMDMs treated with IL-4 (M2) and LPS (M1) for 8 hours prior to treatment with 1 mM H2O2 for 10 minutes. Data show the mean ± SEM. (n= at least 3 independent experiments). Statistical significance indicated as *P<0.05, **P<0.01, and ***P<0.001; two-sided Student’s t-test. Unless noted with a bar, statistical comparisons are relative to the appropriate MO WT or Cd38 KO sample of the same genotype.
Extended Data Fig. 4 ∣
Extended Data Fig. 4 ∣. CD38+ resident macrophages accumulate in ageing adipose tissue.
a, LC-MS quantification of NAD in eWAT from WT young male mice (6 month) n=7 mice/group, Cd38 KO young male mice (3 month) n=5 mice/group, WT old male mice (25 month) n=10 mice/group, and Cd38 KO old male mice (26 month) n=5 mice/group. NAD concentrations are shown as pmol/mg of tissue. (same WT data from Fig. 4a). b, mRNA levels of Il-1α and IL-10 in eWAT from 6 and 25 month-old WT male mice. (WT young male mice (6 month) n=7 mice/group, WT old male mice (25 month) n=9 mice/group) c, Western analysis of adipose tissue from young (3 Month) and old (19 month) WT male mice to detect PARP activity (PARylation) and DNA damage (γH2AX). Each lane represents one mouse (young n=4 mice/group, old n=4 mice/group). d, mRNA levels of Cd38 in visceral adipose tissue, the stromal vascular fraction, and adipocyte fraction from young (3 month) and old (19 month) WT male mice. (young n=4 mice/group, old n=4 mice/group). e, Flow cytometry gating strategy to identify CD45+ immune cells from the stromal vascular fraction of eWAT. Cells were first gated on forward scatter (FSCA) vs side scatter (SSCA) to discard cell debris and dead or dying cells. Next FSCH (height) vs FSCA (Area) was used to select single cells. Single cells were then gated for auto-fluorescent using the Empty(E) BV421 vs BV711 channels (not used as antibody fluorophores) to discard cells that showed auto-fluorescence in these channels. Then CD45+ cells were selected and analyzed for CD38 and macrophage markers. Flow cytometry gating strategy to identify resident and non-resident macrophages from the stromal vascular fraction of eWAT, showing representative flow plots and histograms for the indicated ages of mice. f, Flow cytometry quantification of CD38- (low) resident macrophages, CD38- non-resident macrophages, and CD38+ (high) non-macrophage immune cells from eWAT of WT male mice for the ages shown. (2 months n=6 mice/group, 6 months n=5 mice/group, 12 months n=5 mice/group, 18 months n=5 mice/group, 25+ months n=7 mice/group) For in vivo experiments, data from individual mice are shown. Statistical significance indicated as *P<0.05, **P<0.01, and ***P<0.001; two-sided Student’s t-test.
Extended Data Fig. 5 ∣
Extended Data Fig. 5 ∣. Senescent cell burden is causally linked to increased macrophage CD38 expression.
a, mRNA levels of Il-1α, Cxcl1, and IL-10 in eWAT from 6 month-old WT male mice i.p. injected with Doxo or PBS. (PBS n=8 mice/group, Doxo n=7 mice/group) b, Quantification of CD38-low resident macrophages, and CD38-low non-resident macrophages from eWAT of 6 month-old WT male mice injected with Doxo or PBS. (PBS n=8 mice/group, Doxo n=8 mice/group). c, CD38 mRNA levels in WT and Cd38 KO BMDMs co-cultured (10:1) with non-senescent control mouse dermal fibroblasts (CTRL-MDF) or irradiated senescent MDF (Sen(IR)-MDF) for 24 hours. (n=4 independent biological experiments per condition) d, mRNA levels of Cd38 in WT BMDMs treated with the indicated DAMPs for 16 hours. (n=3 independent biological experiments per condition) e, mRNA levels of inflammatory genes in CTRL-MDF and Sen(IR)-MDF. (n=4 independent biological experiments per condition) f, mRNA levels of Cd38 in BMDMs treated with the indicated concentrations (ng/ml) of recombinant mouse cytokines for 24 hours. (n=3 independent biological experiments per condition) g, Heatmap of significantly upregulated proteins identified by mass spectrometry in conditioned media from CTRL-MDF and Sen(IR)-MDF. (n=4-6 independent biological experiments per condition). For in vivo experiments, data from individual mice are shown. Data show the mean ± SEM. (n= at least 3 independent experiments). Statistical significance indicated as *P<0.05, **P<0.01, and ***P<0.001; two-sided Student’s t-test.
Extended Data Fig. 6 ∣
Extended Data Fig. 6 ∣. Single-cell RNA sequencing analysis of inflammatory, NAD consuming, and biosynthetic genes in ageing hepatocytes and liver endothelial cells.
a, Dot-plot and heatmap of the indicated genes in liver hepatocytes based on age. Logarithmic axes, base-10. b, Dot-plot and heatmap of the indicated genes in liver endothelial cells based on age. Logarithmic axes, base-10.
Extended Data Fig. 7 ∣
Extended Data Fig. 7 ∣. LPS promotes tissue NAD decline via CD38.
a, Representative gating for the splenic leukocyte populations quantified in Fig. 7c, d and Extended Data Fig. 7a. Left six panels show gating for identification of B cells and different myeloid cells, as indicated, as well as gating for CD38-positive cells in all populations. Right six panels show gating for T cell subsets, as indicated. Red arrows indicate sequential gating, pointing from parent plots towards child plots. b, Quantification of immune cell populations and CD38+ immune cells in the spleen of 3 month-old WT male mice i.p. injected with PBS or LPS for 4 weeks, and analyzed by flow cytometry. (PBS n=10 mice/group, LPS n=9 mice/group) c, Western analysis of CD38, CD157, CD68, and NAMPT in eWAT of 3 month-old WT male mice injected with PBS or LPS for 4 weeks and Image J quantification of CD38 protein levels relative to NAMPT. Each lane represents one mouse (PBS n=4 mice/group, LPS n=5 mice/group) d, mRNA levels of NAD consuming enzymes in eWAT from 3 month-old WT male mice injected with PBS or LPS for 4 weeks. (PBS n=4 mice/group, LPS n=5 mice/group) e, mRNA levels of the indicated genes in whole eWAT from 4 month-old WT and Cd38 KO male mice injected with PBS or LPS for 12 hours. (n=10 mice/group) f, Western analysis of eWAT from 4 month-old WT and Cd38 KO male mice injected with PBS or LPS for 12 hours (n=3 mice/group). g, LC-MS quantification of NAD-related metabolites in eWAT from 4 month-old WT and Cd38 KO male mice IP injected with PBS or LPS for 12 hours. (n=10 mice/group) h, LC-MS quantification of NAD-related metabolites in liver from 4 month-old WT and Cd38 KO male mice IP injected with PBS or LPS for 12 hours. (n=10 mice/group) Data from individual mice are shown for in vivo experiments. Data show the mean ± SEM. Statistical significance indicated as *P<0.05, **P<0.01, and ***P<0.001; two-sided Student’s t-test except for 7 g and 7 h one-tailed t-test was used.
Fig. 1 ∣
Fig. 1 ∣. M1 macrophages are characterized by increased NADase activity.
a, mRNA levels of NAD-consuming and NAD-biosynthetic enzymes were measured using quantitative PCR and untreated BMDMs (M0) or BMDMs treated with IL-4 (M2) or LPS (M1) for the indicated times. b, NADase rates were measured in cell lysates from naive BMDMs (M0) or BMDMs treated with IL-4 (M2) or LPS (M1) 16 h after activation. c, Quantification of NADase activity rates. d, LC-MS was used to quantify NAD and NAD-related metabolites in naive M0, M1 and M2 BMDMs for the indicated times. e, NAD/NAM ratios from the LC-MS data above for each indicated timepoint. Data are shown as the mean ± s.e.m. (n = 3 independent biological experiments). *P < 0.05, **P < 0.01, ***P < 0.001; two-sided Student’s t-test.
Fig. 2 ∣
Fig. 2 ∣. The NAM-salvage pathway controls NAD levels to regulate macrophage activation and polarization.
a, Schematic representation of the NAM-salvage pathway. b, NAD levels were measured by LC-MS in M0, M1 and M2 BMDMs pretreated with or without 50 nM FK866 and NMN for 6 h prior to stimulation with LPS for an additional 6 h or IL-4 for 16 h. n.s., not significant. c, Seahorse assay measuring ECAR and OCR for the conditions and timepoints described in b in M1 and M2 BMDMs (n = 4 independent biological experiments per condition). 2-DG, 2-deoxy-d-glucose. d, mRNA levels of M2 genes in BMDMs pretreated with or without FK866 and NMN for 6 h prior to stimulation with IL-4 for 16 h. e, Arginase assay for M2 macrophages pretreated with or without FK866 and NMN for 6 h prior to stimulation with IL-4 for 16 h. f,g, mRNA and supernatant protein (ELISA) levels of TNF-α and IL-6 in BMDMs pretreated with or without FK866 and NMN for 6 h prior to stimulation with LPS for 6 h. h, Quantification of the half maximal effective concentration (EC50) of NMN needed to rescue M1 and M2 macrophage gene expression. Data are shown as the mean ± s.e.m. (n = 3 independent biological experiments). *P < 0.05, **P < 0.01, ***P < 0.001; two-sided Student’s t-test. Unless noted with a bar, statistical comparisons are relative to M2/M1 + FK866.
Fig. 3 ∣
Fig. 3 ∣. High NADase activity in M1 macrophages is CD38 dependent.
a, Representative flow-cytometry plots comparing CD38 surface staining in naive (M0) WT and Cd38 KO BMDMs or BMDMs treated with IL-4 (M2) and LPS (M1) for 16 h. b, Western analysis of NADase enzymes in M0, M1 and M2 WT and Cd38 KO BMDMs for the indicated times. c, NADase rates measured in WT and Cd38 KO M0, M2 and M1 BMDMs activated for 16 h. d, Quantification of the NADase activity rate. e, LC-MS was used to quantify NAD and NAD-related metabolites in M0, M2 and M1 WT and Cd38 KO BMDMs activated for 16 h. f, NAD/NAM ratios from LC-MS data in e. g, Western analysis of CD38 and CD157 in M0 and M1 BMDMs from WT, Cd38 KO, Cd157 KO and Cd38/Cd157 DKO mice stimulated for 16 h. h, NADase rates measured in M0 and M1 BMDMs from WT, Cd38 KO, Cd157 KO and Cd38/Cd157 DKO mice stimulated for 16 h. Data are shown as the mean ± s.e.m. (n = 3 independent biological experiments, but n = 4 in d). *P < 0.05, **P < 0.01, ***P < 0.001; two-sided Student’s t-test. Unless noted with a bar, statistical comparisons are relative to the appropriate M0 WT or Cd38 KO sample of the same genotype.
Fig. 4 ∣
Fig. 4 ∣. NAD decline during ageing is associated with increased CD38+ tissue-resident macrophages in eWAT.
a, LC-MS was used to quantify NAD and NADP in visceral epididymal white adipose tissue (eWAT) from 6- and 25-month-old WT male mice. NAD and NADP concentrations are shown as pmol mg−1 of tissue (young n = 7 mice per group, old n = 10 mice per group). b, mRNA levels of senescence markers, inflammatory genes, macrophage marker Cd68 and M2 genes in eWAT from young (6 months old) and old (25 months old) WT male mice (young n = 7 mice per group, old n = 9 mice per group). c, Western analysis of the indicated proteins in eWAT from young (3 months old) and old (30 months old) WT male mice. Each lane represents one mouse (young n = 7 mice per group, old n = 4 mice per group). d, Quantification of CD38 protein levels in c, relative to actin levels, in eWAT from young (3 months old) and old (30 months old) WT mice (young n = 7 mice per group, old n = 4 mice per group). e, Quantification of total macrophages, CD38+ resident macrophages and CD38+ non-resident macrophages isolated from eWAT of WT male mice at the indicated ages (2 months n = 6 mice per group, 6 months n = 5 mice per group, 12 months n = 5 mice per group, 18 months n = 5 mice per group, 25+ months n = 7 mice per group). f, IF of the macrophage marker/ antigen F4/80 (magenta) and DAPI-stained nuclei (blue) in eWAT in young (4 months old) and old (26 months old) male and female WT mice. Scale bars, 10 μm. Images are representative of 4-5 mice per group. g, Results from trained neural network analysis of IF images, quantifying the mean number of macrophages (F4/80 colocalized to DAPI) per slide, and mean F4/80+ region size for old and young eWAT, graphed as mean cell count or region size (arbitrary units) per slide. Each column is based on two mice per group, except young/male which has three mice. Multiple images were taken from each mouse, with each image/slide represented as a dot; 9,11,9,13 images/slides for old/f, old/m, young/f, young/m, respectively. h, Analysis of CD38 and other macrophage markers in eWAT from single-cell transcriptome data using the Tabula Muris database (https://tabula-muris.ds.czbiohub.org). Data from individual mice are shown for in vivo experiments. t-SNE, t-distributed stochastic neighbour embedding. Data are shown as the mean ± s.e.m. *P < 0.05, **P < 0.01, ***P < 0.001; two-sided Student’s t-test except, for one-sided t-test in a.
Fig. 5 ∣
Fig. 5 ∣. Cytokines secreted by senescent cells promote macrophage CD38 expression and proliferation.
a, SA-Bgal staining in young (3 months old) and old (19 months old) eWAT from WT male mice. n = 4 mice per group. b, IF images of the macrophage marker F4/80 (magenta) and DAPI-stained nuclei (blue) in eWAT in young (4 months old) and old (26 months old) WT male mice. Scale bars, 10 μm. Representative of 4-5 mice/group. c, mRNA levels in eWAT from 6-month-old WT male mice, which were intraperitoneally (i.p.) injected with PBS or doxo, of senescence markers, inflammatory cytokines, macrophage markers Cd68 and Cd38 in total tissue and isolated macrophages (PBS n = 8 mice per group, doxo n = 7 mice per group). d, Flow-cytometry analysis and quantification of CD38+ macrophages isolated from 6-month-old WT male mice i.p. injected with PBS or doxo (PBS n = 8 mice per group, doxo n = 8 mice per group). e, Conditioned medium (CM) was isolated from non-senescent control mouse dermal fibroblasts (CTRL-MDF), doxo-treated senescent MDFs (sen(doxo)-MDF) or irradiated senescent MDFs (sen(IR)-MDF) at 10 d following treatment, and then was used to stimulate BMDMs for 24 h. f, mRNA levels of Cd38 and those encoding other NAD-consuming enzymes in BMDMs treated for 24 h with CM from CTRL-MDFs, sen(doxo)-MDFs or sen(IR)-MDFs. g, Results from flow cytometry of EdU+ BMDMs treated with sen(IR)-MDF CM or CM from CTRL-MDFs for 24 h. h, Representative bright-field microscopy image of BMDMs treated with CTRL-MDF CM or sen(IR)-MDF CM for 24 h. i, SA-Bgal staining in control (CTRL-PA) or irradiated senescent primary mouse preadipocytes (sen(IR)-PA). j, mRNA levels of the indicated genes in CTRL-PA or sen(IR)-PA. k, mRNA levels of Cd38 and other NAD-consuming enzymes in BMDMs treated with CM from CTRL-PA sen(IR)-PA for 24 h. l, Model showing that inflammatory cytokines (SASP) derived from senescent cells can promote macrophage expression of CD38. Data from individual mice are shown for in vivo experiments. Data are shown as the mean ± s.e.m. (n = at least 3 independent biological experiments). *P < 0.05, **P < 0.01, ***P < 0.001; two-sided Student’s t-test.
Fig. 6 ∣
Fig. 6 ∣. CD38+ Kupffer cells accumulate in the livers of ageing mice.
a, LC-MS quantification of NAD in the liver from young (4 months old) and old (26 months old) WT male and WT female mice (old n = 6 male and 6 female mice per group, young n = 6 male and 6 female mice per group), and Cd38 KO young (3 months old) and old (26 months old) male and female mice (old Cd38 KO n = 5 male and 5 female mice per group, young Cd38 KO n = 5 male and 5 female mice per group) NAD concentrations are shown as pmol per mg of tissue. b, IF images of the macrophage marker/antigen F4/80 (red), CD38 (green) and nuclei with DAPI (blue) in liver from WT young (4 months old) and WT old (26 months old) male mice, and young (3 months old) Cd38 KO male mice. Scale bars, 10 μm. Representative of 7-8 mice per group. c, Analysis of IF images above (a trained neural network to identify macrophage regions and colocalization of F4/80 and CD38, measured by Pearson correlation) for WT old and young liver slides (each dot represents 1 slide), n = 20 slides per mouse (young n = 8 mice per group, old n = 7 mice per group). d, t-SNE plot of annotated cell populations found in the livers of old and young male and female mice using single-cell transcriptome data from the Tabula Muris database (https://tabula-muris-senis.ds.czbiohub.org; used for d-i). e, t-SNE plot of CD38 expression in liver-cell populations in aged mice. f, t-SNE plot of liver cells annotated on the basis of mouse age. Note: Kupffer cells cluster by age. g, Dot plot of the indicated genes in Kupffer cells, with data sorted by mouse age. Logarithmic axes, base 10. h, Heatmap of the indicated genes in Kupffer cells, with data sorted by mouse age. Logarithmic axes, base 10. i, Percentage of total CD38+ Kupffer cells per total amount of cells per age group. j, SA-Bgal staining in liver sections from young (3 months old) and old (19 months old) WT male mice. Representative images of two out of four mice per group. k, mRNA levels of the p16+ senescent-cell reporter mRFP, senescent-cell markers (Cdkn2a (p16Ink4a) and Cdkn1a (p21Cip1)), inflammatory cytokines (I1b and Il6) and Cd38 in liver from 4- to 6-month-old p16-3MR male mice treated with PBS (vehicle); n = 7 mice per group, doxo (vehicle) n = 4 mice per group, and doxo (GCV) n = 4 mice per group. Data from individual mice are shown for in vivo experiments. Data are shown as the mean ± s.e.m. *P < 0.05, **P < 0.01, ***P < 0.001; two-sided Student’s t-test, except one-tailed t-test in a.
Fig. 7 ∣
Fig. 7 ∣. Acute and chronic LPS treatment causes a CD38-dependent decrease in tissue NAD levels.
a, mRNA levels of Cd38 in WT BMDMs treated with the indicated TLR ligands for 16 h (n = 3 independent biological experiments). LMW, low molecular weight; HMW, high molecular weight. b, Treatment summary for WT male mice (2 months old) treated with 0.25 mg per kg (body weight) LPS or PBS for 4 weeks. c,d, Quantification of total and CD38+ macrophages in the spleen of 2-month-old WT male mice treated with LPS or PBS as above, and Cd38 KO mice, by flow cytometry. PBS n = 10 mice per group, LPS n = 9 mice per group. e, mRNA levels in eWAT from 3-month-old WT male mice i.p. injected with PBS or LPS for 4 weeks (PBS n = 4 mice per group, LPS n = 5 mice per group). f, LC-MS quantification of NAD and NADP in eWAT from 3-month-old WT male mice i.p. injected with PBS or LPS for 4 weeks. NAD and NADP concentrations are shown as pmol per mg of tissue (PBS n = 5 mice per group, LPS n = 5 mice per group). g, Cd38 mRNA levels in visceral adipose tissue (VAT)/eWAT and liver of WT male mice (4 months old) treated with 1 mg per kg (body weight) LPS or PBS over a 24-h period (PBS n = 3 mice per group, LPS n = 3 mice per group). h, Treatment summary for WT and Cd38 KO male mice (4 months old) treated with 1 mg per kg (body weight) LPS or PBS for 12 h. i, mRNA levels in eWAT from 4-month-old WT and Cd38 KO male mice injected with PBS or LPS for 12 h (n = 10 mice per group). j, LC-MS quantification of NAD and other metabolites in VAT/eWAT from 4-month-old WT and Cd38 KO male mice injected with PBS or LPS for 12 h (n = 10 mice per group). k, mRNA levels in livers from 4-month-old WT and Cd38 KO male mice injected with PBS or LPS for 12 h (n = 10 mice per group). l, LC-MS was used to quantify NAD and other metabolites in livers from 4-month-old WT and Cd38 KO male mice injected with PBS or LPS for 12 h (n = 10 mice per group). m, Diagram showing how excess NAM, derived from CD38, is methylated by NNMT and shunted away from the NAM-salvage pathway. Data from individual mice are shown for in vivo experiments. Data are shown as the mean ± s.e.m. *P < 0.05, **P < 0.01, ***P < 0.001; two-sided Student’s t-test, except for one-tailed t-test in j and l.
Fig. 8 ∣
Fig. 8 ∣. Proposed model for how ageing-related inflammation enhances NAD degradation.
Cellular stressors such as DNA damage lead to an accumulation of senescent cells over time. Using in vivo and cell-culture models, we show that the accumulation of senescent cells and accompanying inflammatory cytokines of the SASP is necessary and sufficient to promote CD38 expression and proliferation in macrophages. In addition, increased intestinal permeability occurs during ageing, increasing serum levels of endotoxins and other PAMPS, which activate innate immune cells. Chronic and acute exposure to LPS promotes CD38 expression in macrophages in the eWAT and liver, and decreases tissue NAD levels. Collectively, the SASP and PAMPs promote an inflammatory state associated with increased expression of CD38 by tissue-resident M1-like macrophages, and hence enhanced NADase activity.

References

    1. Canto C, Menzies KJ & Auwerx J NAD+ metabolism and the control of energy homeostasis: a balancing act between mitochondria and the nucleus. Cell Metab. 22, 31–53 (2015). - PMC - PubMed
    1. Yoshino J, Baur JA & Imai SI NAD+ intermediates: the biology and therapeutic potential of NMN and NR. Cell Metab. 27, 513–528 (2018). - PMC - PubMed
    1. Mitchell SJ et al. Nicotinamide improves aspects of healthspan, but not lifespan, in mice. Cell Mefab. 27, 667–676 (2018). - PMC - PubMed
    1. Verdin E NAD+ in aging, metabolism, and neurodegeneration. Science 350, 1208–1213 (2015). - PubMed
    1. Bogan KL & Brenner C Nicotinic acid, nicotinamide and nicotinamide riboside: a molecular evaluation of NAD+ precursor vitamins in human nutrition. Ann. Rev. Nutr 28, 115–130 (2008). - PubMed

Publication types

MeSH terms