. 2020 Nov;2(11):1284-1304.
doi: 10.1038/s42255-020-00298-z. Epub 2020 Nov 16.

CD38 ecto-enzyme in immune cells is induced during aging and regulates NAD+ and NMN levels

Affiliations

CD38 ecto-enzyme in immune cells is induced during aging and regulates NAD+ and NMN levels

Claudia C S Chini et al. Nat Metab. 2020 Nov.

Abstract

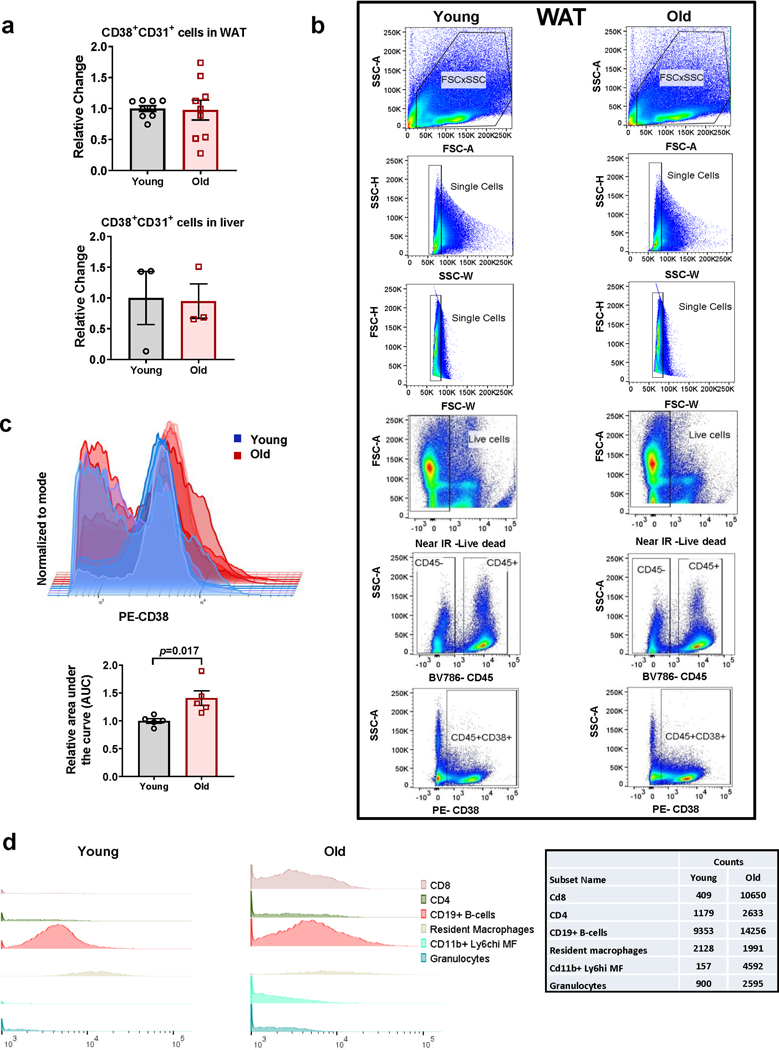
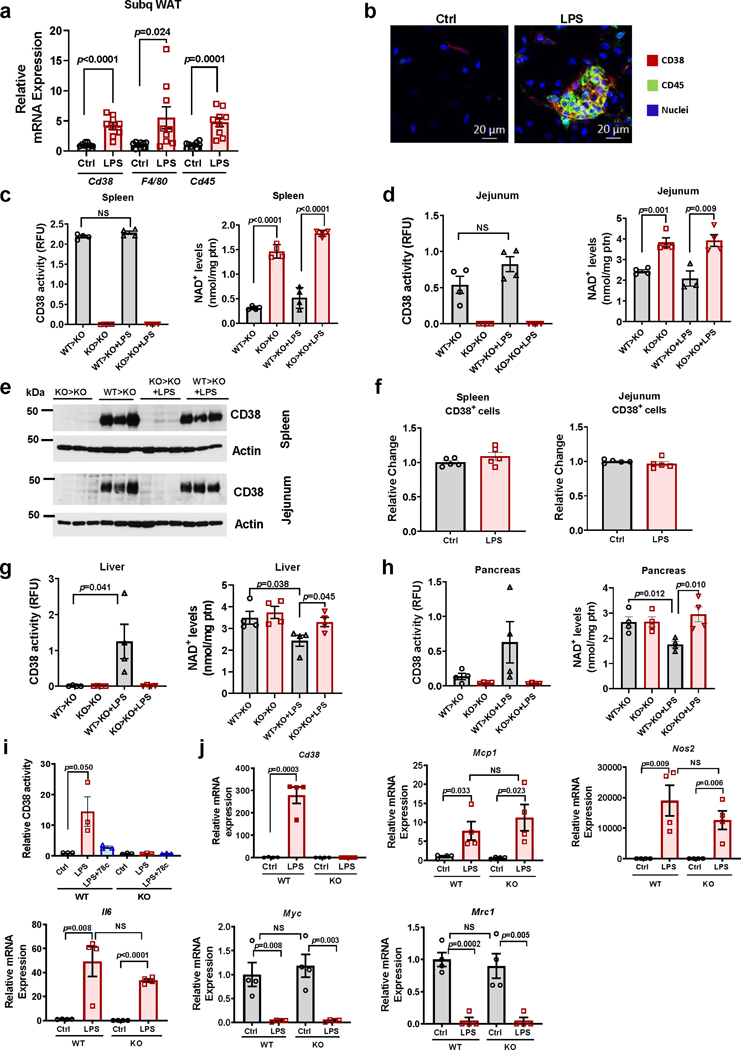
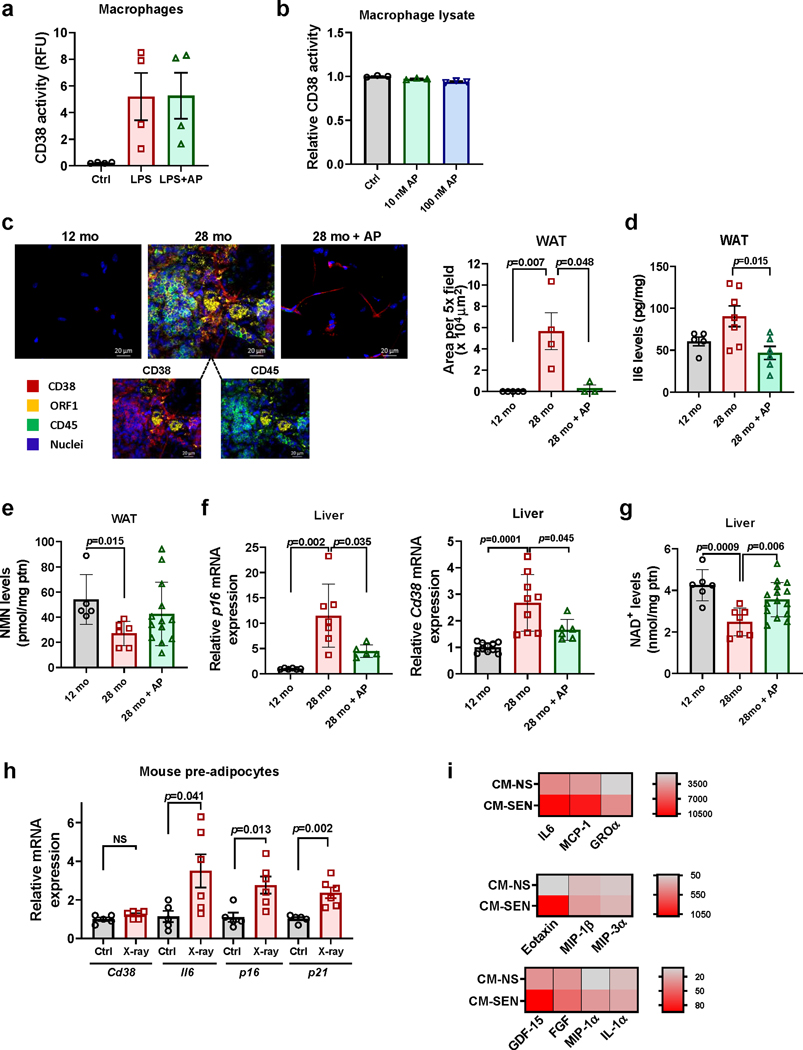
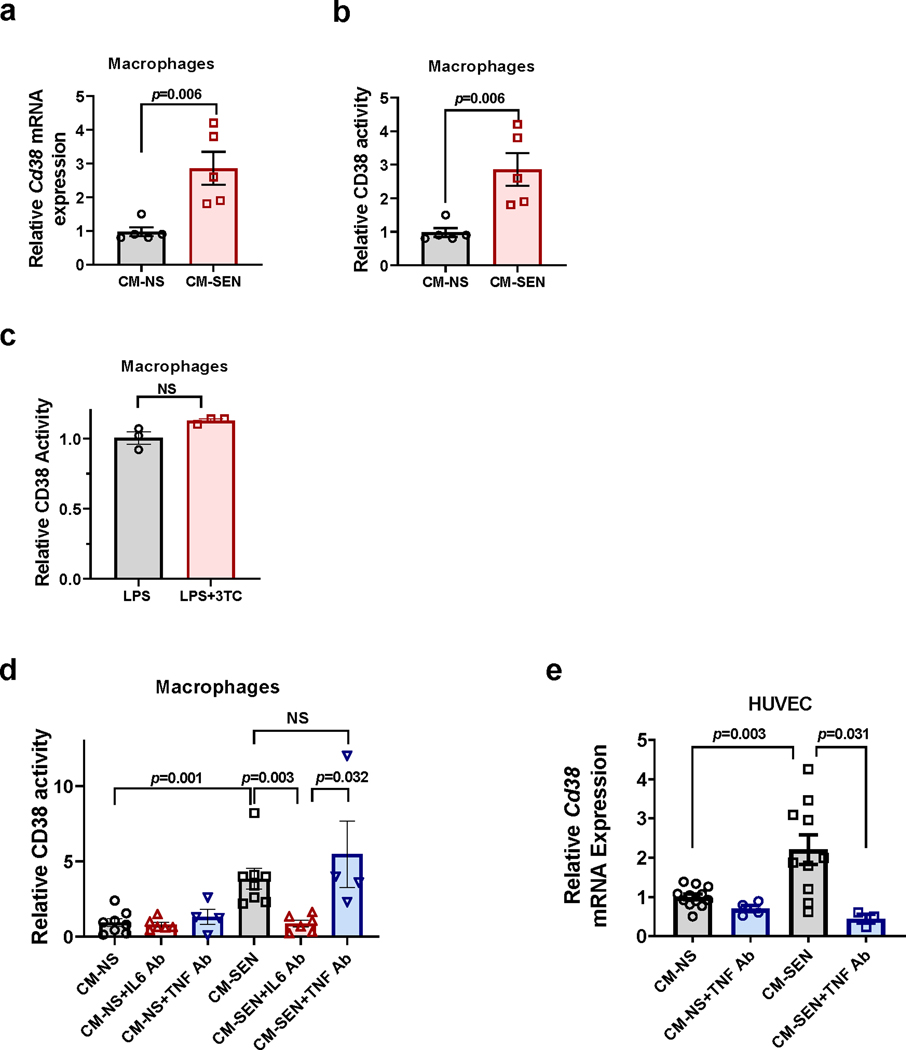
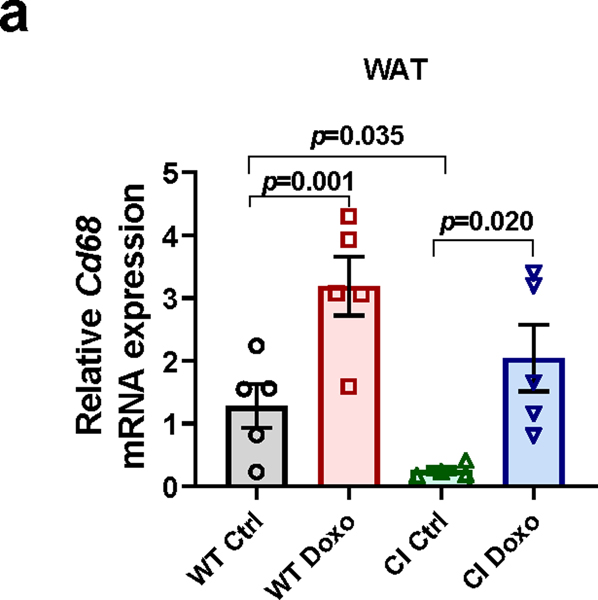
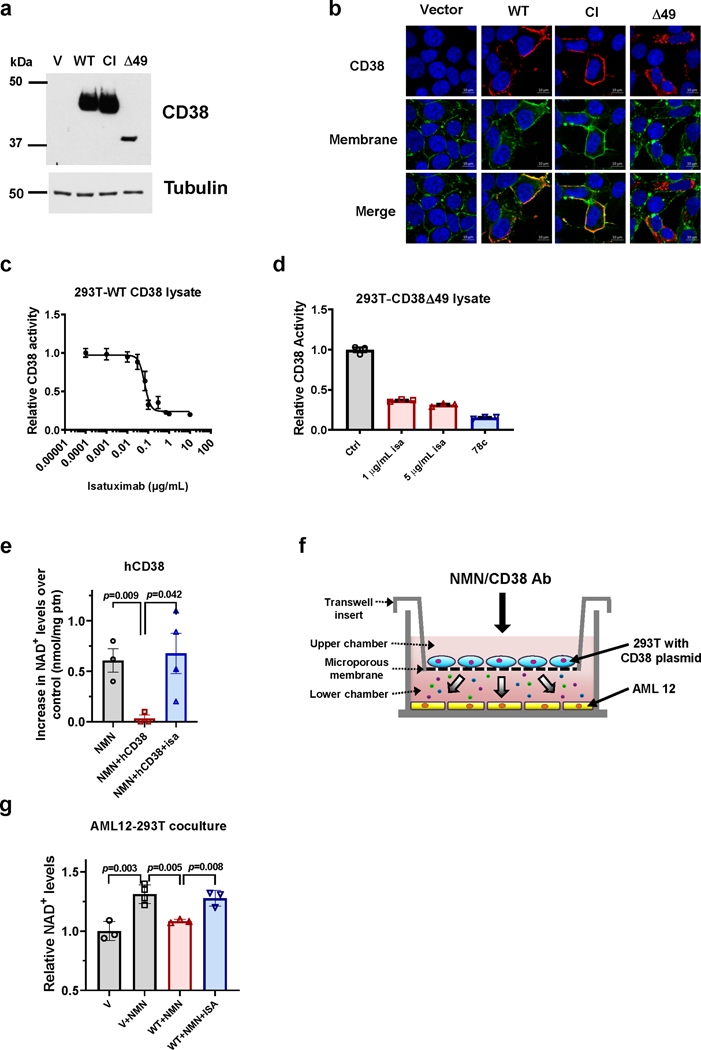
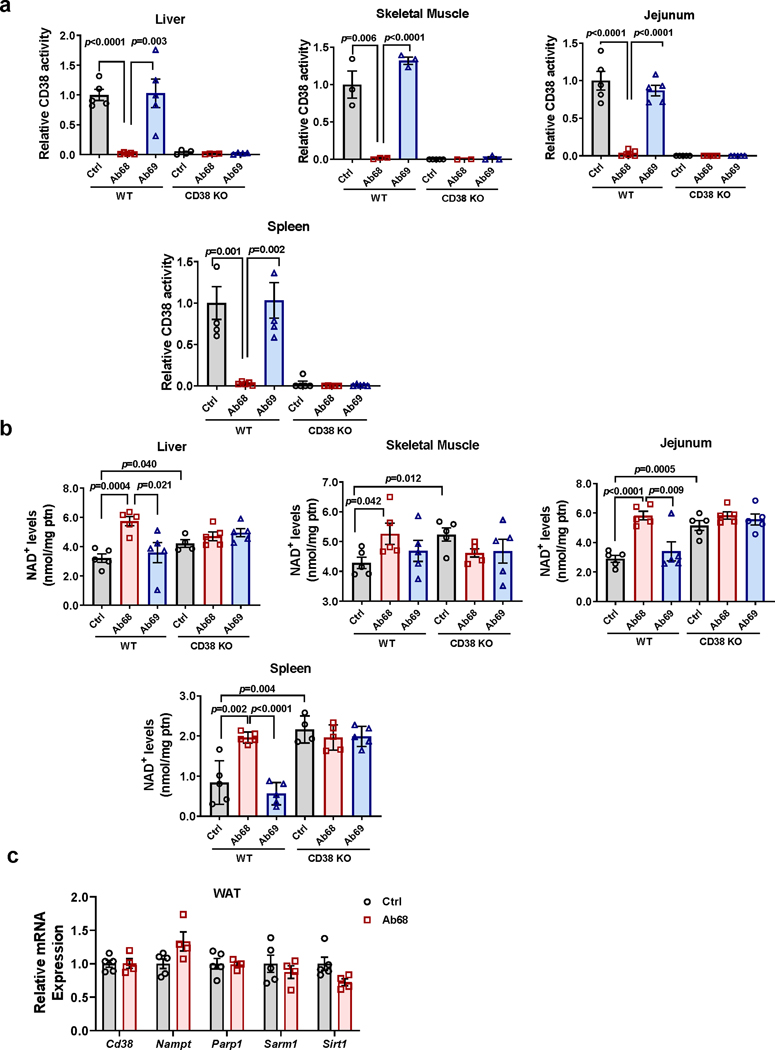
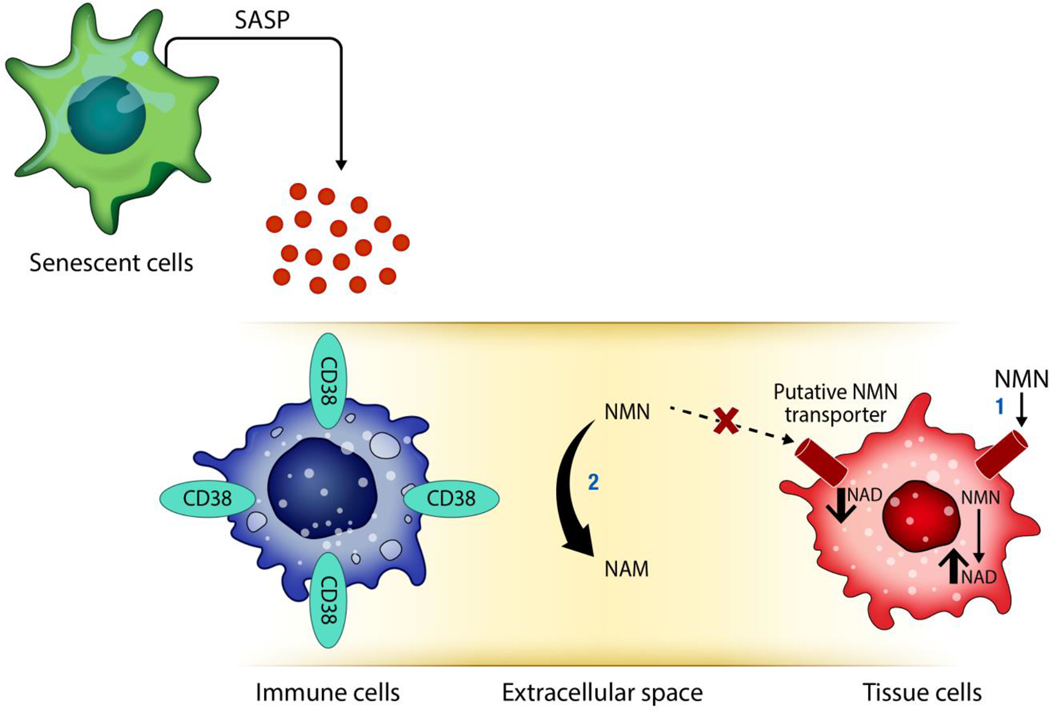
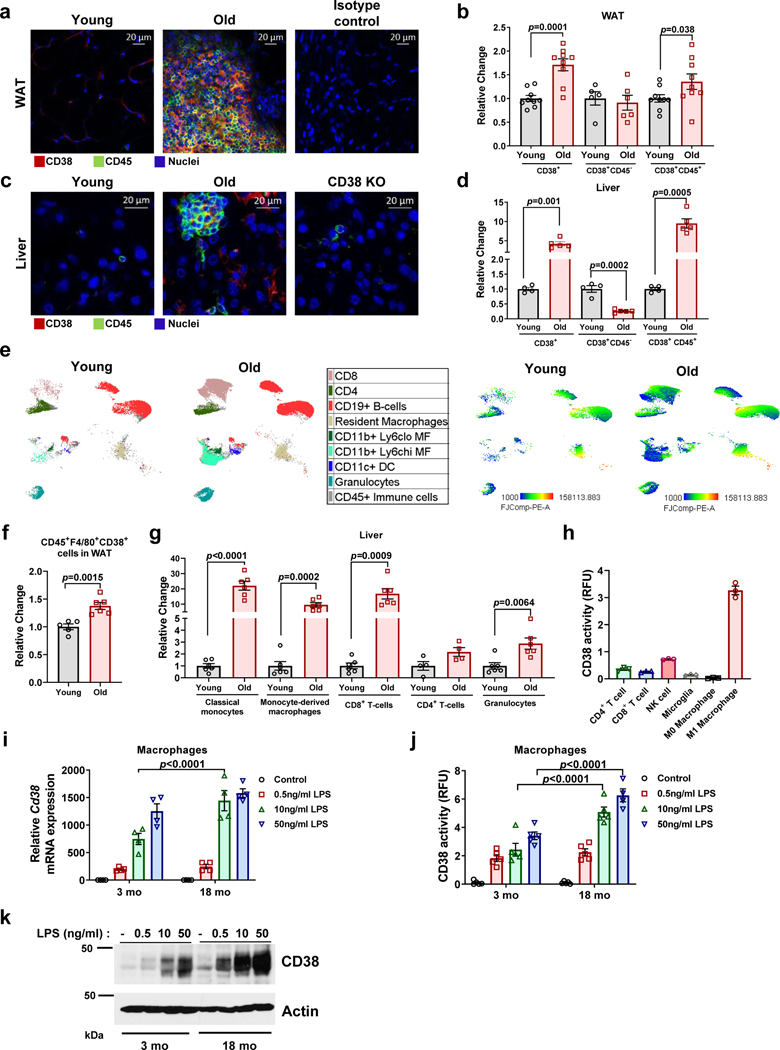
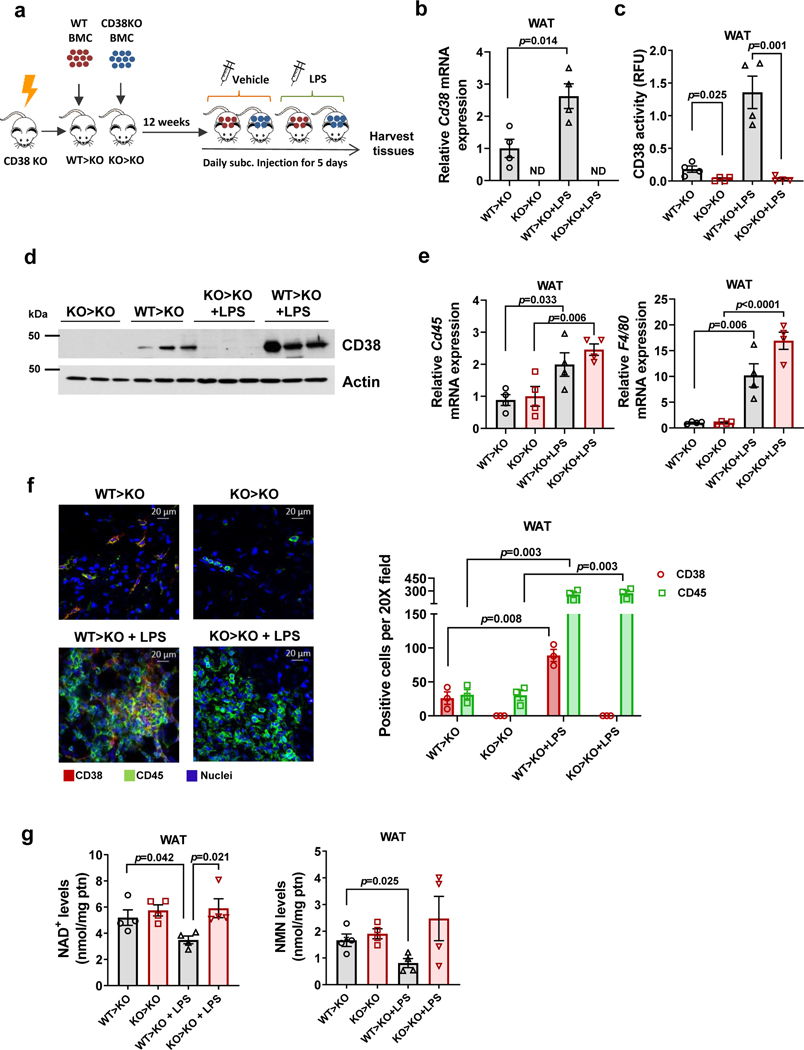
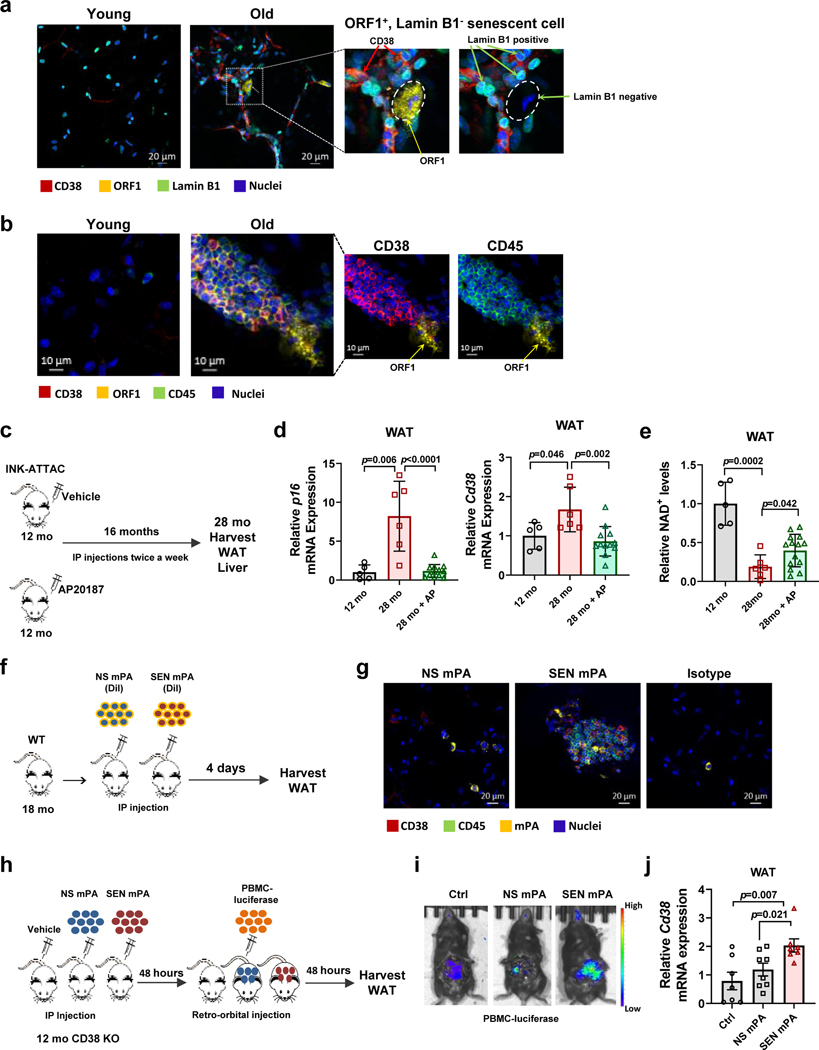
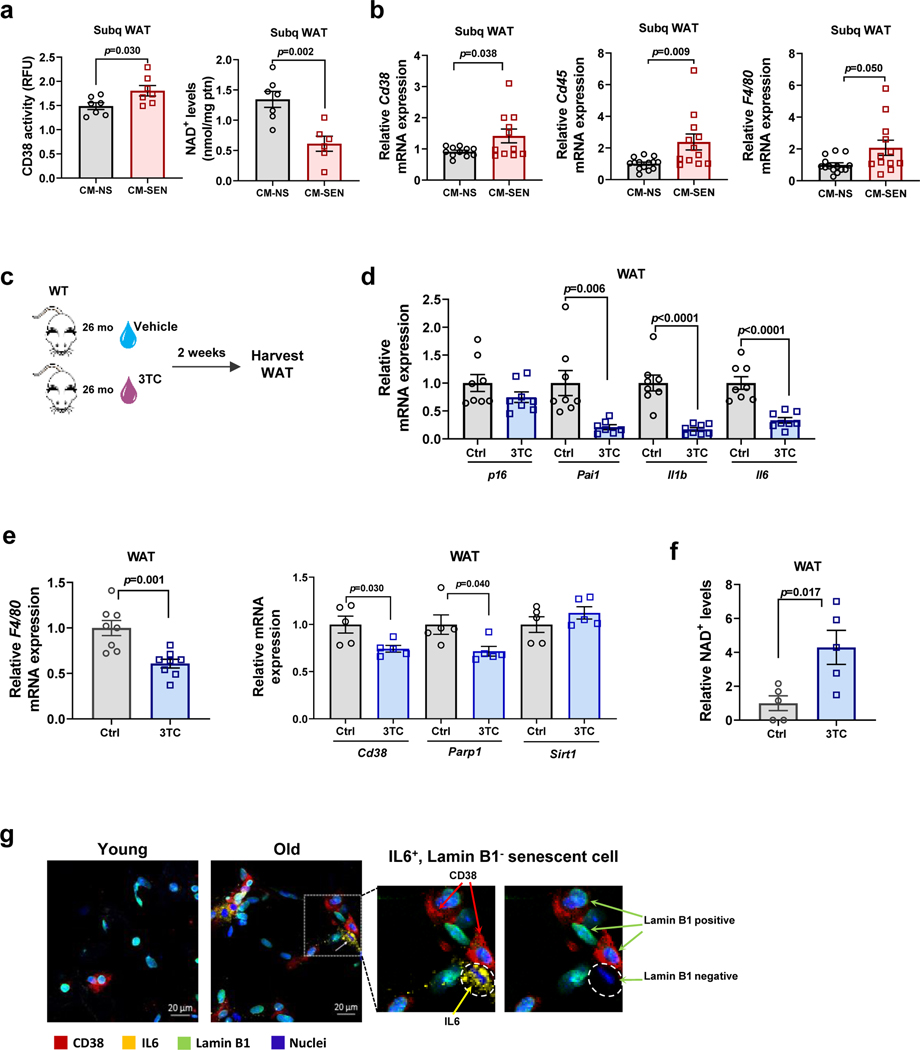
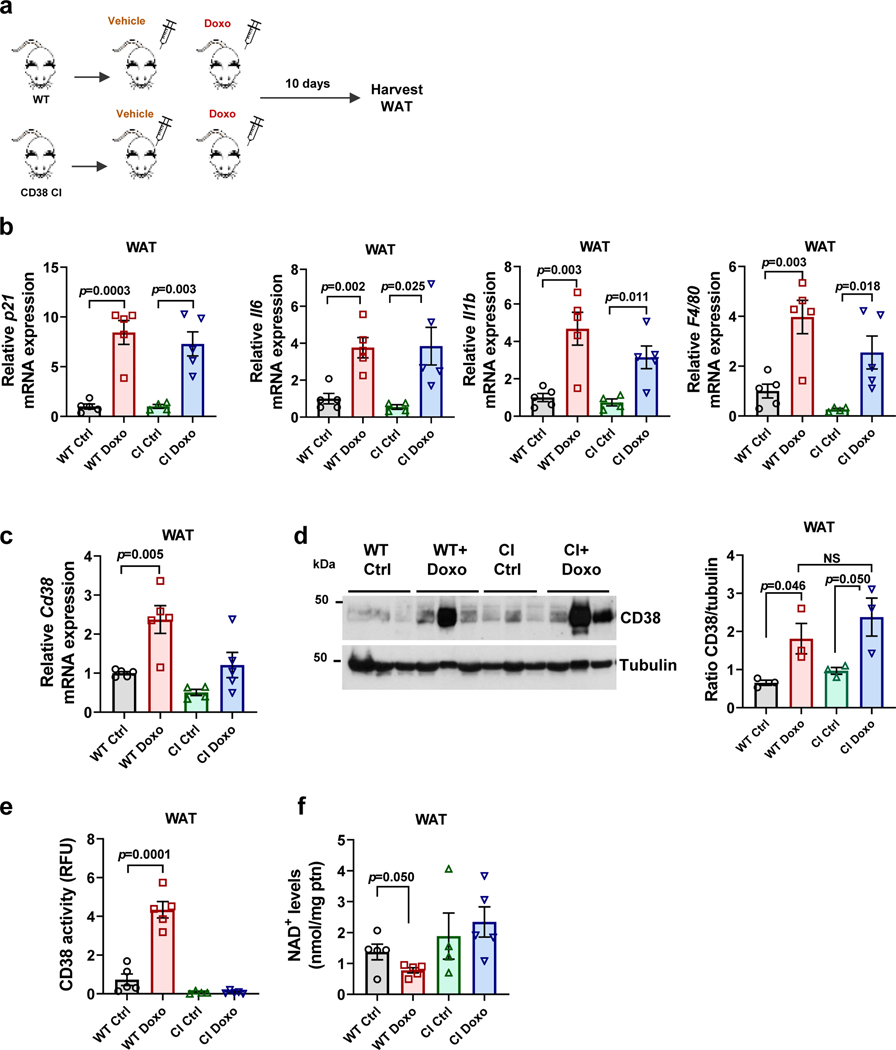
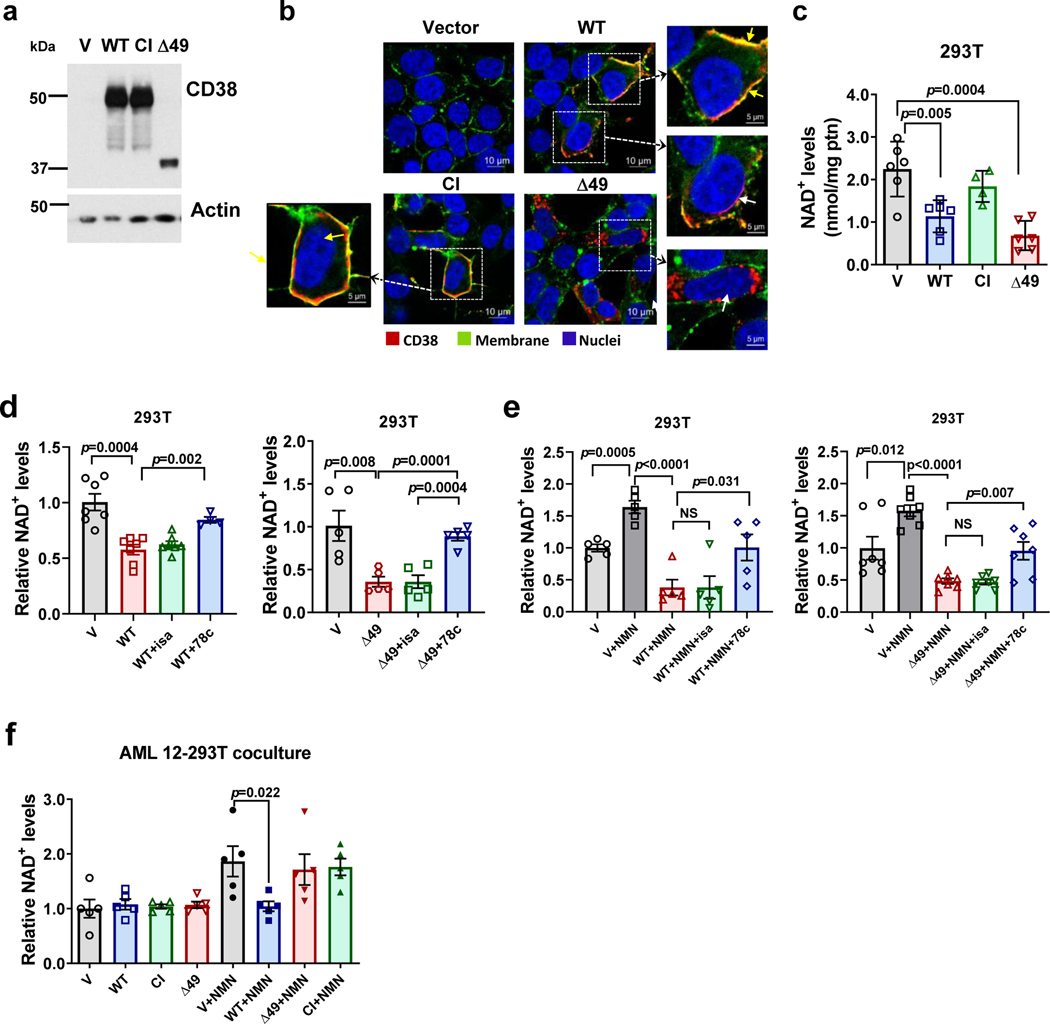
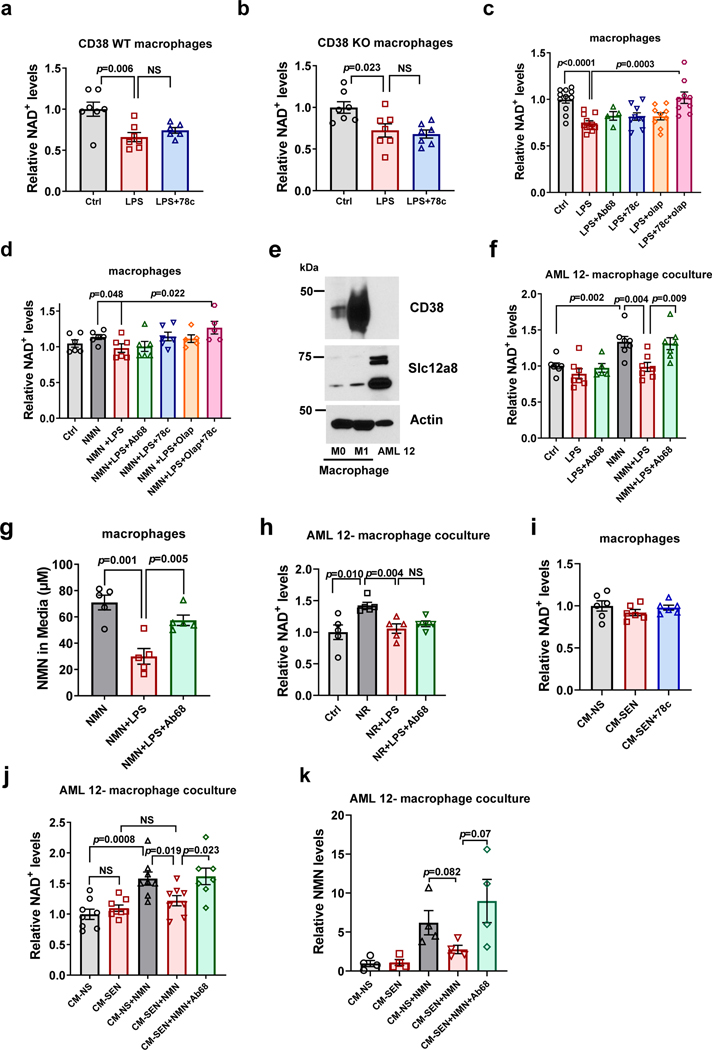
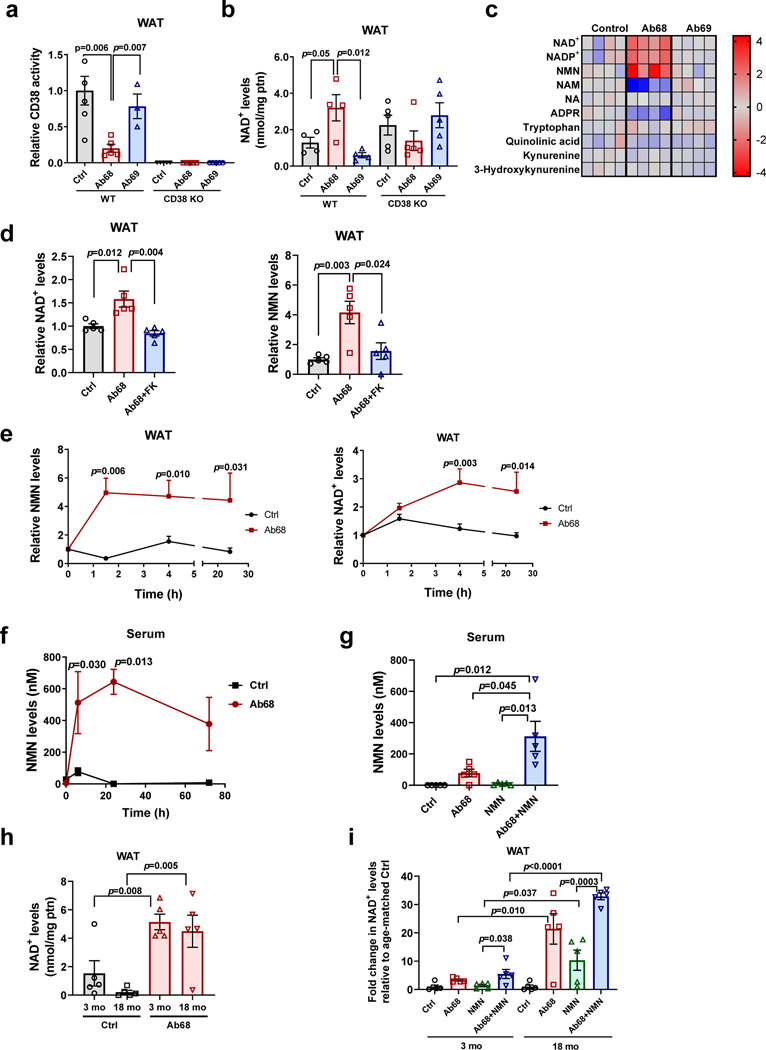
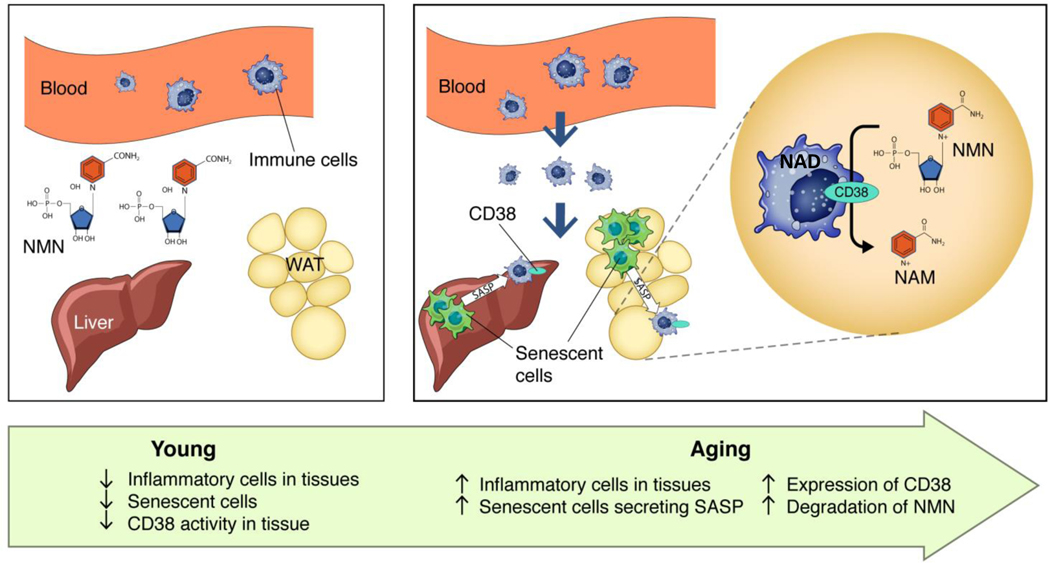
Decreased NAD+ levels have been shown to contribute to metabolic dysfunction during aging. NAD+ decline can be partially prevented by knockout of the enzyme CD38. However, it is not known how CD38 is regulated during aging, and how its ecto-enzymatic activity impacts NAD+ homeostasis. Here we show that an increase in CD38 in white adipose tissue (WAT) and the liver during aging is mediated by accumulation of CD38+ immune cells. Inflammation increases CD38 and decreases NAD+. In addition, senescent cells and their secreted signals promote accumulation of CD38+ cells in WAT, and ablation of senescent cells or their secretory phenotype decreases CD38, partially reversing NAD+ decline. Finally, blocking the ecto-enzymatic activity of CD38 can increase NAD+ through a nicotinamide mononucleotide (NMN)-dependent process. Our findings demonstrate that senescence-induced inflammation promotes accumulation of CD38 in immune cells that, through its ecto-enzymatic activity, decreases levels of NMN and NAD+.


Conflict of interest statement

Competing Interests Statement

Dr. Chini holds a patent on the use of CD38 inhibitors for metabolic diseases that is licensed by Elysium health. E.N.C is a consultant for TeneoBio, Calico, Mitobridge and Cyokinetics. E.N.C is on the advisory board of Eolo Pharma (Santa Fe, Argentina) W.v.S. is the Chief Scientific Officer of Teneobio, a company interested in the development of therapeutic antibodies. W.v.S, K.D., E.N.C, and S.C own stocks of Teneobio. J.L.K., T.T., J.M.vD., and D.J.B. have a financial interest related to this research: patents on transgenic animals capable of being induced to delete senescent cells are held by Mayo Clinic. J.L.K., T.T., D.J.B. and J.M.v.D. are co-inventors on patent applications licensed to or filed by Unity Biotechnology, a company developing senolytic medicines, including small molecules that selectively eliminate senescent cells. J.M.v.D. is a co-founder of Unity Biotechnology. J.M.S. is a cofounder of Transposon Therapeutics, Inc., serves as Chair of its Scientific Advisory Board, and consults for Astellas Innovation Management LLC, Atropos Therapeutics, Inc. and Gilead Sciences, Inc. J.D.R. is a member of the Rutgers Cancer Institute of New Jersey and of the University of Pennsylvania Diabetes Research Center; a co-founder and stockholder in VL54, Sofro, and Raze Therapeutics; and advisor and stockholder in Agios Pharmaceuticals, Kadmon Pharmaceuticals, Bantam Pharmaceuticals, Colorado Research Partners, Rafael Pharmaceuticals, and L.E.A.F. Pharmaceuticals. J.B. has intellectual property related to the use of NAD precursors in liver regeneration. All other authors declare no conflict of interest. This research has been reviewed by the Mayo Clinic Conflict of Interest Review Board and is being conducted in compliance with Mayo Clinic Conflict of Interest policies.

Figures

Extended Data Fig. 1
Extended Data Fig. 1. CD38+ cells increase in tissues with aging.
(a) Graphs show no change in CD38+CD31+ cell population in WAT and liver tissues between young (4 month-old) and old (32 month-old) mice (n=3 for liver and n=9 mice for WAT). (b) Gating strategy used to show the CD45+CD38+ population in WAT of young (4 month-old) and old (22 month-old) mice. (c) Histograms of CD38+ population in young (4 month-old) and old (22 month-old) WAT showing the shift in CD38 expression. The graph shows the relative area under the curve (AUC) for young and old (n=5 mice per group). (d) Histograms showing the CD38 expression in different immune cells in young (4 month-old) and old (32 month-old) liver. Table shows cell counts for each subset of immune cells, the data are representative of n=5 mice per group. (e) Gating strategy for CD45+ immune subsets in CD38+ liver cells in young (4 month-old) and old mice (32 month-old). Data are mean ± SEM, analyzed by unpaired two-sided t-test.
Extended Data Fig. 2
Extended Data Fig. 2. CD38 increases in tissues after LPS administration, bone marrow transplant of WT cells into CD38 KO mice, and in activated macrophages.
(a-b) 12 month-old mice received daily subcutaneous injection of vehicle (Ctrl) or LPS (300 μg/kg) for 5 days (n=9 mice per group). (a) mRNA expression of Cd38, F4/80, and Cd45 in subcutaneous WAT (Subq WAT) measured by qRT-PCR analysis and expressed relative to Ctrl. (b) Immunofluorescent staining for CD38 (red) and CD45 (green) in Subq WAT, showing accumulation of CD38+CD45+ cells with LPS treatment. Images are representative of 6 mice per group. (c-h) Sub-lethally irradiated CD38 KO mice were subjected to bone marrow transplant (BMT) with 1×10⁶ bone marrow cells (BMC) per animal from either WT (WT>KO) or CD38 KO donors (KO>KO). Twelve weeks after transplantation, mice were subcutaneously injected with LPS (300 μg/kg) or vehicle daily for 5 days and harvested at day 5. (c,d) CD38 activity and NAD+ levels in spleen and jejunum (n=4 mice per group). (e) CD38 expression by immunoblot (n=3 mice per group). (f) Number of CD38+ cells by flow cytometry was measured in spleen and jejunum with and without LPS treatment (n=5 mice per group). (g,h) CD38 activity and NAD+ levels in liver and pancreas (n=4 mice per group). (i) CD38 activity was measured in macrophages isolated from WT or CD38 KO mice and treated or not with LPS (100 ng/mL) with and without the CD38 inhibitor 78c (0.5 μM) for 24 hours. CD38 activity is relative to Ctrl WT (n=3 biologically independent samples). (j) Macrophages isolated from WT or CD38 KO mice were treated or not with LPS (100 ng/mL) for 24 hours and mRNA expression of Cd38 and other markers of macrophage activation were measured. Expression was measured by qRT-PCR analysis and expressed relative to Ctrl WT (n=4 biologically independent samples). Data are mean ± SEM, analyzed by unpaired two-sided t-test, NS=non-significant.
Extended Data Fig. 3
Extended Data Fig. 3. Senescence regulates CD38 in vivo.
(a) WT macrophages were incubated with LPS (100 ng/mL) in the presence or absence of 100 nM AP20187 for 20 hours. CD38 activity was measured in cell lysates (n=4 biologically independent samples). (b) WT macrophages were treated with LPS (100 ng/mL) for 20 hours and cell lysates were prepared. Lysates were incubated with or without AP20187 for 15 min before CD38 activity was measured (n=3 biologically independent samples). (c-g) 12 month-old INK-ATTAC mice were treated with vehicle or with AP20187 for 16 months (28 month-old groups) and were compared with 12 month-old animals. (c) Representative images of immunofluorescent staining for CD38 (red), ORF1 (yellow), and CD45 (green) in WAT. Insets show the image of 28 month-old WAT with removal of green color channel CD45 signal (left) and with removal of red color channel CD38 signal (right) to show accumulation of CD38+ CD45+ cells near ORF1+ cells. Graph shows quantification of CD45+ immune clusters in WAT, based on 20 5x fields per sample (12 mo, n=5; 28 mo, n=4; 28 mo+AP, n=3 mice). (d) IL6 levels in WAT detected by ELISA (12 mo n=5; 28 mo n=7; 28 mo+AP n=6 mice). (e) NMN levels measured in WAT (12 mo n=5; 28 mo n=6; 28 mo+AP n=13 mice). (f) Relative mRNA levels of p16 (12 mo n=6; 28 mo n=7; 28 mo+AP n=5 mice) and Cd38 (12 mo n=10; 28 mo n=9; 28 mo+AP n=6 mice) detected by qRT-PCR analysis in liver. Levels are relative to 12 month-old mice. (g) NAD+ levels in liver (12 mo n=6; 28 mo n=7; 28 mo+AP n=15 mice). (h) Relative mRNA levels of inflammatory and senescence-related genes in X-ray irradiated WT mouse pre-adipocytes determined by qRT-PCR. Levels are relative to control non-senescent cells (Ctrl) (Ctrl n=5; X-ray n=6 biologically independent samples). (i) Quantitative analysis of cytokines/chemokines in conditioned media harvested from irradiated (CM-SEN) or non-senescent (CM-NS) mouse pre-adipocytes. Heat maps reflect analytes (pg/mL) measured in 3–25-plex Luminex assays. Heat map shows average of 5 biologically independent samples. Data are mean ± SEM, except letters e-g that are mean ± SD, analyzed by unpaired two-sided t-test.
Extended Data Fig. 4
Extended Data Fig. 4. The senescence-associated secretory phenotype (SASP) increases CD38 accumulation.
(a-b) WT macrophages were incubated with conditioned media from senescent (CM-SEN) and non-senescent (CM-NS) mouse pre-adipocytes for 20 hours. CD38 expression and activity are relative to CM-NS. (a) Cd38 mRNA expression in the macrophages was measured by qRT-PCR analysis. (n=5 biologically independent samples). (b) Relative CD38 activity in macrophage lysates (n=5 biologically independent samples). (c) WT macrophages were treated with LPS (100 ng/mL) with and without 3TC (10 μM) for 20 hours and CD38 activity was measured in cell lysates (n=3 biologically independent samples). (d) WT macrophages were incubated with conditioned media from senescent (CM-SEN) and non-senescent (CM-NS) mouse pre-adipocytes for 20 hours. Conditioned media was pre-incubated for 2 hours with or without IL6 or TNF-α antibody (5 μg/mL) before addition to the macrophages. CD38 activity was measured in cell lysates, and expressed relative to CM-NS (CM-NS and CM-SEN n=8; CM-NS+IL6 Ab and CM-SEN+IL6 n=6; CM-NS+TNF Ab and CM-SEN+TNF n=4 biologically independent samples). (e) HUVECs were treated with conditioned media from senescent (CM-SEN) and non-senescent (CM-NS) mouse embryonic fibroblasts for 20 hours. CM was pre-incubated for 2 hours with or without TNF-α antibody (5 μg/mL) before addition to the HUVECs. Cd38 mRNA expression was measured by qRT-PCR analysis (CM-NS n=12; CM-NS+TNF Ab n=4; CM-SEN n=10; CM-SEN+TNF Ab n=4 biologically independent samples). Data are mean ± SEM, analyzed by unpaired two-sided t-test.
Extended Data Fig. 5
Extended Data Fig. 5. CD38 is required for genotoxic/senescence-induced NAD+ decline.
(a) Cd68 mRNA expression measured by qRT-PCR (n=5 mice per group, except for CI Ctrl where n=4 mice). Data are mean ± SEM, analyzed by unpaired two-sided t-test.
Extended Data Fig. 6
Extended Data Fig. 6. Characterization of the inhibitory CD38 antibody in human cells.
(a) 293T cells were transfected with vector (V), CD38 WT (WT), CD38 CI (CI) or CD38 Δ49 (Δ49). Representative immunoblotting of 4 independent experiments showing CD38 expression in cytosol of 293T cells transfected with CD38 plasmids. (b) Immunofluorescence of fixed 293T cells transfected with CD38 plasmids. Images are representative of 3 independent experiments. Cells were labeled with CD38 antibody and a membrane dye, followed by Hoechst staining. Images show separate CD38 and membrane staining. (c-d) Lysates of transfected 293T cells were incubated with varied concentrations of the human CD38 antibody isatuximab (isa) or 0.5 μM 78c for 15 min before CD38 activity was measured. Activity is relative to control (no antibody). (c) Lysates of 293T transfected with CD38 WT plasmid (n=4 biologically independent samples). (d) Lysates of 293T transfected with CD38 Δ49 plasmid (n=3 biologically independent samples). (e) Human recombinant CD38 (hCD38) (100 ng/mL) was incubated with and without isatuximab (5 μg/mL) for 2 hours and then added to 293T cells together with NMN (300 μM). Control samples had no CD38 and no NMN. 293T were incubated with NMN and hCD38 for 20 hours and NAD+ levels were measured in the 293T cells. Values show the difference from untreated control (n=3 except for NMN+hCD38+isa where n=4 biologically independent samples). (f) Scheme representing the coculture model. (g) NAD+ levels in AML 12 cells co-cultured with 293T cells expressing vector or CD38 WT. 293T cells were treated with and without 200 μM NMN 20 hours after transfection in the presence or absence of 5 μg/ml isatuximab. AML 12 cells were collected 20 hours after incubation with 293T cells (n=3 except for V+NMN where n=4 biologically independent samples). Levels are relative to vector-transfected cells. Data are mean ± SEM, analyzed by unpaired two-sided t-test.
Extended Data Fig. 7
Extended Data Fig. 7. Characterization of the ecto-enzymatic activity of CD38 in BMDMs.
(a) Relative mRNA expression of Nampt and Cd157 after treatment of BMDMs of WT and CD38 KO mice with and without 100 ng/mL LPS for 24 hours. Expression, assessed by qRT-PCR, is relative to Ctrl WT (n=4 biologically independent samples). (b-g) Characterization of the mouse anti-CD38 antibodies used in this study. (b) Schematic representation of a human heavy chain-only antibody (UniAbs). (c) Workflow to discover CD38-specific UniAbs. Antibodies were derived from transgenic rats, called UniRats that produce heavy-chain antibodies with fully human VH domains (UniAbs) in response to an antigen challenge. (d) Development of UniRat transgenic animals. (e) Protein and cell-based screens to discover anti-CD38 UniAbs. (f) Graph showing the binding of FITC-labeled Ab68 to freshly isolated mouse spleen cells (n=3 biologically independent samples). (g) Effect of Ab68 on the rate of CD38 hydrolase activity at different concentrations of substrate (left, n=8; except for no e-NAD where n=4 biologically independent samples and respective Lineweaver-Burk plots (right, n=6 biologically independent samples). (h) Table shows the binding affinities (KD) of anti-mouse CD38 antibodies Ab68 and Ab69 and a mouse control antibody OKT3. NB=No Binding. (i) Apoptosis of CHO cells stably transfected with mouse CD38 after incubation with antibodies Ab68, Ab69, and NIMR-5 for 24 hours (n=2 samples per concentration). (j) Cell viability of WT macrophages treated with LPS (100 ng/mL), with or without Ab68 or Ab69 (5 μg/mL) for 24 hours (n=4 except for LPS+Ab69 where n=3 biologically independent samples). (k) Graph shows the internalization of Ab68 compared to control antibody NIMR-5 after 45 minutes and 1.5 hours. (l) NAD+ levels in AML 12 treated with 200 μM NMN in the presence or absence of LPS (100 ng/mL), Ab68 (5 μg/mL), and 78c (0.5 μM). LPS was given for 18 hours, then Ab68 was added, and 3 hours later NMN was added. Cells were collected 20 hours after NMN was added. NAD+ levels were relative to control (Ctrl) (n=4 biologically independent samples). (m) NAD+ levels in AML 12 cells cocultured with macrophages from CD38 KO mice. LPS was given for 18 hours to the macrophages, then NMN or NR (200 μM) were added for 3 hours. Next, macrophages were incubated with AMLs, and AML cells were collected 20 hours later. NAD+ levels were relative to control (Ctrl) (n=4 biologically independent samples). (n) NAD+ levels in AML 12 cocultured with macrophages. Macrophages were treated with 200 μM NA in the presence or absence of LPS (100 ng/mL), and Ab68 (5 μg/mL). LPS was given for 18 hours, then Ab68 was added, and 3 hours later nicotinic acid (NA) was added to the macrophages. Three hours after addition of NA, macrophages were incubated with AML cells. AML cells were collected 20 hours later and NAD+ levels were calculated relative to control (Ctrl) (n=5 biologically independent samples). (o) Macrophages were incubated with conditioned media from senescent (CM-SEN) and non-senescent (CM-NS) mouse pre-adipocytes, and with LPS and without (Ctrl) for 20 hours. Cd38 mRNA expression (CM-NS and CM-SEN n=5; Ctrl and LPS n=4 biologically independent samples), CD38 activity (n=5 biologically independent samples), and NAD+ levels (n=6 biologically independent samples) were measured in the macrophages. Samples from cells incubated with CM-SEN, were calculated relative to cells incubated with CM-NS. Samples from cells treated with LPS, were calculated relative to vehicle-treated cells (Ctrl). Data are mean ± SEM, analyzed by unpaired two-sided t-test, NS= non-significant.
Extended Data Fig. 8
Extended Data Fig. 8. Blocking the CD38 ecto-enzymatic activity regulates NMN, NAD+ levels and CD38 activity in vivo.
(a-b) 4 month-old WT and CD38 KO mice were treated with vehicle (Ctrl), Ab68 (5 mg/kg), or Ab69 (5 mg/kg) on day 1 and day 5, and euthanized on day 8. (a) CD38 activity in several tissues (liver n=5 except for Ctrl CD38 KO where n=4 mice; skeletal muscle n=3 except for Ab68 where n=2 mice; jejunum and spleen n=5 mice per group). (b) NAD+ levels in several tissues (liver and spleen n=5 mice except for Ctrl CD38 KO where n=4; skeletal muscle and spleen n=5 mice per group). (c) 4 month-old WT mice were treated with a single injection of vehicle (Ctrl) or Ab68 (5 mg/kg). After 3 days, tissues were harvested and gene expression was measured in WAT by qRT-PCR. Values are relative to Ctrl (Ctrl n=5 mice; Ab68 n=4 mice). (d) 4 month-old WT mice were treated with vehicle (Ctrl) or Ab68 (5 mg/kg) on day 1 and day 5, and euthanized on day 8. NMN and nicotinamide (NAM) levels were measured in liver and skeletal muscle. Levels are relative to Ctrl (n=5 mice per group). (e) Relative NMN levels in WAT, liver and skeletal muscle of 4 month-old WT and CD38 KO mice. Levels are relative to WT mice (n=5 mice per group except for liver CD38 KO where n=3 mice and skeletal muscle CD38 KO where n=4 mice). (f) 22 month-old WT mice were injected with a single dose of vehicle (Ctrl) or Ab68 (5 mg/kg). Mice were euthanized at different time points, and NMN and NAD+ levels were measured in liver. Graphs show the time course of the relative increase of NMN or NAD+ in vehicle and Ab68-treated over levels at time 0 (n=4 mice per group). (g) Graph shows the difference between NMNase activity of CD38 in the blood of WT and CD38 KO mice (n=3 mice per group). (h) Human recombinant CD38 enzyme was incubated with NMN at different pHs, and levels of nicotinamide were measured by an enzymatic coupled reaction (n=3 biologically independent samples). (i) Relative levels of NAD+ and NR in the serum of mice injected with a single injection of vehicle (Ctrl) or Ab68 (5 mg/kg). Mice were euthanized 3 days later and NAD+ and NR levels in the serum were measured (n=6 mice per group). (j) Relative mRNA expression of inflammatory and SASP markers in WAT of 3 month-old (young) and 18 month-old mice (old) treated or not with a single injection of vehicle (Ctrl) or 5 mg/kg Ab68. WAT was collected 3 days after injection of Ab68 (n=5 except for Ctrl old where n=4). Data are mean ± SEM, analyzed by unpaired two-sided t-test, except for (f-g) where data are analyzed by two-way ANOVA.
Extended Data Fig. 9
Extended Data Fig. 9. Schematic representation of the role of senescence and sterile inflammation in immune cell CD38 regulation, and the effect of extracellular NMN degradation in the regulation of tissue NAD+ levels.
The senescence-associated secretory phenotype (SASP) increases the expression/accumulation of CD38 in immune cells in tissues where immune cells appear to regulate tissue NAD+ levels. It has been proposed that NMN enters the cell through a putative NMN transporter, is converted to NAD+ intracellularly, and increases intracellular NAD+ levels (1). In the presence of senescence cells and the sterile inflammation, the levels of the ectoenzyme CD38 appear to increase in immune cells and tissues, degrading extracellular NMN to NAM, and causing a decrease in NMN/NAD+ levels in tissues (2).
Figure 1.
Figure 1.. Characterization of CD38+ cell types that accumulate in tissues during aging.
Analysis of WAT (a,b,f) and liver (c,d,e,g) of young and old mice. (a,c) Representative immunofluorescence image for CD38 (red) and CD45 (green) in WAT and liver of young (3–4 month-old) and old (28–32 month-old) C57BL/6 mice (4 mice per group), compared to isotype control or CD38 Knockout (KO). (b,d) CD38+, CD38+CD45, and CD38+CD45+ cells in young (4 month-old) and old (32 month-old) mice were determined by flow cytometry in WAT (CD38+, CD38+CD45+ n=9 mice per group; CD38+CD45 n=5 mice for young, 6 mice for old) and liver (young n=4 mice per group; old n=5 mice per group), changes are relative to young mice. (e) In the left panel, flow cytometry-derived color-coded cell clusters of CD38+ immune cell types in liver of young (4 month-old) and old (32 month-old) mice analyzed by Uniform Manifold Approximation and Projection (UMAP). In the right panel, heat maps show CD38 protein expression (lowest in blue and highest in red) in the respective immune clusters (n=4 for young and n=5 for old). (f) Graph shows CD45+F4/80+CD38+ cell population in WAT of young (4 month-old, n=5 mice) and old mice (32 month-old, n=6 mice). Fold changes are relative to young mice. (g) CD38+CD45+ subsets increase with age in liver tissue (Classical monocytes, monocyte-derived macrophages, CD8+ T cells, and granulocytes n=6 mice; CD4+ T cells n=4 mice). Change is relative to young mice. (h) CD38 activity in mouse immune cells isolated from spleen (n=3 biologically independent samples). (i-k) Macrophages isolated from 3 month-old and 18 month-old mice were stimulated with different concentrations of LPS for 20 hours. (i) Cd38 mRNA expression measured by qRT-PCR analysis (n=4 biologically independent samples). (j) CD38 activity measured in protein lysates (RFU-relative fluorescent units) (n=5, except for 18 mo 50 ng/mL LPS where n=4 biologically independent samples). (k) Representative immunoblotting of three biologically independent samples from macrophages treated with different concentrations of LPS. Data are mean ± SEM, analyzed by unpaired two-sided t-test, except for CD38+CD45+ in Fig 1b, where samples were analyzed by unpaired on-sided t-test.
Figure 2.
Figure 2.. CD38+ inflammatory cells infiltrate WAT and regulate NAD+ levels.
(a-g) Sub-lethally irradiated 3 month-old CD38 KO mice were subjected to bone marrow transplant (BMT) with 1×10⁶ bone marrow cells (BMC) per animal from either WT (WT>KO) or CD38 KO donors (KO>KO). Twelve weeks after transplantation, μice were subcutaneously injected with LPS (300 μg/kg) or vehicle daily for 5 days and harvested at day 5 (n=4 mice per group). Figure shows analyses in WAT. (a) Schematic of experiment. (b) Relative Cd38 mRNA expression measured by qRT-PCR. Expression is relative to WT>KO group. ND denotes non-detectable. (c) CD38 activity. (d) Representative immunoblotting showing CD38 levels in 3 mice from each treatment group. (e) mRNA expression of Cd45 and F4/80 measured by qRT-PCR. Expression is relative to CD38 KO (KO>KO). (f) Immunofluorescent staining of CD38 (red) and CD45 (green), representative of 4 mice per group. The graph shows quantification of CD38 and CD45 positive cells from the images (n=3 fields obtained from a representative mouse from each treatment group). (g) NAD+ and NMN levels. Data are mean ± SEM, analyzed by unpaired two-sided t-test.
Figure 3.
Figure 3.. Senescence regulates CD38 accumulation in WAT in vivo.
(a-b) Immunofluorescent staining of WAT from young (2 month-old) and old (28 month-old) C57BL/6 mice. (a) Images of WAT stained with CD38 (red), lamin B1 (green), and ORF1 (yellow), representative of 3 mice per group. Insets show an enlarged portion of old tissue, with and without ORF1 signal, to highlight that CD38+ cells are present near ORF1+ lamin B1 cells. (b) Images of WAT stained with CD38 (red), CD45 (green), and ORF1 (yellow), representative of 6 mice per group. Insets show the image of old WAT with removal of green color channel CD45 signal (left) and with removal of red color channel CD38 signal (right) to show accumulation of CD38+ CD45+ cells near ORF1+ cells. (c-e) 12 month-old INK-ATTAC mice were treated with vehicle or AP20187 for 16 months. At 28 months these mice were euthanized and compared with 12 month-old INK-ATTAC mice. Analyses were performed in WAT. (c) Schematic of experiment. (d) p16 and Cd38 mRNA levels detected by qRT-PCR analysis (12 mo n=5 mice; 28 mo n=6 mice; 28 mo+AP n=12 mice) (e) NAD+ levels (12 mo n=5 mice; 28 mo n=6 mice; 28 mo+AP n=14 mice). (f-g) 18 month-old WT C57BL/6 mice were injected IP with DiI-labelled (yellow) senescent (SEN) or non-senescent (NS) mouse pre-adipocytes (mPA) from WT mice. (f) Schematic of experiment. (g) Immunofluorescent staining of CD38 (red) and CD45 (green) in WAT (representative of n=4 mice per group). Accumulation of CD38+ CD45+ cells was increased when senescent cells were injected. (h-j) 12 month-old CD38 KO mice were injected IP with vehicle, senescent (SEN), or non-senescent (NS) mPA from WT mice. 48 hours later, mice were injected with luciferase labeled PBMCs. Control mice received PBMCs only. (h) Schematic of experiment. (i) Representative images showing increase in luciferase+ PBMCs in mice injected with SEN mPA. (j) Relative Cd38 mRNA levels measured by qRT-PCR in WAT (Ctrl and SEN mPA n=7 mice; NS mPA n=8 mice). Data are mean ± SD (d,e) and SEM (j), analyzed by unpaired two-sided t-test.
Figure 4.
Figure 4.. The senescence-associated secretory phenotype (SASP) increases CD38 accumulation and decreases NAD+ levels in WAT in vivo.
(a-b)12 month-old WT mice received daily subcutaneous injection of conditioned media from senescent (CM-SEN) or non-senescent (CM-NS) mouse pre-adipocytes for 5 days, and were harvested at day 5. (a) CD38 activity (n=7 mice per group) and NAD+ levels (CM-NS n=7 mice; CM-SEN n=6 mice) were measured in subcutaneous WAT (Subq WAT). (b) Relative Cd38 (n=11 mice per group), Cd45, and F4/80 (CM-NS n=14 mice; CM-SEN n=12 mice) mRNA expression measured by qRT-PCR in Subq WAT. Levels were relative to CM-NS. (c-f) 26 month-old mice were treated with vehicle (Ctrl) or 3TC for 2 weeks. (c) Schematic of experiment. (d) Relative mRNA levels for p16 and SASP components measured by qRT-PCR in WAT (n=8 mice per group for all conditions except Pai1 3TC where n=7 mice). (e) Relative mRNA levels for F4/80 (n=8 mice per group), Cd38, Parp1, and Sirt1 (n=5 mice per group) measured by qRT-PCR in WAT. (f) Relative NAD+ levels in WAT (n=5 mice per group). Levels were relative to vehicle-treated mice. (g) Immunofluorescent staining of CD38 (red), lamin B1 (green), and IL6 (yellow) in WAT of young (2 month-old) and old (28 month-old) C57BL/6 mice, representative of 4 young and 6 old mice. Insets show enlarged area of old tissue with and without IL6 staining, to highlight that CD38 can be found near IL6+ lamin B1 cells. Data are mean ± SEM, analyzed by unpaired two-sided t-test. Two statistical outliers were identified in the Cd45 mRNA expression of the CM-SEN-treated animals (with values higher than 16) using the appropriate test in GraphPad Prism 6. These samples were excluded from all the PCR analyses for this experiment. Data were also analyzed by non-parametric Mann-Whitney using the full data set (including the identified statistical outliers) and the p value for Cd45 was 0.002.
Figure 5.
Figure 5.. CD38 is required for genotoxic/senescence-induced NAD+ decline.
(a-f) 12 month-old WT and transgenic catalytically inactive CD38 (CI) mice were treated with vehicle (Ctrl) or a single dose of doxorubicin (Doxo, 15 mg/kg), and WAT was harvested 10 days later for analyses (CI n=4 mice; WT, WT+Doxo, CI+Doxo n=5 mice per group). (a) Schematic of experiment. (b) p21, II6, Il1b, and F4/80 mRNA expression measured by qRT-PCR. (c) Cd38 mRNA expression measured by qRT-PCR. (d) Representative immunoblotting of CD38 protein levels and graph showing quantification of CD38 levels. The quantification is a ratio of CD38/tubulin levels (n=3 mice per group). (e) CD38 activity. (f) NAD+ levels. Data are mean ± SEM, analyzed by unpaired two-sided t-test.
Figure 6.
Figure 6.. The ecto-enzymatic activity of CD38 regulates availability of extracellular NMN to other cells.
(a-c) 293T cells were transfected with vector (V), CD38 WT, CD38 catalytically-inactive (CI), or CD38 Δ49 expression plasmid. (a) Representative immunoblotting (of four biologically independent samples) showing CD38 expression in whole cell lysates of 293T cells transfected with CD38 plasmids. (b) Immunofluorescence of fixed 293T cells transfected with CD38 plasmids (n=3 biologically independent samples). Cells were labeled with CD38 antibody and a membrane dye, followed by Hoechst staining. Yellow arrows indicate membrane CD38, white arrows show intracellular CD38. (c) NAD+ levels in transfected 293T cells (V, WT, Δ49 n=6; CI n=4 biologically independent samples). (d-e) 293T cells were transfected with vector, CD38 WT, or CD38 Δ49 and 20 hours later were incubated with isatuximab (isa, 5 μg/mL) or 78c (0.5 μM). When NMN was added, it was 4 hours after drugs. NAD+ levels were measured 20 hours after drug treatments (n=5 biologically independent samples). Levels are relative to vector-transfected cells. (f) NAD+ levels in AML12 cells co-cultured with 293T cells expressing CD38 plasmids. 293T cells were treated with and without 200 μM NMN 20 hours after transfection. AML 12 cells were collected 20 hours after addition of NMN (n=5 biologically independent samples). Levels are relative to vector-transfected cells. Data are mean ± SEM, analyzed by unpaired two-sided t-test, NS=non-significant.
Figure 7.
Figure 7.. Regulation of NAD+ and NMN levels by CD38 in macrophages.
(a-b) NAD+ levels in BMDM from 3 month-old WT (a) and CD38 KO (b) mice. Macrophages were treated with vehicle (Ctrl) or LPS (100 ng/mL), with or without 78c (0.5 μM) (n=7; with exception of WT LPS+78c where n=6 biologically independent samples). (c-k) BMDM isolated from 18 month-old WT mice. (c) NAD+ levels in macrophages treated with LPS (100 ng/mL), Ab68 (5 μg/mL), 78c (0.5 μM), and olaparib (olap, 5 μM) (Ctrl, LPS n=11; LPS+78c n=4; LPS+78c, LPS+olap, LPS+78c+olap n=9 biologically independent samples). (d) Macrophages were treated with LPS (100 ng/mL), Ab68 (5 μg/mL), 78c (0.5 μM), and olaparib (olap, 5 μM). 3 hours later, 300 μM NMN was added and cells were collected 20 hours later for NAD+ measurements (n=7 except for NMN+LPS+olap and NMN+LPS+olap+78c where n=6 biologically independent samples). (e) Representative immunoblotting of three biologically independent samples of M0 or M1 (LPS-treated) macrophages and AML12 lysates showing CD38 and Slc12a8. (f) NAD+ levels in AML 12 cells cocultured with macrophages. Macrophages were treated with LPS (100 ng/mL), Ab68 (10 μg/mL), and NMN (200 μM) before incubation with AML 12 cells (n=7 biologically independent samples except for LPS+Ab68 where n=5). (g) Extracellular NMN in culture media after treatment of macrophages with 100 μM NMN, LPS (100 ng/mL), and Ab68 (5 μg/mL). LPS was given 9 hours before NMN, and Ab68 was given 3 hours before NMN. Cells were incubated with NMN for 12 hours before media was collected (n=5 biologically independent samples). (h) NAD+ levels in AML 12 cells cocultured with macrophages. Macrophages were treated with LPS (100 ng/mL), Ab68 (10 μg/mL), and NR (200 μM) before incubation with AML 12 cells (n=5 biologically independent samples). (i) NAD+ levels in macrophages treated with CM from non-senescent (CM-NS) or senescent mouse pre-adipocytes (CM-SEN or CM-SEN + 78c (0.5 μM)) (n=6 biologically independent samples). (j-k) NAD+ (n=8 biologically independent samples except for CM SEN+NMN+Ab68 where n=7) and NMN levels (n=4 biologically independent samples) in AML 12 cells cocultured with macrophages. Macrophages were treated with CM-NS or CM-SEN from mouse preadipocytes, Ab68 (10 μg/mL), and NMN (200 μM) before incubation with AML 12 cells. All levels are relative to their respective control (Ctrl or CM-NS). Data are mean ± SEM, analyzed by unpaired two-sided t-test.
Fig. 8.
Fig. 8.. Blocking CD38 extracellular enzymatic activity regulates NMN, NAD+ levels, and CD38 activity in vivo.
(a-c) 4 month-old WT and CD38 KO mice were treated with vehicle (Ctrl), Ab68 (5 mg/kg), or Ab69 (5 mg/kg) by intraperitoneal (i.p.) injection on day 1 and day 5, and euthanized on day 8. (a) Relative CD38 activity in WAT. Levels are relative to control WT (Ctrl) (WT Ctrl n=6; WT Ab68, CD38 KO n=5; WT Ab69 n=3 mice). (b) NAD+ levels in WAT (WT n=4 mice; CD38 KO n=5 mice). (c) Heat map showing levels of metabolites in WT mice treated with Ab68 and Ab69 relative to Ctrl (n=4 mice per group). (d) 4 month-old WT mice were treated withFK866 (FK) (25 mg/kg) and/or Ab68 (5 mg/kg) (n=5 mice per group). NMN and NAD+ levels were measured in WAT. Levels are relative to Ctrl. (e) 22 month-old WT mice were injected i.p. with a single dose of vehicle (Ctrl) or Ab68 (5 mg/kg), euthanized at different time points, and NMN and NAD+ levels measured in WAT. Graphs show the time course of the relative increase of NMN or NAD+ in vehicle and Ab68-treated over levels at time 0 (n=4 mice per group). (f) 18 month-old mice were injected i.p. with a single dose of vehicle (Ctrl) or Ab68 (5 mg/kg) and mice were euthanized at different time points. NMN levels were measured in serum (Ctrl, 0, 24, 72 hours, and Ab68 72 hours n=4 mice per group; Ab68 24 hours n=5 mice; Ctrl 6 hours n=8 mice; Ab68 6 hours n=9 mice). (g) 18 month-old WT mice were injected i.p. with vehicle (Ctrl, NMN groups), 5 mg/kg Ab68 (Ab68, Ab68+NMN groups), with and without 500 mg/kg NMN. Serum NMN levels were determined (n=5 mice per group). (h) Absolute NAD+ levels in WAT of 3 month-old (young) and 18 month-old (old) mice were determined 3 days after treatment with a single injection i.p. injection of vehicle (Ctrl) or 5 mg/kg Ab68 (n=5 mice per group). (i) 3 month old and 18 month-old mice were treated with Ab68 and NMN as described in panel (g) and WAT levels of NAD+ were measured. NAD+ levels after each treatment are expressed relative to its age-matched control (vehicle treatment) (n=5 mice per group). Data are mean ± SEM, analyzed by unpaired two-sided t-test, except for (e-f) where data are analyzed by two-way ANOVA.
Fig. 9.
Fig. 9.. Schematic representation of the role of cellular senescence and sterile inflammation in the regulation of CD38 and NMN degradation.
In young mice, levels of CD38+ inflammatory cells and senescent cells in tissues are lower than older mice. During aging there is an increase in senescent cells that, at least in part, through their senescence associated secretory phenotype (SASP), promotes accumulation of CD38+ immune cells. The ecto-enzymatic activity of CD38 in immune cells degrades NMN extracellularly, preventing the NMN-induced NAD+ boosting in other cells in the tissue.

References

    1. Hogan KA, Chini CCS & Chini EN The Multi-faceted Ecto-enzyme CD38: Roles in Immunomodulation, Cancer, Aging, and Metabolic Diseases. Frontiers in Immunology 10, doi: 10.3389/fimmu.2019.01187 (2019). - DOI - PMC - PubMed
    1. Katsyuba E, Romani M, Hofer D & Auwerx J NAD+ homeostasis in health and disease. Nature Metabolism 2, 9–31, doi: 10.1038/s42255-019-0161-5 (2020). - DOI - PubMed
    1. Johnson S & Imai S-I NAD (+) biosynthesis, aging, and disease. F1000Research 7, 132–132, doi: 10.12688/f1000research.12120.1 (2018). - DOI - PMC - PubMed
    1. McReynolds MR, Chellappa K & Baur JA Age-related NAD(+) decline. Exp Gerontol 134, 110888, doi: 10.1016/j.exger.2020.110888 (2020). - DOI - PMC - PubMed
    1. Camacho-Pereira J et al. CD38 Dictates Age-Related NAD Decline and Mitochondrial Dysfunction through an SIRT3-Dependent Mechanism. Cell Metab 23, 1127–1139, doi: 10.1016/j.cmet.2016.05.006 (2016). - DOI - PMC - PubMed

Methods-only references

    1. Maier B et al. Modulation of mammalian life span by the short isoform of p53. Genes Dev 18, 306–319, doi: 10.1101/gad.1162404 (2004). - DOI - PMC - PubMed
    1. Detalle L et al. Generation and Characterization of ALX-0171, a Potent Novel Therapeutic Nanobody for the Treatment of Respiratory Syncytial Virus Infection. Antimicrob Agents Chemother 60, 6–13, doi: 10.1128/aac.01802-15 (2016). - DOI - PMC - PubMed
    1. Enever C, Batuwangala T, Plummer C & Sepp A Next generation immunotherapeutics--honing the magic bullet. Curr Opin Biotechnol 20, 405–411, doi: 10.1016/j.copbio.2009.07.002 (2009). - DOI - PubMed
    1. Hamers-Casterman C et al. Naturally occurring antibodies devoid of light chains. Nature 363, 446–448, doi: 10.1038/363446a0 (1993). - DOI - PubMed
    1. Konning D et al. Camelid and shark single domain antibodies: structural features and therapeutic potential. Curr Opin Struct Biol 45, 10–16, doi: 10.1016/j.sbi.2016.10.019 (2017). - DOI - PubMed

Publication types

MeSH terms