

Review
doi: 10.1007/s41745-020-00211-3.
Epub 2020 Nov 12.
City-Scale Agent-Based Simulators for the Study of Non-pharmaceutical Interventions in the Context of the COVID-19 Epidemic: IISc-TIFR COVID-19 City-Scale Simulation Team
Affiliations
- PMID: 33199946
- PMCID: PMC7657713
- DOI: 10.1007/s41745-020-00211-3
Item in Clipboard
Review
City-Scale Agent-Based Simulators for the Study of Non-pharmaceutical Interventions in the Context of the COVID-19 Epidemic: IISc-TIFR COVID-19 City-Scale Simulation Team
J Indian Inst Sci.
2020.
Abstract
We highlight the usefulness of city-scale agent-based simulators in studying various non-pharmaceutical interventions to manage an evolving pandemic. We ground our studies in the context of the COVID-19 pandemic and demonstrate the power of the simulator via several exploratory case studies in two metropolises, Bengaluru and Mumbai. Such tools may in time become a common-place item in the tool kit of the administrative authorities of large cities.
© Indian Institute of Science 2020.
Figures
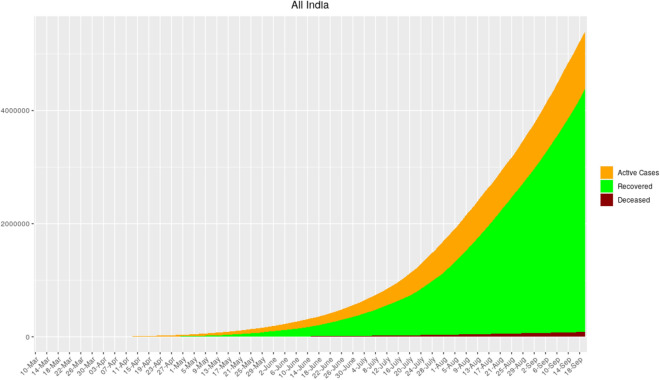
Timeline of COVID-19 cases, recoveries, and fatalities in India taken from. See and for detailed information on how COVID-19 progressed in India.
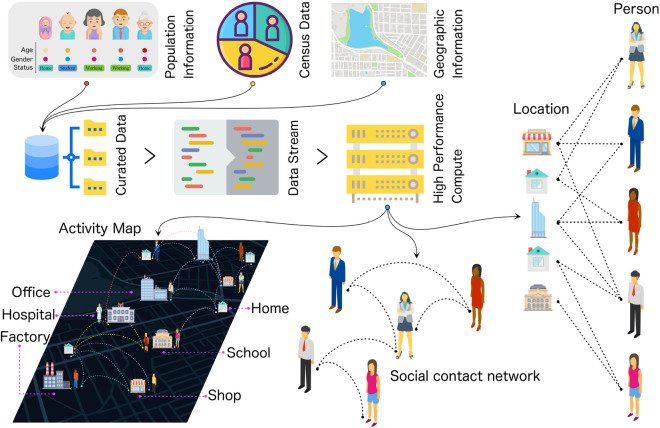
Schematic representation of an agent-based model.
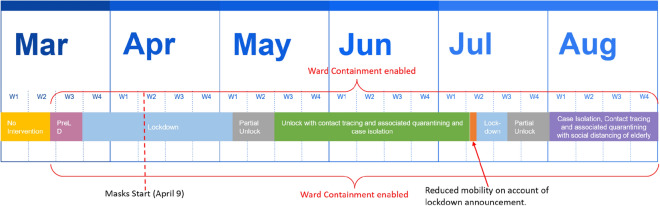
A timeline of Bengaluru interventions.
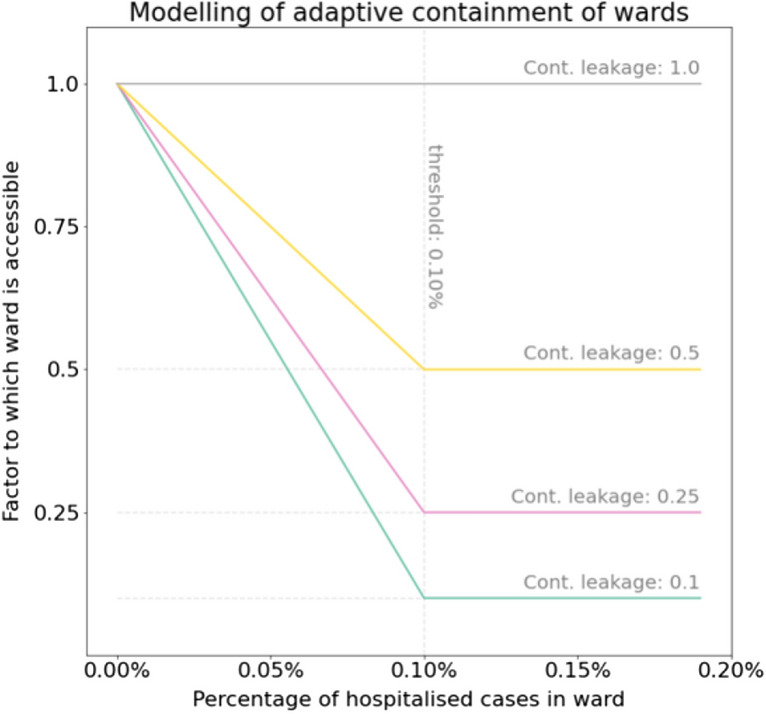
Wards are contained in a ‘soft’ way. The mobility is gradually decreased based on the signal of number of hospitalised cases in the ward. When 1 in 1000 in the ward is hospitalised, a local lockdown comes into effect.
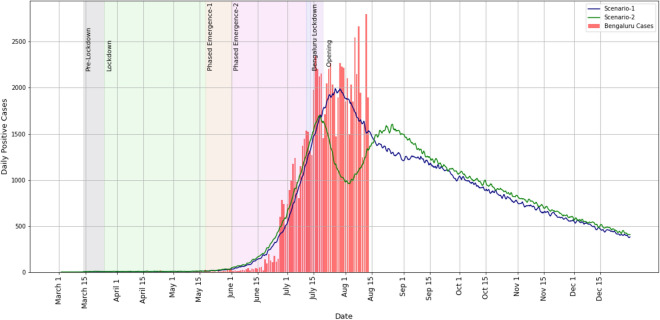
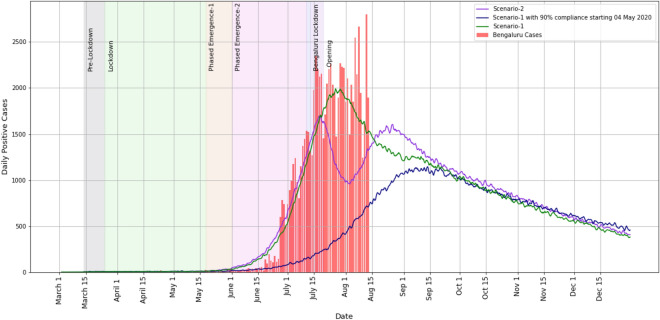
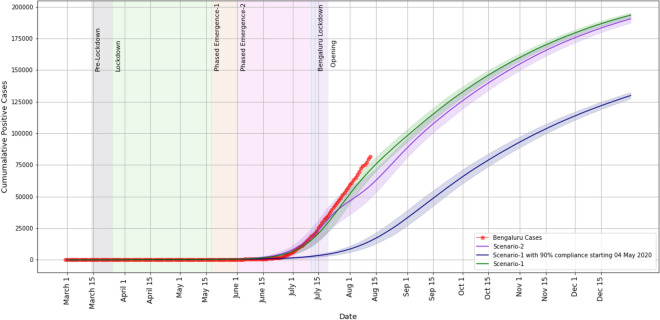
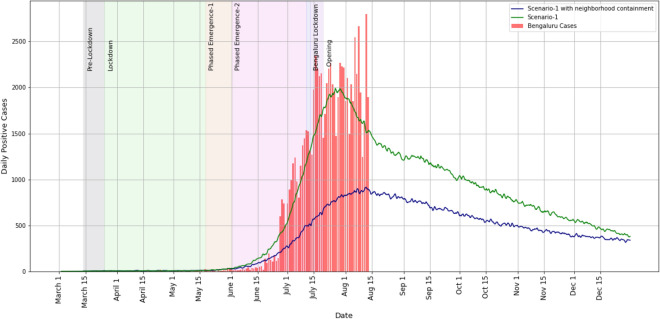
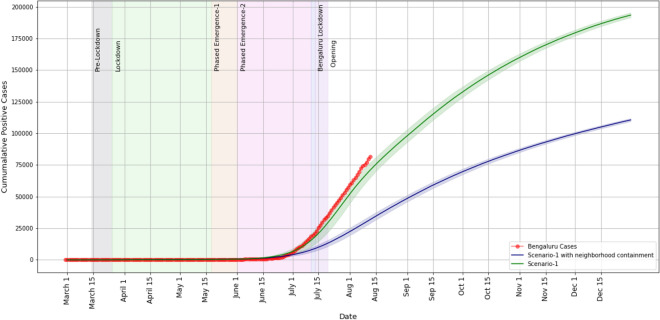
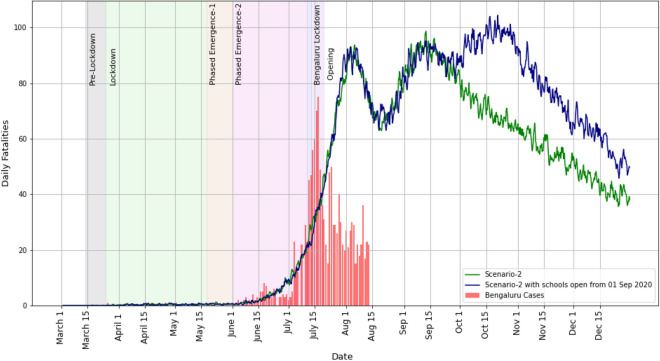
Bengaluru daily positive cases estimation. The red bars are the reported cases. The five shaded regions between 14 March and 01 June represent the durations of the various lockdown phases. The shaded region around 15 July represents a short 1-week lockdown. For cumulative case plots, see Fig. 11.
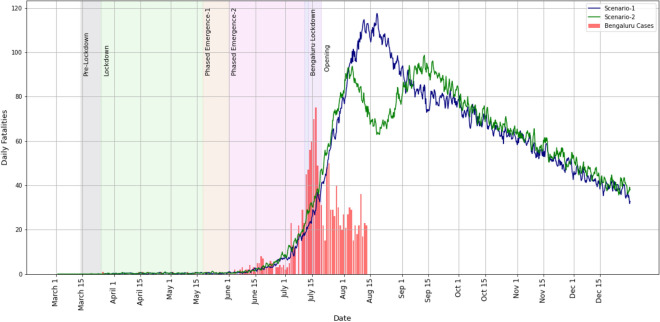
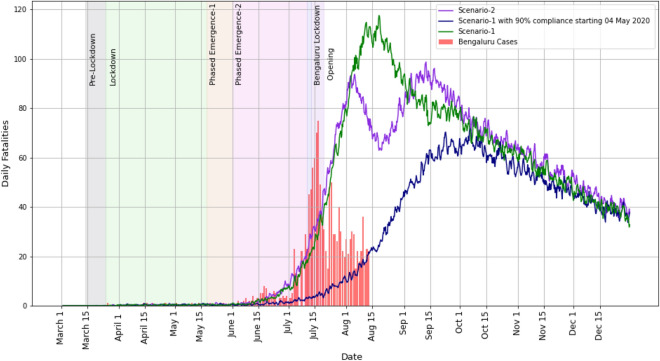
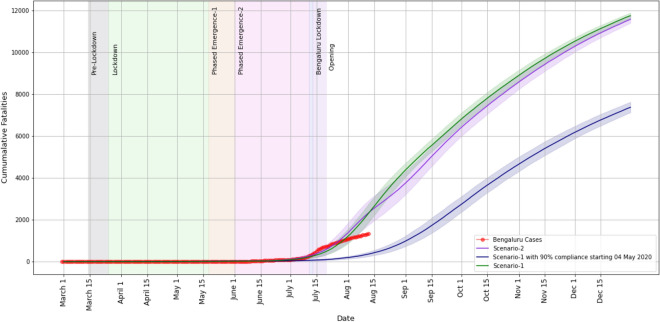
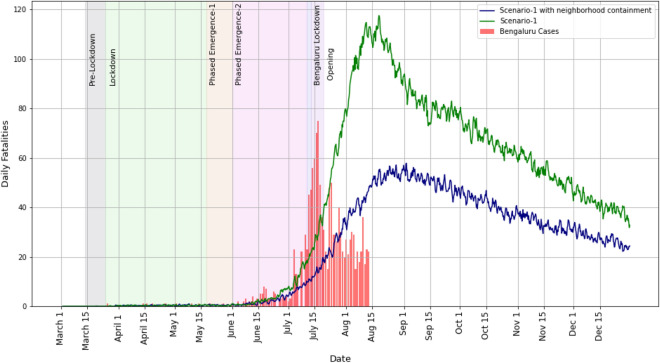
Bengaluru daily fatalities’ estimation. For cumulative fatalities, see Fig. 12 in a later case study.
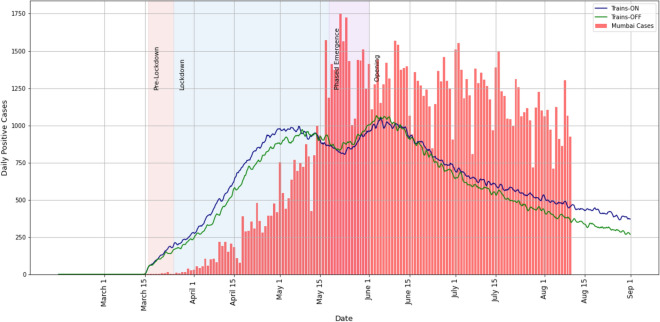
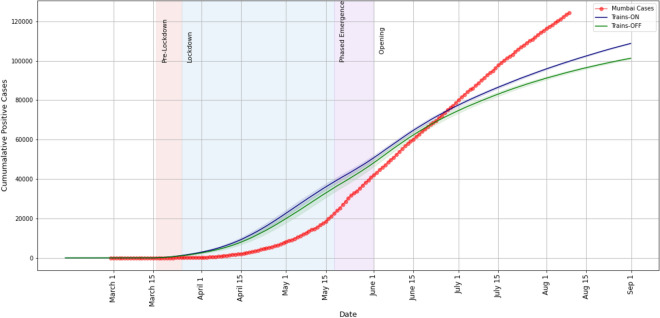
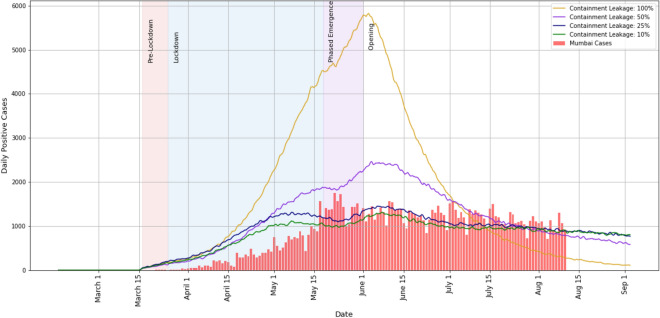
Mumbai daily positive cases’ estimation. The five shaded regions between 16 March and 01 June represent the durations of the various lockdown phases in Mumbai. For cumulative case plots, see Fig. 21.

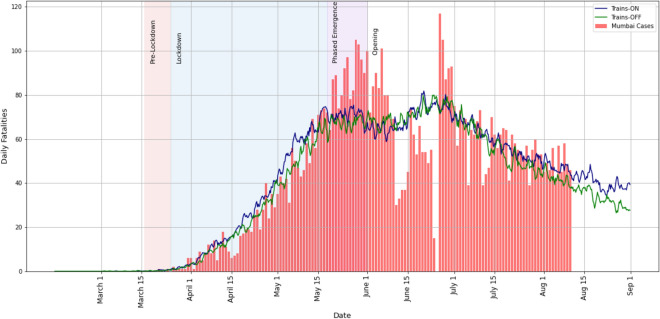
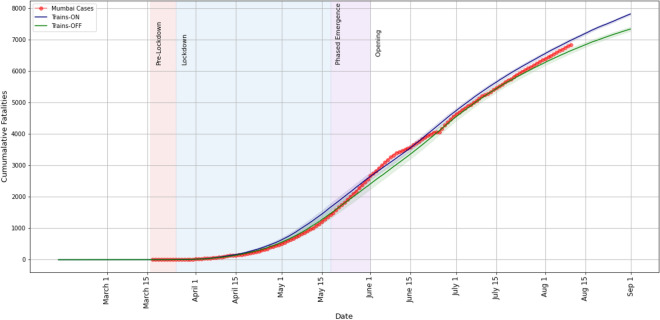
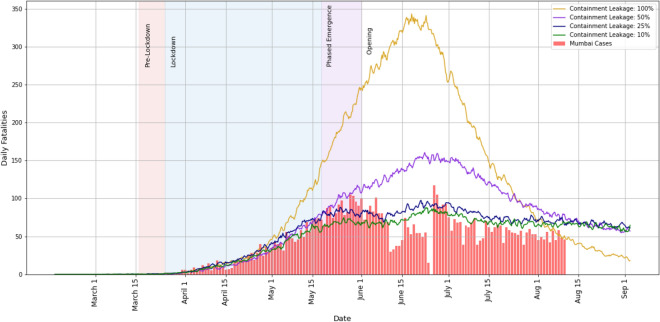
Mumbai daily fatalities’ estimation vs. corrected fatality time series, as corrected by BMC on 18 June 2020. For cumulative fatalities, see Fig. 22 in a later case study.
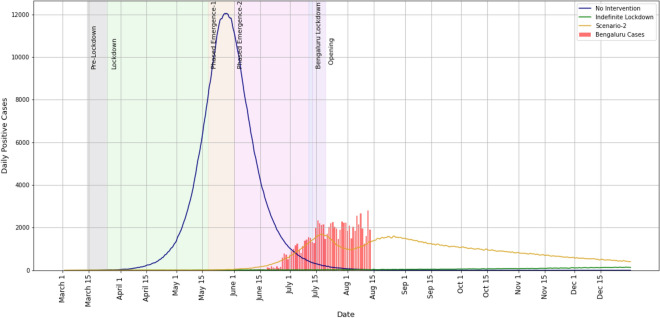
Case study A, Sect. 3.1: Bengaluru daily cases’ estimation. For a magnified view of the lower part of the plot, see Fig. 5. The no-intervention situation would have overwhelmed the healthcare system many times over.
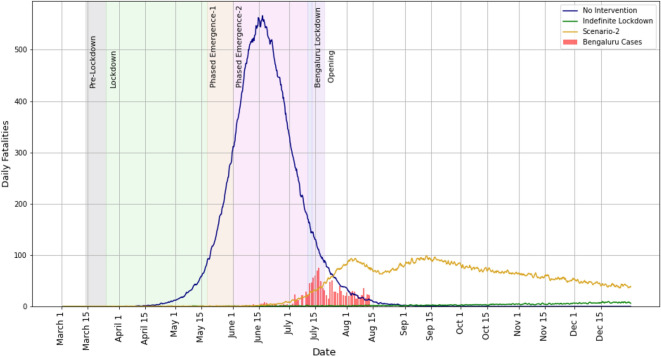
Case study A, Sect. 3.1: Bengaluru daily fatalities’ estimation. For a magnified view of the lower part of the part, see Fig. 6.
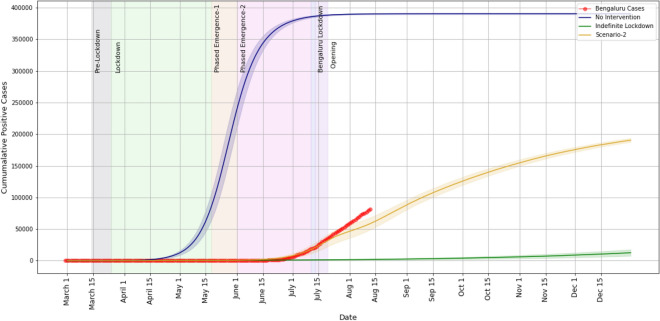
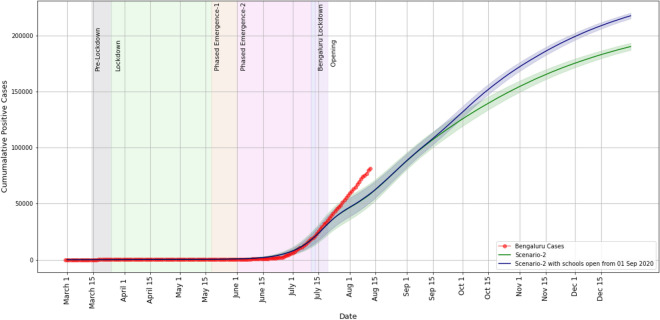
Case study A, Sect. 3.1: Bengaluru cumulative cases’ estimation.
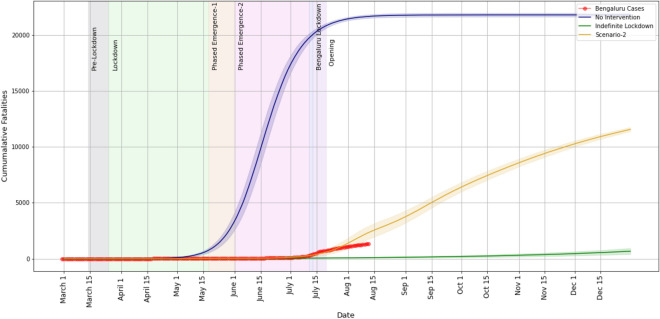
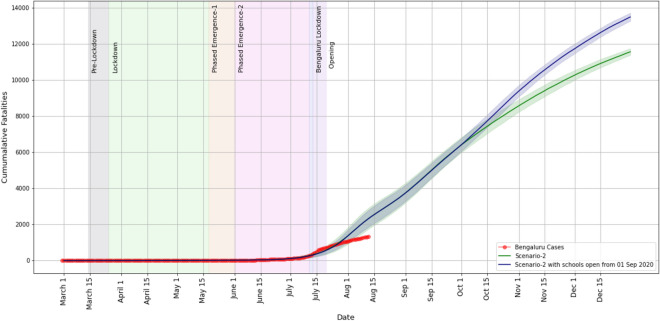
Case study A, Sect. 3.1: Bengaluru cumulative fatalities’ estimation.
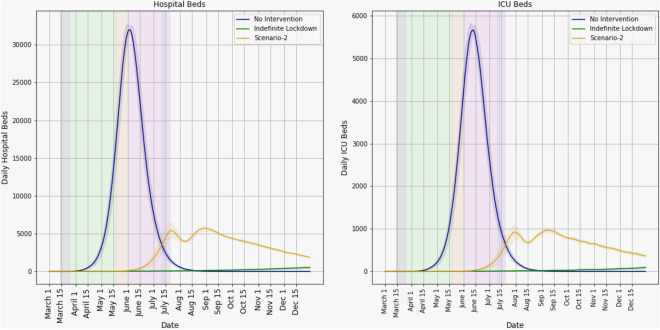
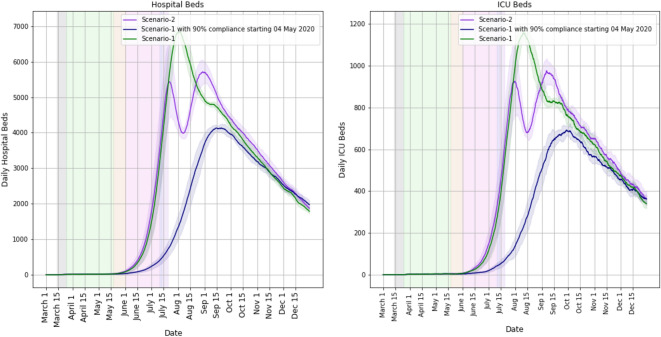
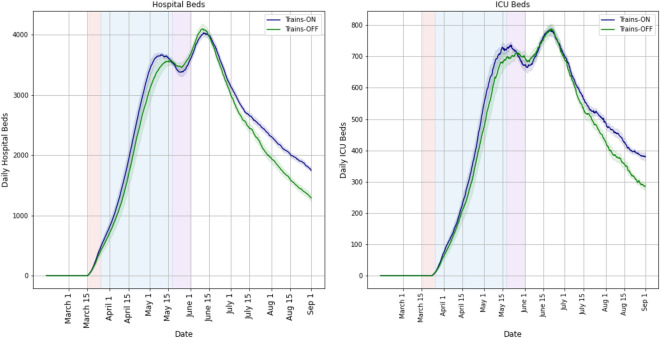
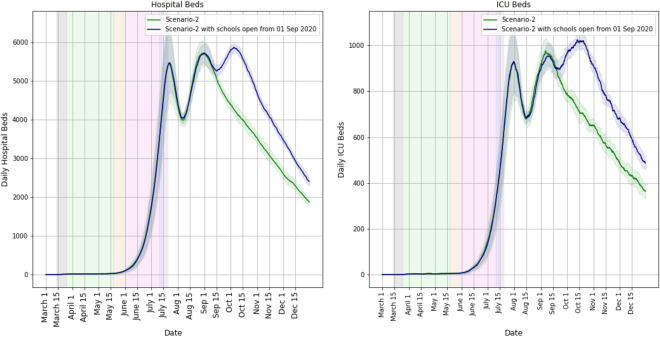
Case study A, Sect. 3.1: Bengaluru hospital beds’ estimation. ‘Hospital Beds’ refers to the number of beds occupied for regular care including possibly oxygen support. ‘ICU Beds’ refers to those that need intensive care or ventilation. The no-intervention scenario would have overwhelmed Bengaluru’s healthcare system.
Case study B, Sect. 3.2: Bengaluru daily cases’ estimation.
Case study B, Sect. 3.2: Bengaluru daily fatalities’ estimation.
Case study B, Sect. 3.2: Bengaluru cumulative cases’ estimation.
Case study B, Sect. 3.2: Bengaluru cumulative fatalities’ estimation.
Case study B, Sect. 3.2: Bengaluru hospital beds’ estimation.

Case study C, Sect. 3.3: Mumbai daily cases’ estimation.
Case study C, Sect. 3.3: Mumbai daily fatalities’ estimation.
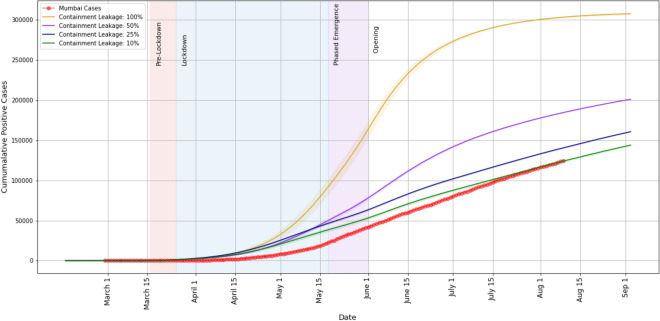
Case study C, Sect. 3.3: Mumbai cumulative cases’ estimation.
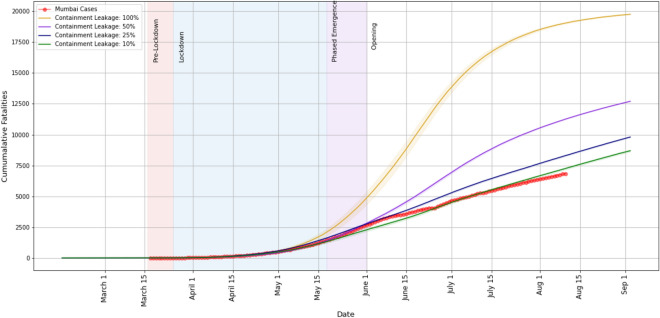
Case study C, Sect. 3.3: Mumbai cumulative fatalities’ estimation.
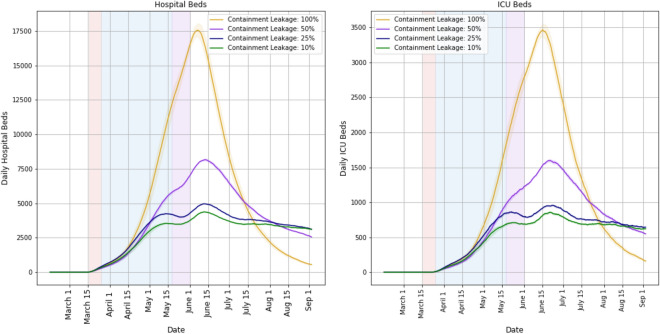
Case study C, Sect. 3.3: Mumbai hospital beds’ estimation.
Case study D, Sect. 3.4: Bengaluru daily cases’ estimation.
Case study D, Sect. 3.4: Bengaluru daily fatalities’ estimation.
Case study D, Sect. 3.4: Bengaluru cumulative cases’ estimation.
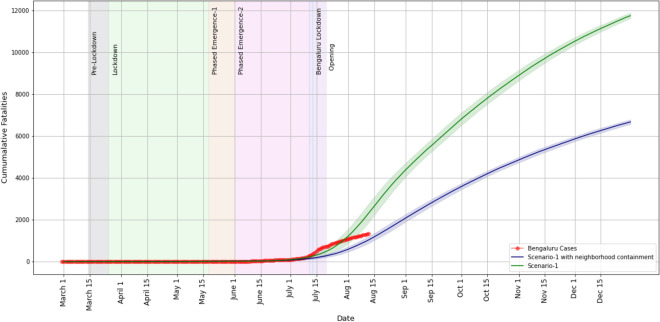
Case study D, Sect. 3.4: Bengaluru cumulative fatalities’ estimation.
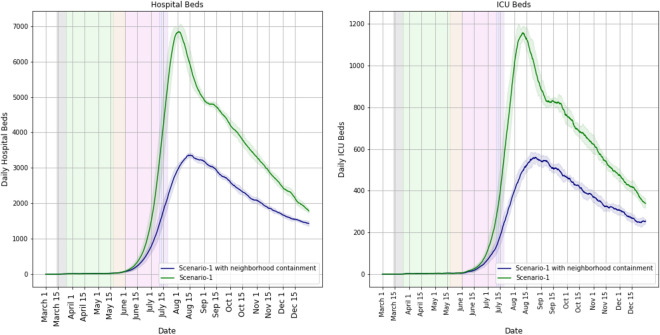
Case study D, Sect. 3.4: Bengaluru hospital beds’ estimation.
Case study E, Sect. 3.5: Mumbai daily cases’ estimation.
Case study E, Sect. 3.5: Mumbai daily fatalities’ estimation.
Case study E, Sect. 3.5: Mumbai cumulative cases’ estimation.
Case study E, Sect. 3.5: Mumbai cumulative fatalities’ estimation.
Case study E, Sect. 3.5: Mumbai hospital beds’ estimation.
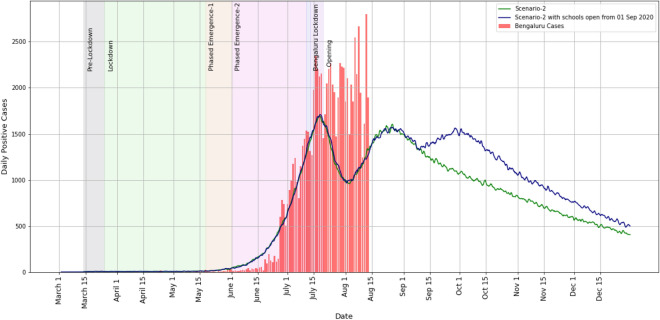
Case study F, Sect. 3.6: Bengaluru daily cases’ estimation.
Case study F, Sect. 3.6: Bengaluru daily fatalities’ estimation.
Case study F, Sect. 3.6: Bengaluru cumulative cases’ estimation.
Case study F, Sect. 3.6: Bengaluru cumulative fatalities’ estimation.
Case study F, Sect. 3.6: Bengaluru hospital beds’ estimation.
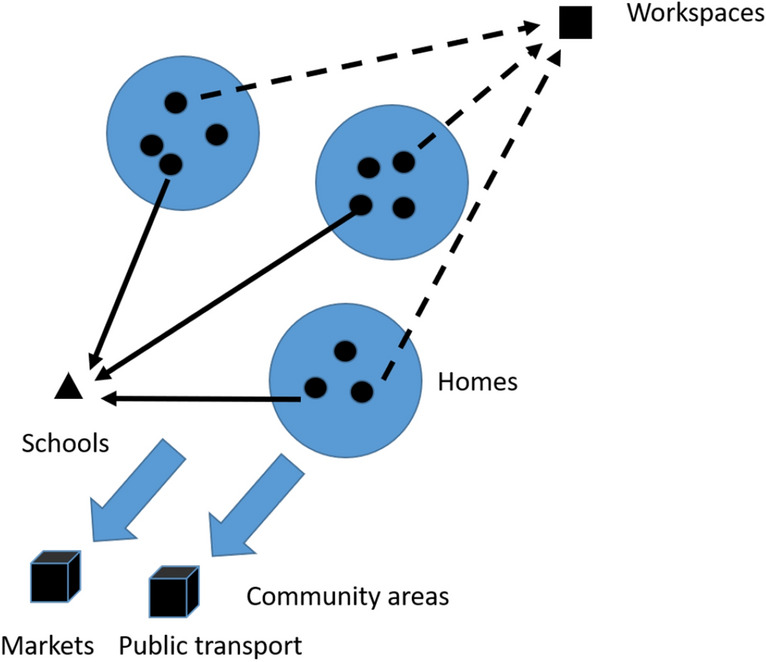
Various interaction spaces, solid circles inside homes indicate individuals.
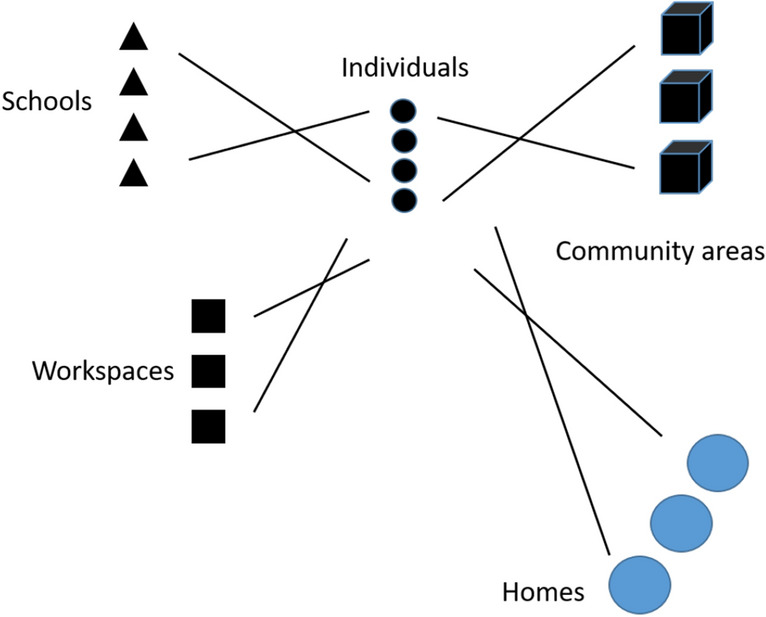
Bipartite graph abstraction of interaction spaces.
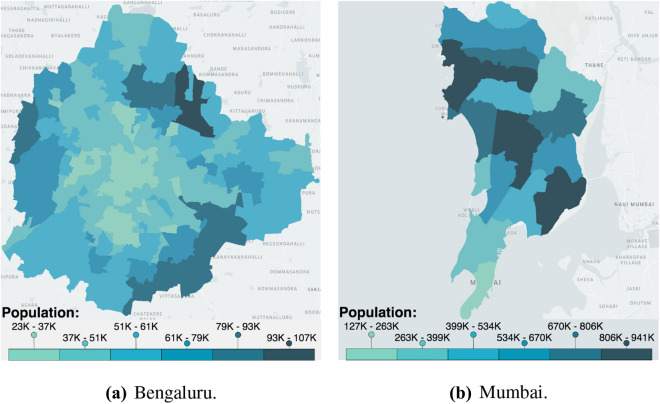
Population density maps of Bengaluru and Mumbai.
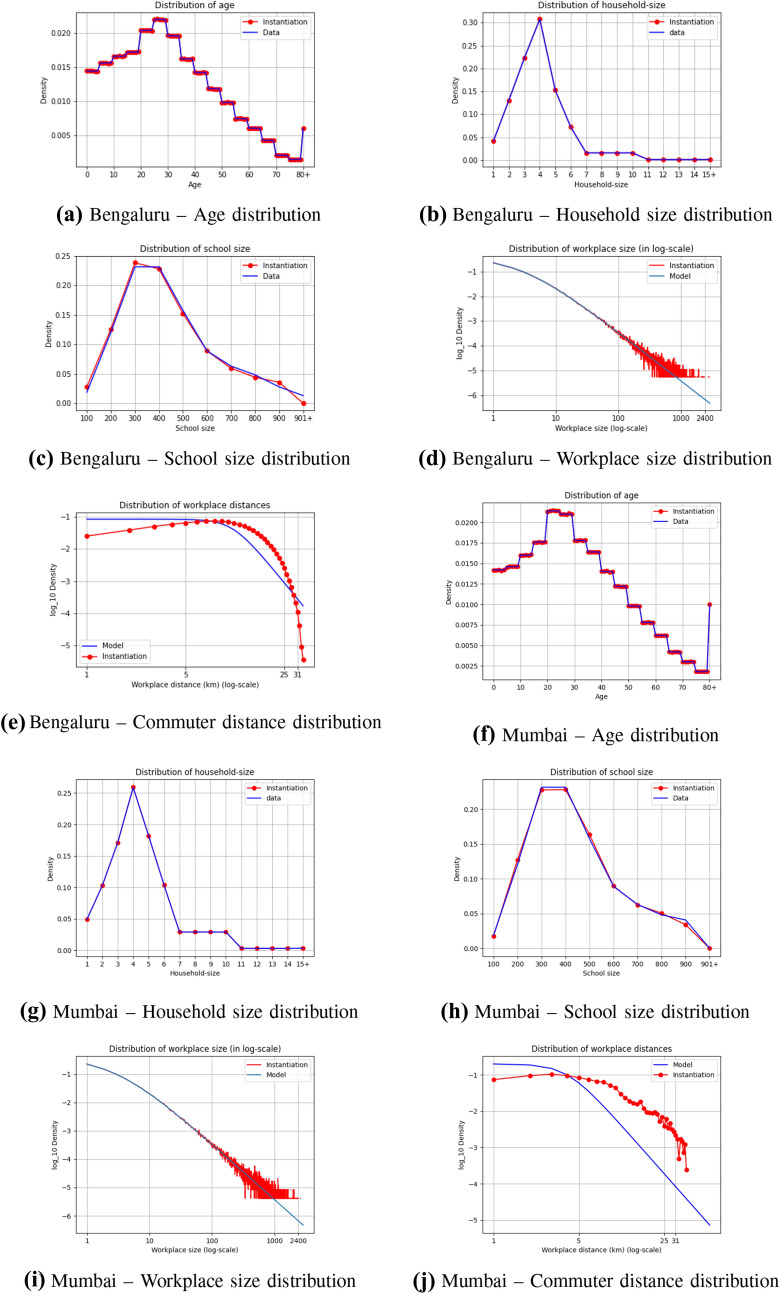
Validation of our synthetic Bengaluru and Mumbai. a–e Shows the validation plots for Bengaluru and f–j shows the validation plots for Mumbai.
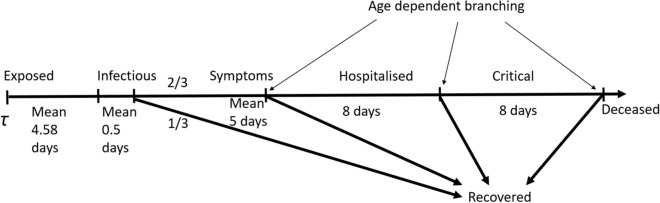
A simplified model of COVID-19 progression.
Similar articles
-
A multi-scale agent-based model of infectious disease transmission to assess the impact of vaccination and non-pharmaceutical interventions: The COVID-19 case.J Saf Sci Resil. 2021 Dec;2(4):199-207. doi: 10.1016/j.jnlssr.2021.08.005. Epub 2021 Sep 4. J Saf Sci Resil. 2021. PMID: 40477798 Free PMC article.
-
PaCAR: COVID-19 Pandemic Control Decision Making via Large-Scale Agent-Based Modeling and Deep Reinforcement Learning.Med Decis Making. 2022 Nov;42(8):1064-1077. doi: 10.1177/0272989X221107902. Epub 2022 Jul 1. Med Decis Making. 2022. PMID: 35775610
-
COMOKIT: A Modeling Kit to Understand, Analyze, and Compare the Impacts of Mitigation Policies Against the COVID-19 Epidemic at the Scale of a City.Front Public Health. 2020 Sep 24;8:563247. doi: 10.3389/fpubh.2020.563247. eCollection 2020. Front Public Health. 2020. PMID: 33072700 Free PMC article.
-
[Simulation-based training in urology: A systematic literature review].Prog Urol. 2019 May-Jun;29(6):295-311. doi: 10.1016/j.purol.2019.03.003. Epub 2019 Apr 29. Prog Urol. 2019. PMID: 31047788 French.
-
[Simulators and other tools in orthopedic-trauma surgery training].Orthopadie (Heidelb). 2023 Jul;52(7):539-546. doi: 10.1007/s00132-023-04394-2. Epub 2023 Jun 7. Orthopadie (Heidelb). 2023. PMID: 37286622 Free PMC article. Review. German.
Cited by
-
Epihiper-A high performance computational modeling framework to support epidemic science.PNAS Nexus. 2024 Dec 11;4(1):pgae557. doi: 10.1093/pnasnexus/pgae557. eCollection 2025 Jan. PNAS Nexus. 2024. PMID: 39720202 Free PMC article.
-
Safe Blues: The case for virtual safe virus spread in the long-term fight against epidemics.Patterns (N Y). 2021 Mar 12;2(3):100220. doi: 10.1016/j.patter.2021.100220. eCollection 2021 Mar 12. Patterns (N Y). 2021. PMID: 33748797 Free PMC article. Review.
-
Leveraging multi-tier healthcare facility network simulations for capacity planning in a pandemic.Socioecon Plann Sci. 2023 Jun 24:101660. doi: 10.1016/j.seps.2023.101660. Online ahead of print. Socioecon Plann Sci. 2023. PMID: 38620120 Free PMC article.
-
Using simulation modelling and systems science to help contain COVID-19: A systematic review.Syst Res Behav Sci. 2022 Aug 19:10.1002/sres.2897. doi: 10.1002/sres.2897. Online ahead of print. Syst Res Behav Sci. 2022. PMID: 36245570 Free PMC article.
-
Epidemic dynamics in census-calibrated modular contact network.Netw Model Anal Health Inform Bioinform. 2023;12(1):14. doi: 10.1007/s13721-022-00402-1. Epub 2023 Jan 10. Netw Model Anal Health Inform Bioinform. 2023. PMID: 36685658 Free PMC article.
References
-
- Ministry of Health and Family Welfare, Government of India. [Online]. https://www.mohfw.gov.in/. Accessed 11 Aug 2020
-
- Kermack WO, McKendrick AG, (1927) A contribution to the mathematical theory of epidemics. In: Proceedings of the royal society of london. Series A, Containing papers of a mathematical and physical character, vol 115(772), pp 700–721
-
- Shekatkar S, Pujari B, Arjunwadkar M, Hazra DK, Chaudhuri P, Sinha S, Menon GI, Sharma A, Guttal V (2020) INDSCI-SIM A state-level epidemiological model for India, ongoing Study at https://indscicov.in/indscisim
-
- Prakash MK, Kaushal S, Bhattacharya S, Chandran A, Kumar A, Ansumali S (2020) A minimal and adaptive prediction strategy for critical resource planning in a pandemic. medRxiv - PubMed
-
- Ganesan S, Subramani D (2020) Spatio-temporal predictive modeling framework for infectious disease spread, arXiv preprint arXiv:2006.15336 - PMC - PubMed
Publication types
LinkOut - more resources
Full Text Sources