

A Novel Approach to Quantitative Evaluation of Outer Retinal Lesions Via a New Parameter "Integral" in Spectral Domain Optical Coherence Tomography
- PMID: 33200049
- PMCID: PMC7645250
- DOI: 10.1167/tvst.9.12.8
A Novel Approach to Quantitative Evaluation of Outer Retinal Lesions Via a New Parameter "Integral" in Spectral Domain Optical Coherence Tomography
Abstract
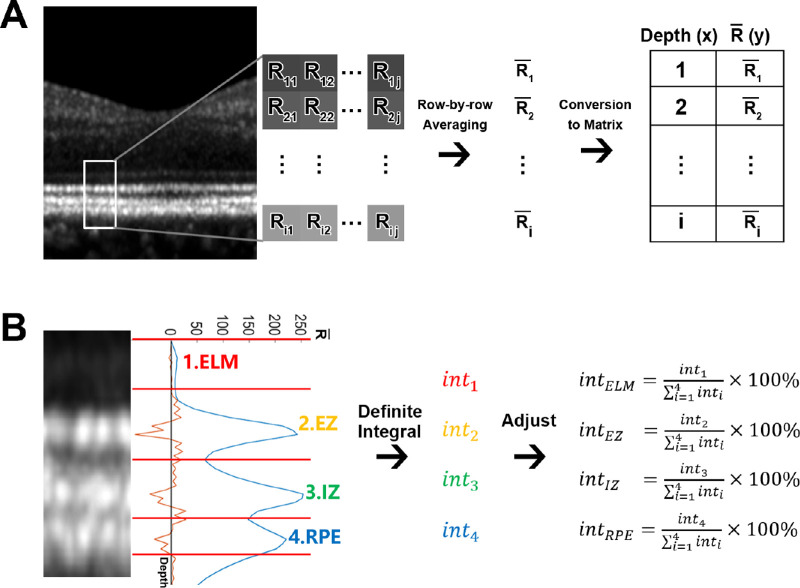
Purpose: The purpose of this study was to design a new parameter "integral" to quantitatively evaluate the spatial cumulative reflectivity of the outer retinal layers in optical coherence tomography (OCT), and to investigate its role in the detection of outer retinal diseases.
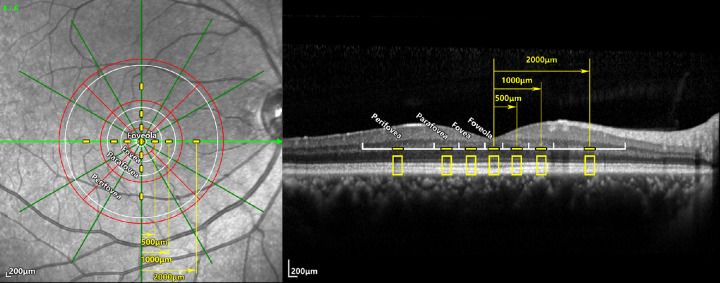
Methods: This was a cross-sectional study. Fovea-centered line OCT scans were performed on 60 eyes of 60 healthy volunteers and 44 eyes of 44 patients diagnosed with outer retinal diseases. The integrals of the ellipsoid zone (EZ) and interdigitation zone (IZ) were measured by respectively accumulating the grayscale values of all the pixels within the EZ and IZ at specified locations on the scanning lines, and were then adjusted by calculating their percentages on the outer retina. The integrals of the EZ and IZ were compared between the two groups.
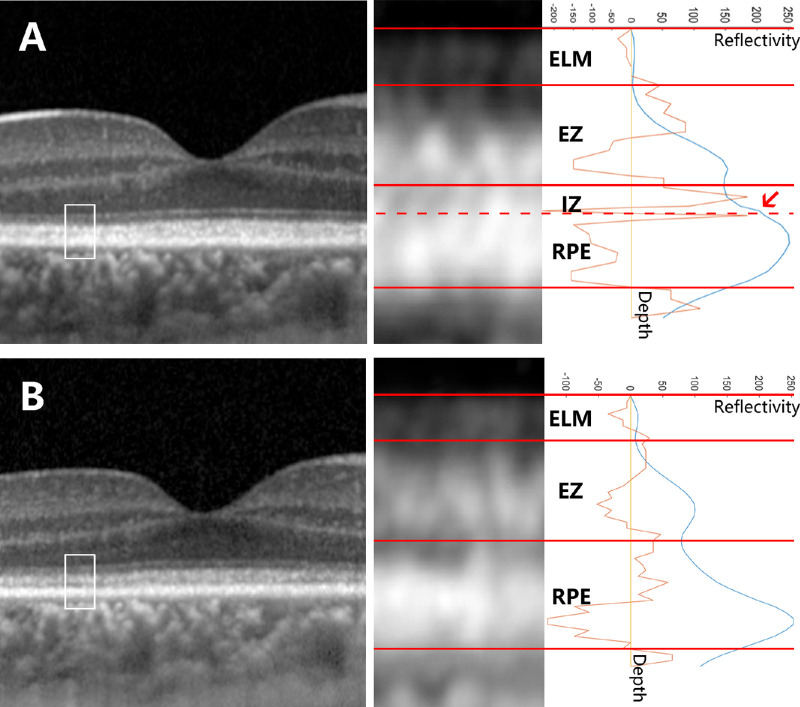
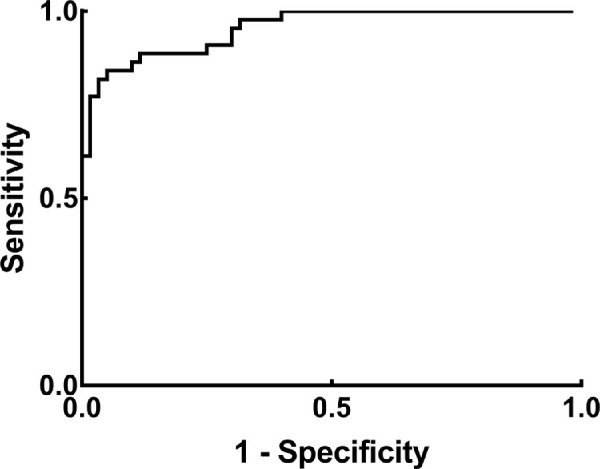
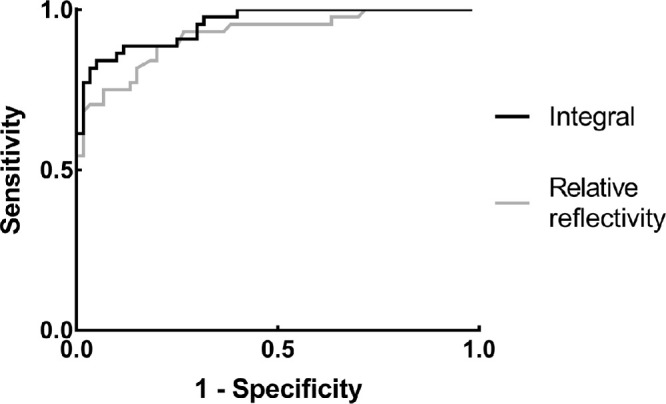
Results: The integrals of the EZ and IZ were stably and normally distributed in the healthy eyes, and were significantly lower in eyes with outer retinal lesions than in healthy ones (P < 0.05). Moreover, the integrals of the EZ and IZ were correlated with best corrected visual acuity (BCVA; adjusted R2 = 0.620) and the presence of outer retinal lesions (Nagelkerke R2 = 0.767). The area under the receiver operating characteristic (ROC) curve was 0.954 (95% confidence interval [CI] = 0.918-0.990) when the integral was selected as a diagnostic variable.
Conclusions: Obtained from this novel quantification method, the new parameter integral was comparable between different individuals and had the potential to detect outer retinal abnormalities in reflectivity through OCT.
Translational relevance: Our work verified the feasibility of the new image analysis technique in the detection of the diseases affecting the outer retina.
Keywords: ellipsoid zone; interdigitation zone; outer retinal lesion; spectral domain optical coherence tomography.
Copyright 2020 The Authors.
Conflict of interest statement
Disclosures: J. Gu, None; T. Jiang, None; M. Yu, None; J. Yu, None; W. Li, None; S. Liu, None; P. Zhang, None; W. Chen, None; Q. Chang, None
Figures
Similar articles
-
Volume-accumulated reflectivity of the outer retina (integral) on spectral domain optical coherence tomography as a predictor of cone cell density: a pilot study.BMC Ophthalmol. 2023 Mar 14;23(1):100. doi: 10.1186/s12886-023-02827-2. BMC Ophthalmol. 2023. PMID: 36918830 Free PMC article.
-
Outer retinal layers as predictors of visual acuity in retinitis pigmentosa: a cross-sectional study.Graefes Arch Clin Exp Ophthalmol. 2019 Feb;257(2):265-271. doi: 10.1007/s00417-018-4185-4. Epub 2018 Nov 19. Graefes Arch Clin Exp Ophthalmol. 2019. PMID: 30456418
-
Predictive value of spectral-domain optical coherence tomography features in assessment of visual prognosis in eyes with acute welding arc maculopathy.Int Ophthalmol. 2019 May;39(5):1081-1088. doi: 10.1007/s10792-018-0919-x. Epub 2018 Apr 12. Int Ophthalmol. 2019. PMID: 29651692
-
Evaluation of the correlation between quantitative measurement of the foveal avascular zone and retinal vessel density and outer retinal disruptions in diabetic patients.Turk J Med Sci. 2019 Aug 8;49(2):1041-6. doi: 10.3906/sag-1901-22. Turk J Med Sci. 2019. PMID: 30920190 Free PMC article.
-
Quantitative analysis of external limiting membrane, ellipsoid zone and interdigitation zone defects in patients with macular holes.Graefes Arch Clin Exp Ophthalmol. 2017 Jul;255(7):1297-1306. doi: 10.1007/s00417-017-3636-7. Epub 2017 Apr 15. Graefes Arch Clin Exp Ophthalmol. 2017. PMID: 28412772
Cited by
-
Alterations of outer retinal reflectivity in diabetic patients without clinically detectable retinopathy.Graefes Arch Clin Exp Ophthalmol. 2024 Jan;262(1):61-72. doi: 10.1007/s00417-023-06238-3. Epub 2023 Sep 23. Graefes Arch Clin Exp Ophthalmol. 2024. PMID: 37740747
-
The perspective of ceRNA regulation of circadian rhythm on choroidal neovascularization.Sci Rep. 2024 Nov 9;14(1):27359. doi: 10.1038/s41598-024-78479-z. Sci Rep. 2024. PMID: 39521855 Free PMC article.
-
Noninvasive Ophthalmic Imaging Measures Retinal Degeneration and Vision Deficits in Ndufs4-/- Mouse Model of Mitochondrial Complex I Deficiency.Transl Vis Sci Technol. 2022 Aug 1;11(8):5. doi: 10.1167/tvst.11.8.5. Transl Vis Sci Technol. 2022. PMID: 35921115 Free PMC article.
-
Volume-accumulated reflectivity of the outer retina (integral) on spectral domain optical coherence tomography as a predictor of cone cell density: a pilot study.BMC Ophthalmol. 2023 Mar 14;23(1):100. doi: 10.1186/s12886-023-02827-2. BMC Ophthalmol. 2023. PMID: 36918830 Free PMC article.
-
Challenges Associated With Ellipsoid Zone Intensity Measurements Using Optical Coherence Tomography.Transl Vis Sci Technol. 2021 Oct 4;10(12):27. doi: 10.1167/tvst.10.12.27. Transl Vis Sci Technol. 2021. PMID: 34665233 Free PMC article.
References
-
- Geitzenauer W, Hitzenberger CK, Schmidt-Erfurth UM. Retinal optical coherence tomography: past, present and future perspectives. Br J Ophthalmol. 2011; 95(2): 171–177. - PubMed
-
- Leung CK, Lam S, Weinreb RN, et al. .. Retinal nerve fiber layer imaging with spectral-domain optical coherence tomography: analysis of the retinal nerve fiber layer map for glaucoma detection. Ophthalmology. 2010; 117(9): 1684–1691. - PubMed
-
- Comander J, Gardiner M, Loewenstein J. High-resolution optical coherence tomography findings in solar maculopathy and the differential diagnosis of outer retinal holes. Am J Ophthalmol. 2011; 152(3): 413–419.e6. - PubMed
-
- Pelosini L, Hull CC, Boyce JF, et al. .. Optical coherence tomography may be used to predict visual acuity in patients with macular edema. Invest Ophthalmol Vis Sci. 2011; 52(5): 2741–2748. - PubMed
Publication types
MeSH terms
LinkOut - more resources
Full Text Sources
Other Literature Sources
