

Quantifying Color Vision Changes Associated With Cataracts Using Cone Contrast Thresholds
- PMID: 33200052
- PMCID: PMC7645251
- DOI: 10.1167/tvst.9.12.11
Quantifying Color Vision Changes Associated With Cataracts Using Cone Contrast Thresholds
Abstract
Purpose: To evaluate effects of age and simulated and real cataractous changes on color vision as measured by the high-definition cone contrast test (CCT).
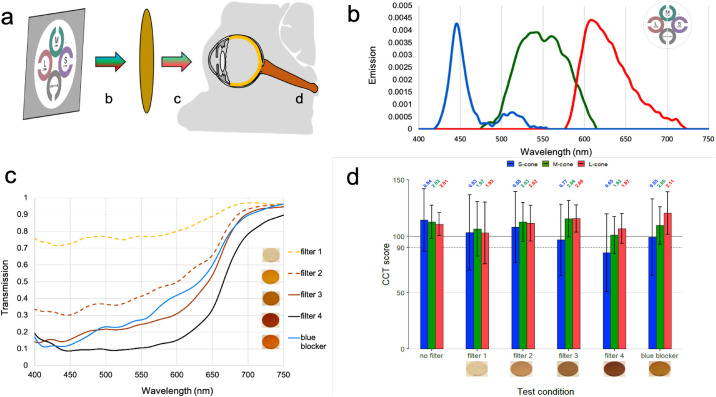
Methods: Twenty-four healthy volunteers from two cohort studies performed CCT using best-corrected visual acuity, filters, mydriasis, and pinhole correction. Retrospective cross-sectional study of patients seen in eye clinics evaluated the relationship between age and color vision, and age and lens status in 355 eyes. Last, 25 subjects underwent CCT before and after cataract surgery.
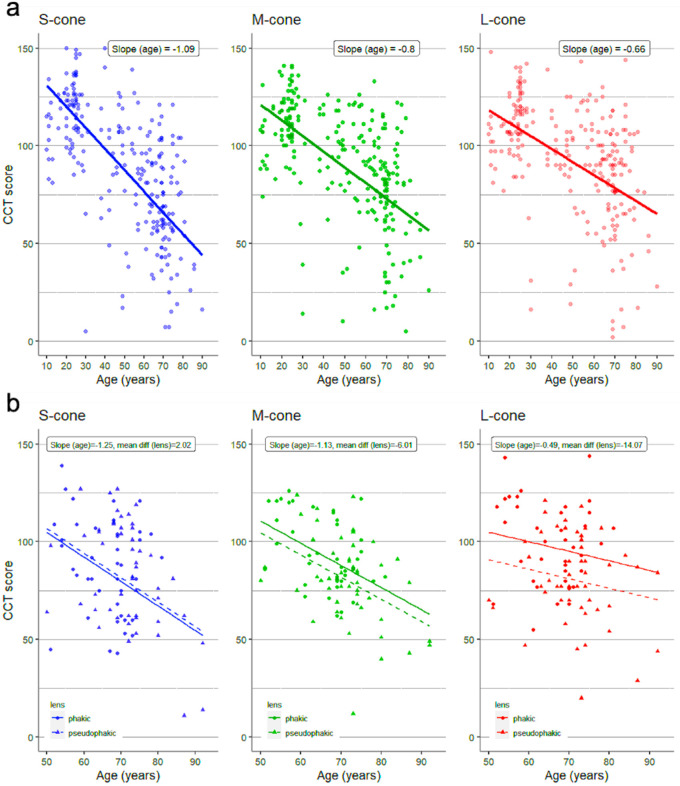
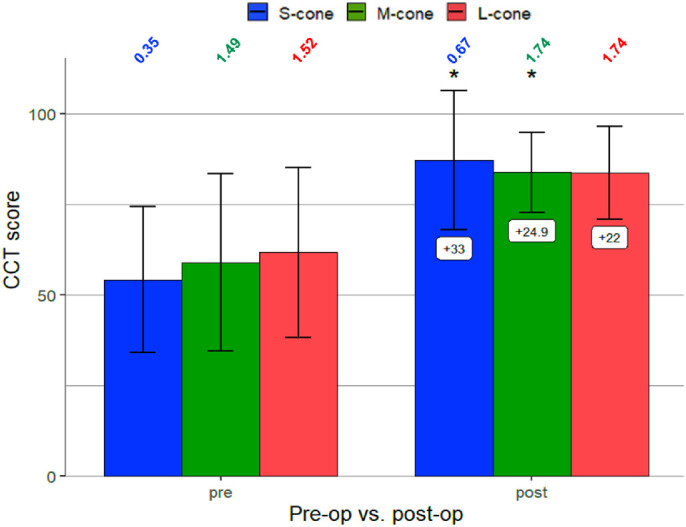
Results: CCT scores were most reliable in the nonmydriatic condition without pinhole correction. Progressively dense brown filters produced small decreases in S-cone sensitivity. Linear regression analysis of phakic subjects showed a decline for all cone classes with age. Rate of decline was greater for S-cones (slope = -1.09; 95% confidence interval [CI], -1.30 to 0.86) than M-cones (slope = -0.80; 95% CI, -1.03 to -0.58) and L-cones (slope = -0.66; 95% CI, -0.88 to -0.44). CCT scores increased for S-cones but reduced for L- and M-cones in pseudophakic subjects compared with phakic patients. CCT scores after cataract surgery increased for S-cones, M-cones, and L-cones by 33.0 (95% CI, 8.6 to 57.4), 24.9 (95% CI, 3.8 to 46.0), and 22.0 (95% CI, -3.2 to 47.3), respectively.
Conclusions: CCT assessment allows for clinically practical quantitation of color and contrast vision improvement after cataract surgery and aging patients who note poor vision despite good visual acuity.
Translational relevance: CCT testing, which quantifies hereditary and acquired color deficiency, can also quantify the degree of cataract severity and, combined with other parameters, can provide more precise guidance for cataract extraction to optimize patient care.
Keywords: age-related decline in color vision; color vision changes associated with aging; color vision changes before and after cataract surgery; cone contrast test; cone contrast threshold.
Copyright 2020 The Authors.
Conflict of interest statement
Disclosure: U. Mehta, None; A. Diep, None; K. Nguyen, None; B. Le, None; C. Yuh, None; C. Frambach, None; J. Doan, None; A. Wei, None; A.M. Palma, None; M. Farid, None; S. Garg, None; S. Kedhar, None; M. Wade, None; K.A. Marshall, None; K.A. Jameson, None; M.C. Kenney, None; A.W. Browne, None
Figures

References
-
- Fristrom B, Lundh BL. Colour contrast sensitivity in cataract and pseudophakia. Acta Ophthalmol Scand. 2000; 78(5): 506–511. - PubMed
-
- Paramei GV, Oakley B. Variation of color discrimination across the life span. J Opt Soc Am A Opt Image Sci Vis. 2014; 31(4): A375–A384. - PubMed
-
- Skomrock LK, Richardson VE. Simulating age-related changes in color vision to assess the ability of older adults to take medication. Consult Pharm. 2010; 25(3): 163–170. - PubMed
-
- Gillespie-Gallery H, Konstantakopoulou E, Harlow JA, Barbur JL. Capturing age-related changes in functional contrast sensitivity with decreasing light levels in monocular and binocular vision. Invest Ophthalmol Vis Sci. 2013; 54(9): 6093–6103. - PubMed
