. 2020 Dec:33:106519.
doi: 10.1016/j.dib.2020.106519. Epub 2020 Nov 10.

Prothrombotic hemostasis disturbances in patients with severe COVID-19: Individual daily data

Affiliations

Prothrombotic hemostasis disturbances in patients with severe COVID-19: Individual daily data

Michaël Hardy et al. Data Brief. 2020 Dec.

Abstract

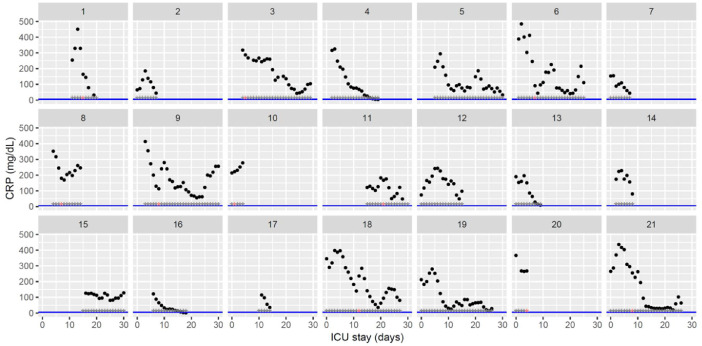
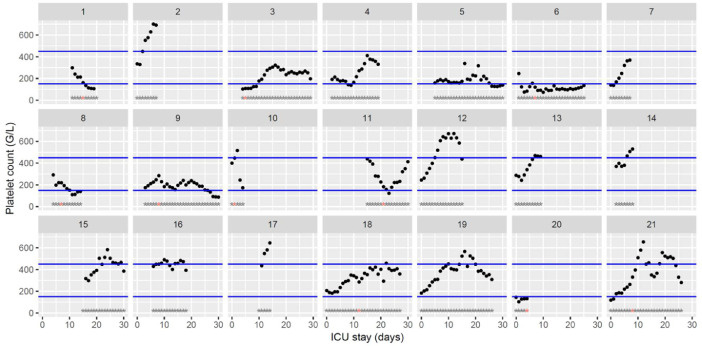
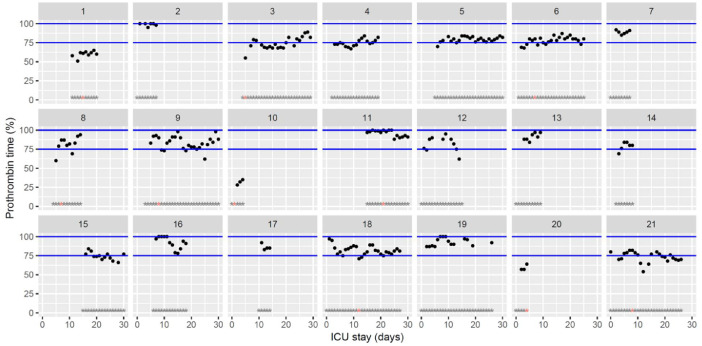
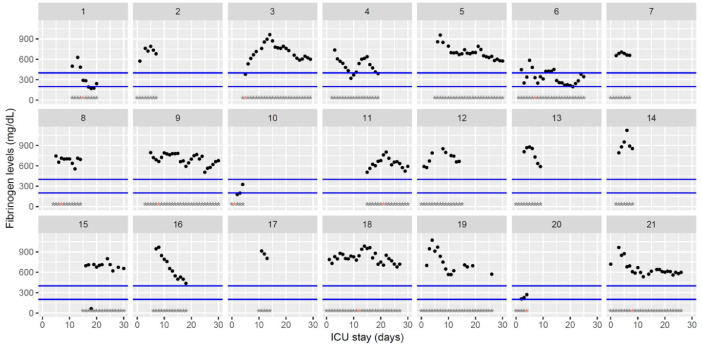
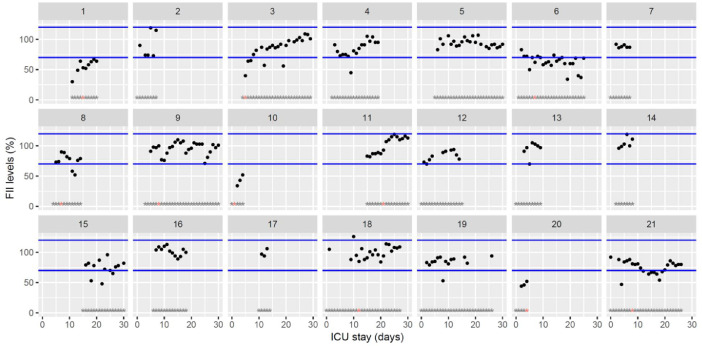
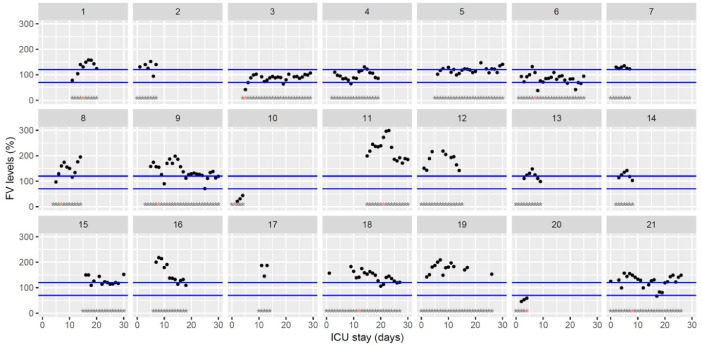
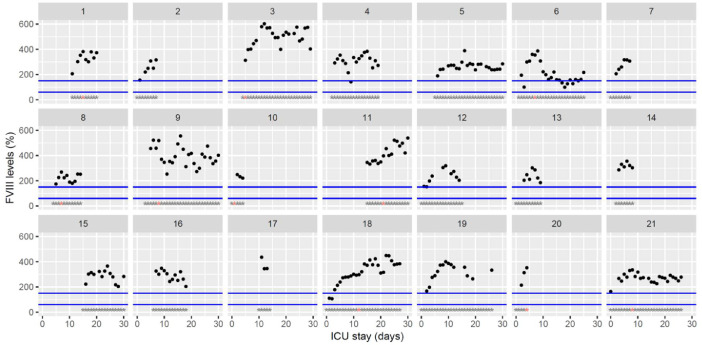
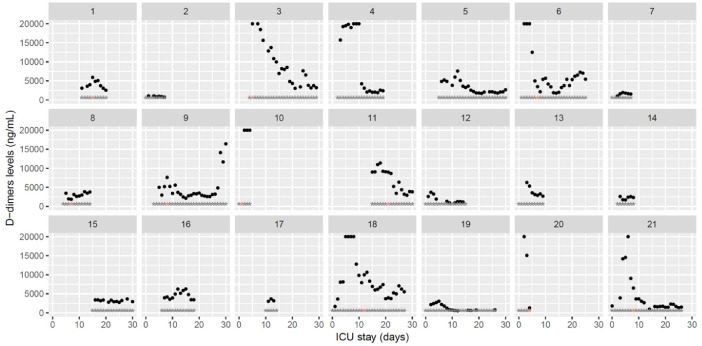
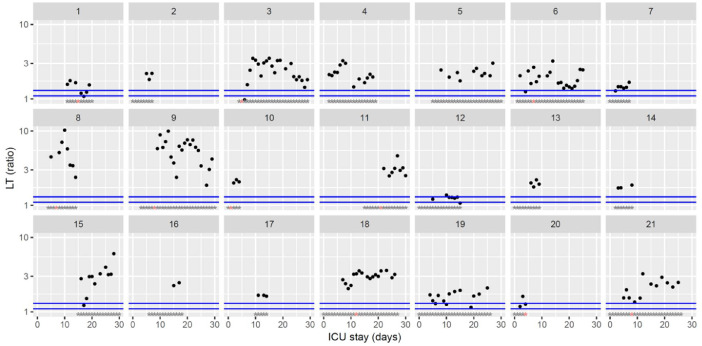
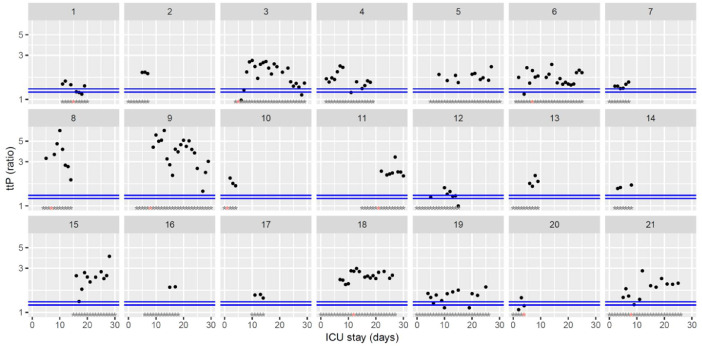
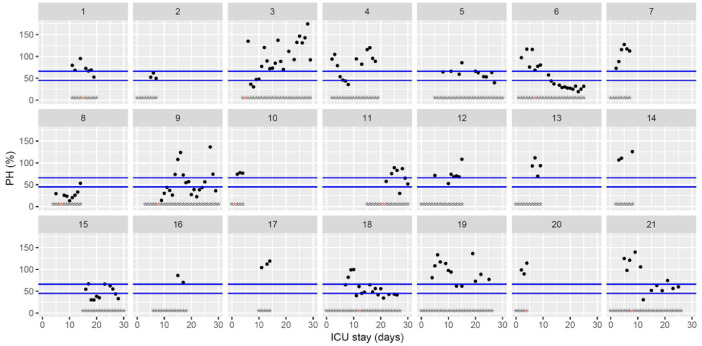
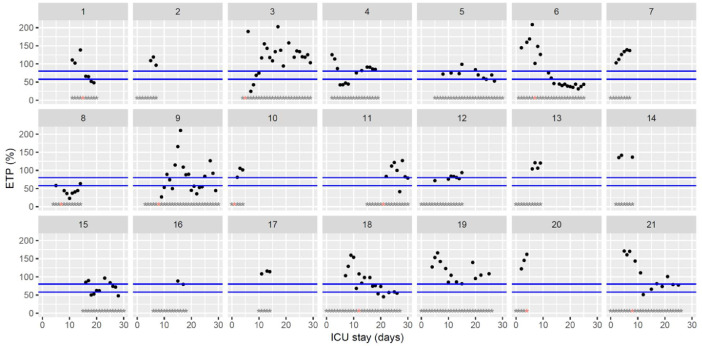
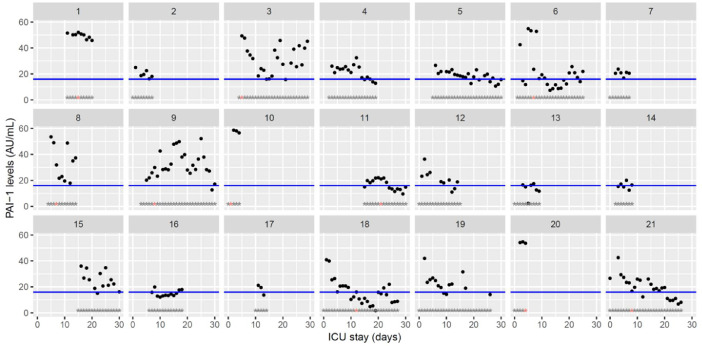
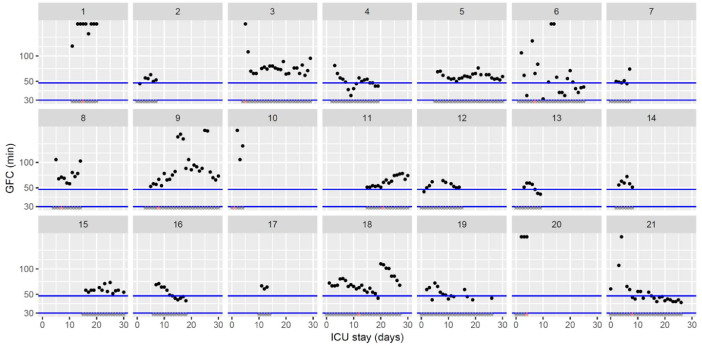
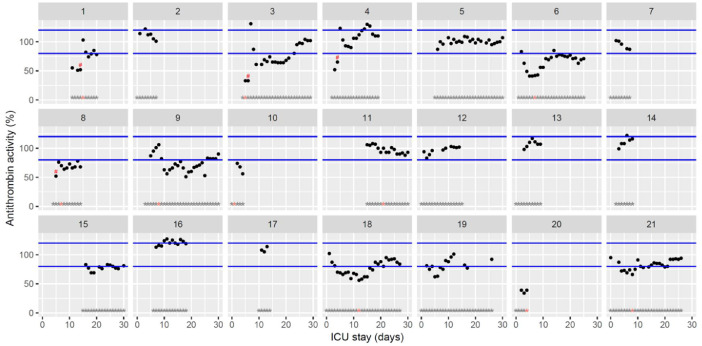
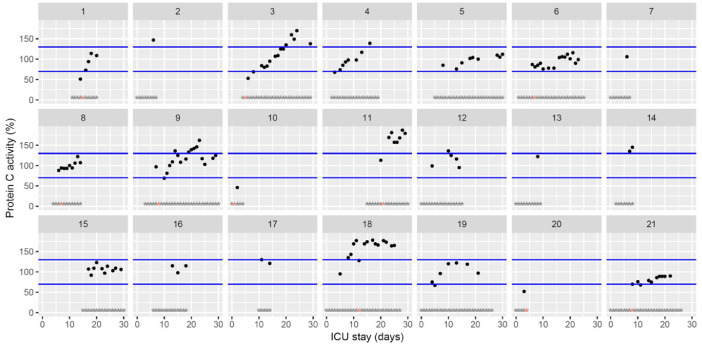
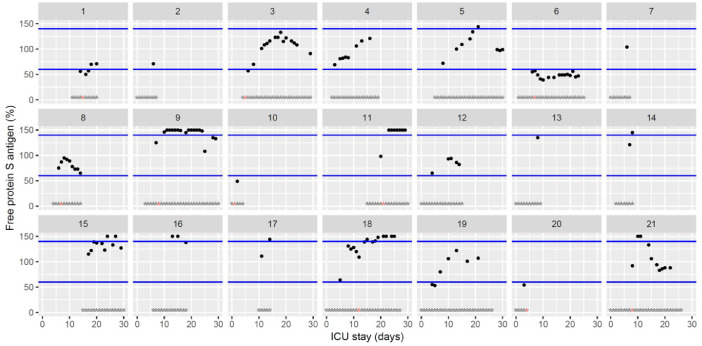
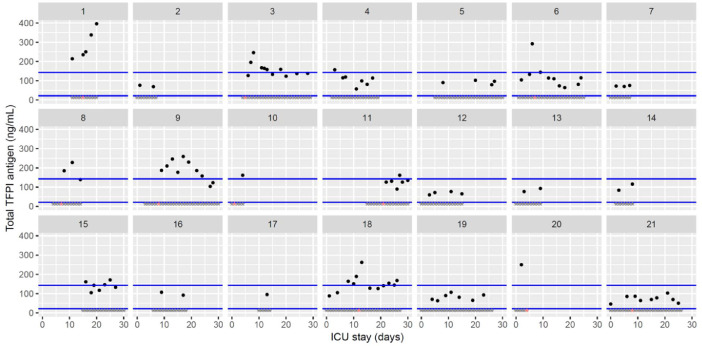
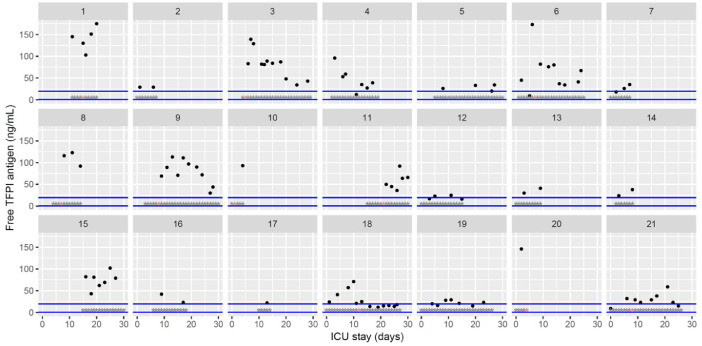
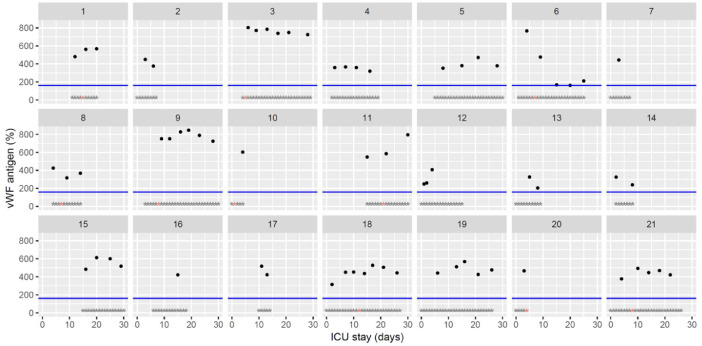
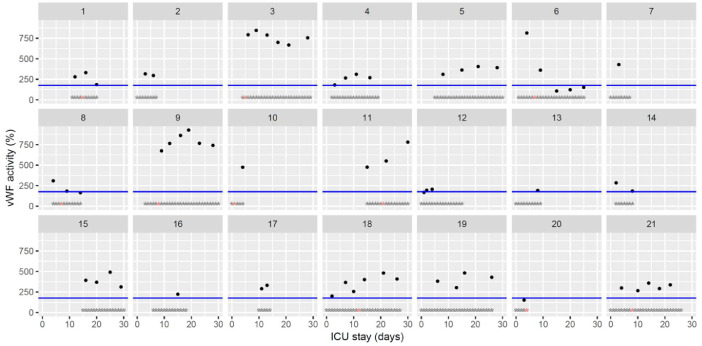
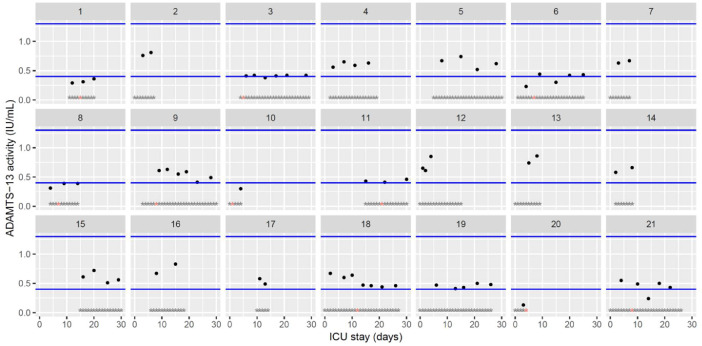
This data article accompanies the manuscript entitled: "Prothrombotic Disturbances of hemostasis of Patients with Severe COVID-19: a Prospective Longitudinal Observational Cohort Study" submitted to Thrombosis Research by the same authors. We report temporal changes of plasma levels of an extended set of laboratory parameters during the ICU stay of the 21 COVID-19 patients included in the monocentre cohort: CRP, platelet count, prothrombin time; Clauss fibrinogen and clotting factors II, V and VIII levels, D-dimers, antithrombin activity, protein C, free protein S, total and free tissue factor pathway inhibitor, PAI-1 levels, von Willebrand factor antigen and activity, ADAMTS-13 (plasma levels); and of two integrative tests of coagulation (thrombin generation with ST Genesia) and fibrinolysis (global fibrinolytic capacity - GFC). Regarding hemostasis, we used double-centrifuged frozen citrated plasma prospectively collected after daily performance of usual coagulation tests. Demographic and clinical characteristics of patients and thrombotic and hemorrhagic complications were also collected from patient's electronic medical reports.

Keywords: COVID-19; D-dimers; Fibrinolysis; Hemostasis plasma proteins; Intensive care unit; Thrombin generation; Thrombosis.


Conflict of interest statement

The authors declare that they have no known competing financial interests or personal relationships that have or could be perceived to have influenced the work reported in this article.

Figures

Fig. 1:
Fig. 1
Temporal changes in C-reactive protein plasma levels during Namur ICU stay for the 21 patients. Each point represents the result of the test of the day. The blue line represents the reference range according to the manufacturer (5 mg/dL). Grey stars represent the inclusion period and orange stars the day of thrombosis diagnosis.(For interpretation of the references to color in this figure legend, the reader is referred to the web version of this article.)
Fig. 2:
Fig. 2
Temporal changes in platelet count during Namur ICU stay for the 21 patients. Each point represents the result of the test of the day. Blue lines represent the reference range (150–450 × 109/L). Grey stars represent the inclusion period and orange stars the day of thrombosis diagnosis.(For interpretation of the references to color in this figure legend, the reader is referred to the web version of this article.)
Fig. 3:
Fig. 3
Temporal changes in prothrombin time (expressed as percentage activity) during Namur ICU stay for the 21 patients. Each point represents the result of the test of the day. Blue lines represent the reference range locally determined (75–100%). Grey stars represent the inclusion period and orange stars the day of thrombosis diagnosis.(For interpretation of the references to color in this figure legend, the reader is referred to the web version of this article.)
Fig. 4:
Fig. 4
Temporal changes in Clauss fibrinogen during Namur ICU stay for the 21 patients. Each point represents the result of the test of the day. Blue lines represent the reference range according to the manufacturer (200–400 mg/dL). Grey stars represent the inclusion period and orange stars the day of thrombosis diagnosis.(For interpretation of the references to color in this figure legend, the reader is referred to the web version of this article.)
Fig. 5:
Fig. 5
Temporal changes in clotting factor II levels during Namur ICU stay for the 21 patients. Each point represents the result of the test of the day. Blue lines represent the reference range according to the manufacturer (70–120%). Grey stars represent the inclusion period and orange stars the day of thrombosis diagnosis.(For interpretation of the references to color in this figure legend, the reader is referred to the web version of this article.)
Fig. 6:
Fig. 6
Temporal changes in clotting factor V levels during Namur ICU stay for the 21 patients. Each point represents the result of the test of the day. Blue lines represent the reference range according to the manufacturer (70–120%). Grey stars represent the inclusion period and orange stars the day of thrombosis diagnosis.(For interpretation of the references to color in this figure legend, the reader is referred to the web version of this article.)
Fig. 7:
Fig. 7
Temporal changes in clotting factor VIII levels during Namur ICU stay for the 21 patients. Each point represents the result of the test of the day. Blue lines represent the reference range according to the manufacturer (60–150%). Grey stars represent the inclusion period and orange stars the day of thrombosis diagnosis.(For interpretation of the references to color in this figure legend, the reader is referred to the web version of this article.)
Fig. 8:
Fig. 8
Temporal changes in D-dimers plasma levels during Namur ICU stay for the 21 patients. Each point represents the result of the test of the day. Grey stars represent the inclusion period and orange stars the day of thrombosis diagnosis.(For interpretation of the references to color in this figure legend, the reader is referred to the web version of this article.)
Fig. 9:
Fig. 9
Temporal changes in thrombin generation (ST Genesia with ThromboScreen reagent) lag time (LT) normalized using a reference plasma (provided with ThromboScreen reagent) during Namur ICU stay for the 21 patients. Each point represents the result of the test of the day. Blue lines represent the reference range according to Calzavarini et al (1.1–1.3) . Grey stars represent the inclusion period and orange stars the day of thrombosis diagnosis. The ordinate is represented using a logarithmic scale.(For interpretation of the references to color in this figure legend, the reader is referred to the web version of this article.)
Fig. 10:
Fig. 10
Temporal changes in thrombin generation (ST Genesia with ThromboScreen reagent) time to peak (ttP) normalized using a reference plasma (provided with ThromboScreen reagent) during Namur ICU stay for the 21 patients. Each point represents the result of the test of the day. Blue lines represent the reference range according to Calzavarini et al. (1.2–1.3) . Grey stars represent the inclusion period and orange stars the day of thrombosis diagnosis. The ordinate is represented using a logarithmic scale.(For interpretation of the references to color in this figure legend, the reader is referred to the web version of this article.)
Fig. 11:
Fig. 11
Temporal changes in thrombin generation (ST Genesia with ThromboScreen reagent) peak height (pH) normalized using a reference plasma (provided with ThromboScreen reagent) during Namur ICU stay for the 21 patients. Each point represents the result of the test of the day. Blue lines represent the reference range according to Calzavarini et al. (45–66%) . Grey stars represent the inclusion period and orange stars the day of thrombosis diagnosis.(For interpretation of the references to color in this figure legend, the reader is referred to the web version of this article.)
Fig. 12:
Fig. 12
Temporal changes in thrombin generation (ST Genesia with ThromboScreen reagent) endogenous thrombin potential (ETP) normalized using a reference plasma (provided with ThromboScreen reagent) during Namur ICU stay for the 21 patients. Each point represents the result of the test of the day. Blue lines represent the reference range according to Calzavarini et al (59–80%) . Grey stars represent the inclusion period and orange stars the day of thrombosis diagnosis.(For interpretation of the references to color in this figure legend, the reader is referred to the web version of this article.)
Fig. 13:
Fig. 13
Temporal changes in PAI-1 activity during Namur ICU stay for the 21 patients. Each point represents the result of the test of the day. The blue line represents the reference range according to the manufacturer (<16AU/mL). Grey stars represent the inclusion period and orange stars the day of thrombosis diagnosis.(For interpretation of the references to color in this figure legend, the reader is referred to the web version of this article.)
Fig. 14:
Fig. 14
Temporal changes in global fibrinolytic capacity (GFC) measured with the Lysis Timer instrument during Namur ICU stay for the 21 patients. Each point represents the result of the test of the day. Blue lines represent the reference range locally determined (30–48 min). Grey stars represent the inclusion period and orange stars the day of thrombosis diagnosis. The ordinate is represented using a logarithmic scale.(For interpretation of the references to color in this figure legend, the reader is referred to the web version of this article.)
Fig. 15:
Fig. 15
Temporal changes in antithrombin activity during Namur ICU stay for the 21 patients. Each point represents the result of the test of the day. Blue lined represent the reference range according to the manufacturer (80–120%). Grey stars represent the inclusion period and orange stars the day of thrombosis diagnosis. Exogenous antithrombin supplementations are represented by red hashes.(For interpretation of the references to color in this figure legend, the reader is referred to the web version of this article.)
Fig. 16:
Fig. 16
Temporal changes in protein C activity during Namur ICU stay for the 21 patients. Each point represents the result of the test of the day. Blue lines represent the reference range according to the manufacturer (70–130%). Grey stars represent the inclusion period and orange stars the day of thrombosis diagnosis.(For interpretation of the references to color in this figure legend, the reader is referred to the web version of this article.)
Fig. 17:
Fig. 17
Temporal changes in free protein S levels during Namur ICU stay for the 21 patients. Each point represents the result of the test of the day. Blue lines represent the reference range according to the manufacturer (60–140%). Grey stars represent the inclusion period and orange stars the day of thrombosis diagnosis.(For interpretation of the references to color in this figure legend, the reader is referred to the web version of this article.)
Fig. 18:
Fig. 18
Temporal changes in total tissue factor pathway inhibitor (TFPI) levels during Namur ICU stay for the 21 patients. Each point represents the result of the test of the day. Blue lines represent the reference range according to the manufacturer (21.3–142.9 ng/mL). Grey stars represent the inclusion period and orange stars the day of thrombosis diagnosis.(For interpretation of the references to color in this figure legend, the reader is referred to the web version of this article.)
Fig. 19:
Fig. 19
Temporal changes in free tissue factor pathway inhibitor (TFPI) levels during Namur ICU stay for the 21 patients. Each point represents the result of the test of the day. Blue lines represent the reference range according to the manufacturer (0.4–19.6 ng/mL). Grey stars represent the inclusion period and orange stars the day of thrombosis diagnosis.(For interpretation of the references to color in this figure legend, the reader is referred to the web version of this article.)
Fig. 20:
Fig. 20
Temporal changes in von Willebrand factor (vWF) antigen levels during Namur ICU stay for the 21 patients. Each point represents the result of the test of the day. The blue line represents the reference range according to the manufacturer (< 160%). Grey stars represent the inclusion period and orange stars the day of thrombosis diagnosis.(For interpretation of the references to color in this figure legend, the reader is referred to the web version of this article.)
Fig. 21:
Fig. 21
Temporal changes in von Willebrand factor (vWF) activity (ristocetin cofactor) during Namur ICU stay for the 21 patients. Each point represents the result of the test of the day. The blue line represents the reference range according to the manufacturer (< 176%). Grey stars represent the inclusion period and orange stars the day of thrombosis diagnosis.(For interpretation of the references to color in this figure legend, the reader is referred to the web version of this article.)
Fig. 22:
Fig. 22
Temporal changes ADAMTS-13 activity during Namur ICU stay for the 21 patients. Each point represents the result of the test of the day. Blue lines represent the reference range according to the manufacturer (0.4–1.3IU/mL). Grey stars represent the inclusion period and orange stars the day of thrombosis diagnosis.(For interpretation of the references to color in this figure legend, the reader is referred to the web version of this article.)

Similar articles

Cited by

References

    1. M. Hardy, I. Michaux, S. Lessire, J. Douxfils, J.-M. Dogné, M. Bareille, G. Horlait, P. Bulpa, C. Chapelle, S. Laporte, S. Testa, H. Jacqmin, T. Lecompte, A. Dive and F. Mullier. Prothrombotic hemostasis disturbances in patients with severe COVID-19: a prospective longitudinal observational cohort study. Thromb Res. 2020; 197:20-23. - PMC - PubMed
    1. Suzuki K, Wada H, Imai H, Iba T, Thachil J, Toh CH. A re-evaluation of the D-dimer cut-off value for making a diagnosis according to the ISTH overt-DIC diagnostic criteria: communication from the SSC of the ISTH. J. Thromb. Haemost. 2018;16(7):1442–1444. - PubMed
    1. Calzavarini S, Brodard J, Quarroz C, Maire L, Nutzi R, Jankovic J. Thrombin generation measurement using the ST Genesia thrombin generation system in a cohort of healthy adults: normal values and variability. Res. Pract. Thromb. Haemost. 2019;3(4):758–768. - PMC - PubMed
    1. Susen S, Tacquard CA, Godon A, Mansour A, Garrigue D, Nguyen P. Prevention of thrombotic risk in hospitalized patients with COVID19 and hemostasis monitoring: proposals from the French working group on perioperative haemostasis (GIHP) the French Sdy group on thrombosis and haemostasis (GFHT), in collaboration with the French Society for anaesthesia and intensive care (SFAR) Crit. Care. 2020;24:364. - PubMed
    1. Kaatz S, Ahmad D, Spyropoulos AC, Schulman S. Subcommittee on control of A. Definition of clinically relevant non-major bleeding in studies of anticoagulants in atrial fibrillation and venous thromboembolic disease in non-surgical patients: communication from the SSC of the ISTH. J. Thromb. Haemost. 2015;13(11):2119–2126. - PubMed