Mitochondrial Safeguard: a stress response that offsets extreme fusion and protects respiratory function via flickering-induced Oma1 activation
- PMID: 33200421
- PMCID: PMC7737612
- DOI: 10.15252/embj.2020105074
Mitochondrial Safeguard: a stress response that offsets extreme fusion and protects respiratory function via flickering-induced Oma1 activation
Abstract
The connectivity of mitochondria is regulated by a balance between fusion and division. Many human diseases are associated with excessive mitochondrial connectivity due to impaired Drp1, a dynamin-related GTPase that mediates division. Here, we report a mitochondrial stress response, named mitochondrial safeguard, that adjusts the balance of fusion and division in response to increased mitochondrial connectivity. In cells lacking Drp1, mitochondria undergo hyperfusion. However, hyperfusion does not completely connect mitochondria because Opa1 and mitofusin 1, two other dynamin-related GTPases that mediate fusion, become proteolytically inactivated. Pharmacological and genetic experiments show that the activity of Oma1, a metalloprotease that cleaves Opa1, is regulated by short pulses of the membrane depolarization without affecting the overall membrane potential in Drp1-knockout cells. Re-activation of Opa1 and Mitofusin 1 in Drp1-knockout cells further connects mitochondria beyond hyperfusion, termed extreme fusion, leading to bioenergetic deficits. These findings reveal an unforeseen safeguard mechanism that prevents extreme fusion of mitochondria, thereby maintaining mitochondrial function when the balance is shifted to excessive connectivity.
Keywords: Drp1; Oma1; Opa1; mitochondrial fusion; mitofusin.
© 2020 The Authors.
Conflict of interest statement
The authors declare that they have no conflict of interest.
Figures

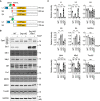
Proteolytic processing of Opa1. L1 is cleaved by both Oma1 and Yme1L, while L2 is only cleaved by Oma1.
Western blotting of WT and Drp1‐KO MEFs with or without FCCP treatment (30 min) using the indicated antibodies.
Quantification of band intensity. Values are average ± SD (n = 3). Significance was calculated using ANOVA with post hoc Tukey: **P < 0.01, ***P < 0.001.

L2 was tagged with HA at the C terminus and expressed from the doxycycline‐inducible promoter.
Western blotting of WT MEFs, Drp1‐KO MEFs, and Drp1‐KO MEFs carrying Drp1, all of which express L2‐HA, using the indicated antibodies. The expression of L2‐HA was induced for 16 h (0.1 µg/ml doxycycline). The asterisk indicates non‐specific bands of anti‐Oma1 antibodies.
Quantification of band intensity. Values are average ± SD (n = 3).
The activation of Oma1. Oma1 is proteolytically activated and then undergoes degradation.
WT and Drp1‐KO MEFs, both of which express L2‐HA, were transduced with lentiviruses carrying either scramble or Oma1‐targeted shRNAs. Whole‐cell lysates were analyzed by Western blotting using the indicated antibodies. The asterisk indicates non‐specific bands of anti‐Oma1 antibodies.
Quantification of band intensity. Values are average ± SD (n = 3).

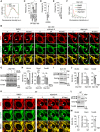
- A
The mitochondrial membrane potential was measured in WT and Drp1‐KO MEFs using a membrane potential‐dependent dye (MitoLite NIR) and flow cytometry.
- B
Drp1‐KO MEFs carrying Su9‐GFP were treated with DMSO (control) or 10 nM antimycin A or 10 ng/ml oligomycin for 1 h and viewed by laser scanning confocal microscopy for 30 min with 10‐s intervals in the presence of TMRE. The arrows indicate mitochondria that showed flickering. Three frames from the time‐lapse analysis are shown (please also see Movies [Link], [Link], [Link], [Link]). Scale bar, 10 µm.
- C–E
The percentage of cells that showed flickering in 30 min. Values are average ± SD (n = 3 experiments). In each experiment, 25–89 cells were analyzed.
- F
Drp1‐KO MEFs were treated with DMSO or 10 nM antimycin A or 10 ng/ml oligomycin or 10 µM FCCP for 1 h. The mitochondrial membrane potential was analyzed using MitoLite NIR and flow cytometry.
- G
Drp1‐KO MEFs expressing L2‐HA (induced for 16 h) were treated with 10 nM antimycin A along with 10 µM FCCP. Western blotting was performed using the indicated antibodies. The asterisk indicates non‐specific bands of anti‐Oma1 antibodies.
- H
Quantification of band intensity. Values are average ± SD (n = 3).
- I
Western blotting of Drp1‐KO MEFs with or without 10 ng/ml oligomycin treatment. The asterisk indicates non‐specific bands of anti‐Oma1 antibodies.
- J
Quantification of band intensity. Values are average ± SD (n = 3).
- K
WT MEFs carrying Su9‐GFP were treated with DMSO or 10 ng/ml oligomycin for 1 h and viewed by laser scanning confocal microscopy for 30 min with 10‐s intervals in the presence of TMRE. The arrows indicate mitochondria that showed flickering. Three frames from the time‐lapse analysis are shown (please also see Movies EV1 and EV5). Scale bar, 10 µm.
- L
WT MEFs expressing L2‐HA (induced for 16 h) were treated with 10 ng/ml oligomycin. Western blotting was performed using the indicated antibodies. The asterisk indicates non‐specific bands of anti‐Oma1 antibodies.
- M
Quantification of band intensity. Values are average ± SD (n = 3).

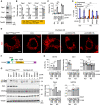
Western blotting of Drp1flox/floxOpa1flox/flox and Drp1Opa1‐KO MEFs. The asterisk indicates non‐specific bands of anti‐Oma1 antibodies.
Quantification of band intensity. Values are average ± SD (n = 3).
Drp1flox/floxOpa1flox/flox MEFs and Drp1Opa1‐KO MEFs were transduced with the indicated Opa1 constructs. The cells were observed using laser scanning confocal microscopy for 30 min with 10‐s intervals in the presence of TMRE. The percentage of cells that exhibited flickering is shown. Values are average ± SD (n = 3 experiments). In each experiment, 48–62 cells were analyzed.
Drp1flox/floxOpa1flox/flox MEFs and Drp1Opa1‐KO MEFs carrying the indicated Opa1 constructs were subjected to confocal immunofluorescence microscopy using anti‐PDH antibodies. Scale bar, 10 µm.
Quantification of mitochondrial morphology is shown (n = 3 experiments). In each experiment, 30 cells were analyzed.
L2‐HA constructs carrying a mutation (K301A or K468D) in the GTPase domain.
Western blotting of Drp1flox/floxOpa1flox/flox MEFs and Drp1Opa1‐KO MEFs, both of which carry the indicated Opa1 constructs. The asterisk indicates non‐specific bands of anti‐Oma1 antibodies.
Quantification of band intensity. Values are average ± SD (n = 3).

Experimental design for artificial flickering. WT MEFs expressing Su9‐GFP were subjected to repetitive FCCP treatments and observed using confocal microscopy in the presence of TMRE.
Three frames from the time‐lapse analysis during artificial flickering are shown. The boxed regions are magnified. Scale bar, 5 µm.
The fluorescence intensity of Su9‐GFP and TMRE in mitochondria was quantified.
Western blotting of WT MEFs after the indicated FCCP treatments. The asterisk indicates non‐specific bands of anti‐Oma1 antibodies.
Quantification of band intensity. Values are average ± SD (n = 3). Significance was calculated using ANOVA with post hoc Tukey: **P < 0.01, ***P < 0.001.

- A
Western blotting of WT MEFs and Drp1‐KO MEFs, both of which carry shRNAs (Oma1 or scramble) and/or ectopic Mfn1. The asterisk indicates non‐specific bands of anti‐Oma1 antibodies.
- B
Quantification of band intensity is shown. Values are average ± SD (n = 3).
- C–F
WT MEFs (C and E) and Drp1‐KO MEFs (D and F) were transduced with Su9‐Eos, along with Oma1 shRNAs and ectopic Mfn1. Su9‐Eos in the small region of mitochondria (indicated by the asterisks) was photoconverted using a 405‐nm laser on confocal microscope. Within 1 s after photoconversion, images were obtained for both photoconverted and unconverted Su9‐Eos signals. Images before the photoconversion were also taken to detect background signals. Scale bar, 10 µm. (E and F) To determine the connectivity of mitochondria, the area containing photoconverted Su9‐Eos signals was divided by the area containing the photoconverted and unconverted Su9‐Eos signals (total mitochondria). Values are average ± SD (n = 30 cells).
- G
The number of mitochondria was estimated by reversing the connectivity.
- H
Summary of the data.

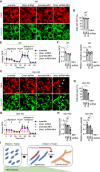
- A–D
WT (A and B) and Drp1‐KO MEFs (C and D), both of which carry shRNAs (Oma1 or scramble) and ectopic Mfn1, were stained with TMRE. The arrows indicate cells that lost the mitochondrial membrane potential in (C). Scale bar, 10 µm. (B and D) The percentage of cells that maintained the membrane potential is shown. Values are average ± SD (n = 3). 100–150 cells were analyzed in each experiment.
- E–H
OCRs were analyzed in the same set of MEFs. (F and H) Quantification of the basal OCRs and respiratory capacity is shown. Values are average ± SD (n = 3).
- I
Summary of the data.

Western blotting of livers isolated from the indicated mice at 3 months of age using the indicated antibodies.
Quantification of band intensity. Values are average ± SD (n = 3 mice for each genotype). Significance was calculated using ANOVA with post hoc Tukey: *P < 0.05, **P < 0.01, ***P < 0.001.
Comment in
-
The last wall of defense to prevent extreme and deleterious mitochondrial fusion.EMBO J. 2020 Dec 15;39(24):e107326. doi: 10.15252/embj.2020107326. Epub 2020 Dec 9. EMBO J. 2020. PMID: 33295661 Free PMC article.
Similar articles
-
OMA1-Mediated Mitochondrial Dynamics Balance Organellar Homeostasis Upstream of Cellular Stress Responses.Int J Mol Sci. 2024 Apr 22;25(8):4566. doi: 10.3390/ijms25084566. Int J Mol Sci. 2024. PMID: 38674151 Free PMC article. Review.
-
The i-AAA protease YME1L and OMA1 cleave OPA1 to balance mitochondrial fusion and fission.J Cell Biol. 2014 Mar 17;204(6):919-29. doi: 10.1083/jcb.201308006. Epub 2014 Mar 10. J Cell Biol. 2014. PMID: 24616225 Free PMC article.
-
A threshold of transmembrane potential is required for mitochondrial dynamic balance mediated by DRP1 and OMA1.Cell Mol Life Sci. 2017 Apr;74(7):1347-1363. doi: 10.1007/s00018-016-2421-9. Epub 2016 Nov 17. Cell Mol Life Sci. 2017. PMID: 27858084 Free PMC article.
-
Mitochondrial membrane potential and oxidative stress interact to regulate Oma1-dependent processing of Opa1 and mitochondrial dynamics.FASEB J. 2024 Sep 30;38(18):e70066. doi: 10.1096/fj.202400313R. FASEB J. 2024. PMID: 39312414
-
Biosynthesis and roles of phospholipids in mitochondrial fusion, division and mitophagy.Cell Mol Life Sci. 2014 Oct;71(19):3767-78. doi: 10.1007/s00018-014-1648-6. Epub 2014 May 28. Cell Mol Life Sci. 2014. PMID: 24866973 Free PMC article. Review.
Cited by
-
The last wall of defense to prevent extreme and deleterious mitochondrial fusion.EMBO J. 2020 Dec 15;39(24):e107326. doi: 10.15252/embj.2020107326. Epub 2020 Dec 9. EMBO J. 2020. PMID: 33295661 Free PMC article.
-
OMA1-Mediated Mitochondrial Dynamics Balance Organellar Homeostasis Upstream of Cellular Stress Responses.Int J Mol Sci. 2024 Apr 22;25(8):4566. doi: 10.3390/ijms25084566. Int J Mol Sci. 2024. PMID: 38674151 Free PMC article. Review.
-
Molecular Determinants of Mitochondrial Shape and Function and Their Role in Glaucoma.Antioxid Redox Signal. 2023 May;38(13-15):896-919. doi: 10.1089/ars.2022.0124. Epub 2023 Jan 5. Antioxid Redox Signal. 2023. PMID: 36301938 Free PMC article. Review.
-
Maternal Metformin Treatment during Gestation and Lactation Improves Skeletal Muscle Development in Offspring of Rat Dams Fed High-Fat Diet.Nutrients. 2021 Sep 28;13(10):3417. doi: 10.3390/nu13103417. Nutrients. 2021. PMID: 34684418 Free PMC article.
-
Copper Chelation Induces Morphology Change in Mitochondria of Triple-Negative Breast Cancer.JACS Au. 2025 Apr 25;5(5):2102-2113. doi: 10.1021/jacsau.5c00035. eCollection 2025 May 26. JACS Au. 2025. PMID: 40443881 Free PMC article.
References
-
- Acin‐Perez R, Lechuga‐Vieco AV, Del Mar MM, Nieto‐Arellano R, Torroja C, Sanchez‐Cabo F, Jimenez C, Gonzalez‐Guerra A, Carrascoso I, Beninca C et al (2018) Ablation of the stress protease OMA1 protects against heart failure in mice. Sci Transl Med 10: eaan4935 - PubMed
Publication types
MeSH terms
Substances
Grants and funding
LinkOut - more resources
Full Text Sources
Molecular Biology Databases
Miscellaneous

