

Mutations in GRK2 cause Jeune syndrome by impairing Hedgehog and canonical Wnt signaling
- PMID: 33200460
- PMCID: PMC7645380
- DOI: 10.15252/emmm.201911739
Mutations in GRK2 cause Jeune syndrome by impairing Hedgehog and canonical Wnt signaling
Abstract
Mutations in genes affecting primary cilia cause ciliopathies, a diverse group of disorders often affecting skeletal development. This includes Jeune syndrome or asphyxiating thoracic dystrophy (ATD), an autosomal recessive skeletal disorder. Unraveling the responsible molecular pathology helps illuminate mechanisms responsible for functional primary cilia. We identified two families with ATD caused by loss-of-function mutations in the gene encoding adrenergic receptor kinase 1 (ADRBK1 or GRK2). GRK2 cells from an affected individual homozygous for the p.R158* mutation resulted in loss of GRK2, and disrupted chondrocyte growth and differentiation in the cartilage growth plate. GRK2 null cells displayed normal cilia morphology, yet loss of GRK2 compromised cilia-based signaling of Hedgehog (Hh) pathway. Canonical Wnt signaling was also impaired, manifested as a failure to respond to Wnt ligand due to impaired phosphorylation of the Wnt co-receptor LRP6. We have identified GRK2 as an essential regulator of skeletogenesis and demonstrate how both Hh and Wnt signaling mechanistically contribute to skeletal ciliopathies.
Keywords: GRK2; Wnt; asphyxiating thoracic dystrophy; hedgehog; smoothened.
© 2020 The Authors. Published under the terms of the CC BY 4.0 license.
Conflict of interest statement
The authors declare that they have no conflict of interest.
Figures
- A
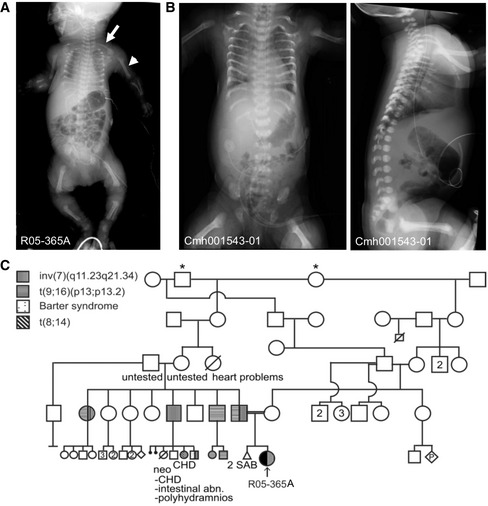
AP radiograph demonstrates characteristic findings of ATD in the R05‐365A proband. Note the shortened humeri (closed arrowhead) and elongated clavicles (arrow).
- B
Radiographs of the Cmh001543‐01 proband showing similar findings.
- C
Family R05‐365A pedigree; * indicates common ancestors. CHD, congenital heart disease, SAB, spontaneous abortion. Abn, abnormalities.
- A
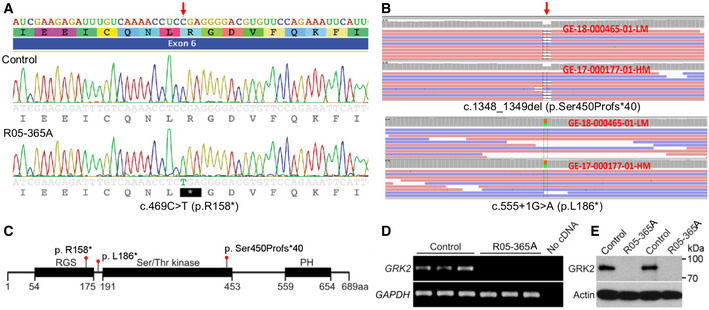
Sanger sequence trace showing homozygosity for the c.469C>T mutation, predicting a stop codon in exon 6 of GRK2 (arrow).
- B
Exome analysis showing the biallelic changes c. 1348_1349del and c.555 +1G>A. Red arrow points to the place of mutation. Orange and green boxes indicate the reference nucleotide and its substitution, respectively.
- C
Domain composition of GRK2 and the corresponding location of the mutations (RGS, regulator of G protein signaling domain; PH, pleckstrin homology domain).
- D
Expression of GRK2 as measured by RT–PCR in three replicates each of control and R05‐365A fibroblasts, demonstrating absence of GRK2 transcript in ATD cells. GAPDH served as a positive control.
- E
Two control and ATD fibroblast samples were immunoblotted for GRK2. Note the absence of GRK2 protein in the ATD cells. Actin served as a loading control. The data shown are representative of three independent experiments.
- A
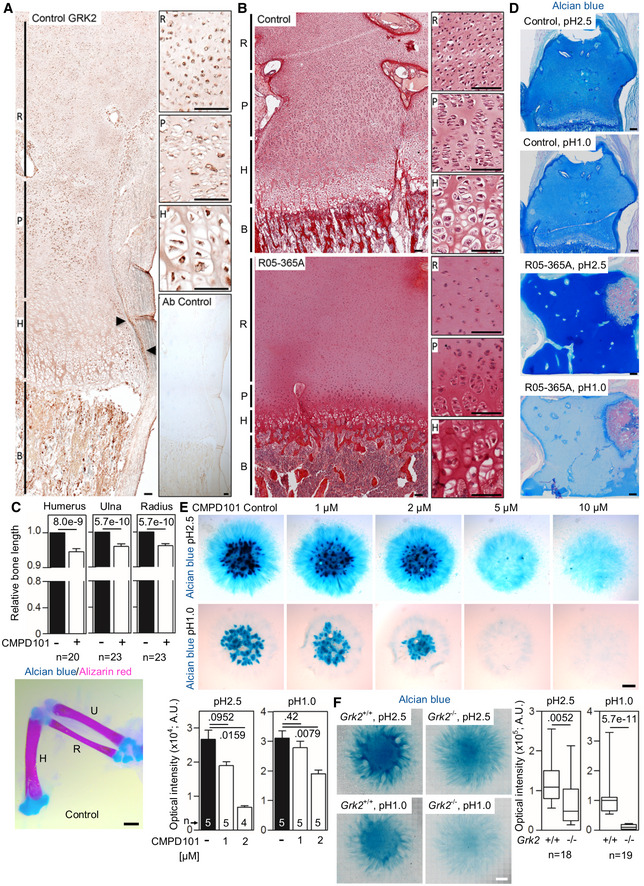
GRK2 immunohistochemistry in a control 17‐week gestational age distal femur growth plate demonstrating widespread expression, particularly in the bone (B), proliferating zone of the growth plate (P), and the perichondrium (arrowheads). Non‐reactive antibody was used as a control (Ab control). R, reserve zone. H, hypertrophic zone. Scale bars, 100 μm.
- B
Picrosirius red staining of the femoral growth plates of a control and the ATD R05‐365A fetus. The control growth plate shows normal architecture with clearly distinguishable reserve (R), proliferating (P) and hypertrophic (H) zones. A profound disruption of growth plate architecture is obvious in the GRK2 −/− growth plate, which shows irregularly shaped reserve zone chondrocytes, a lack of discernable proliferating chondrocytes, and a significantly under‐developed hypertrophic zone. Scale bars, 100 μm.
- C
Shortened long bones in the chicken wings injected with CMPD101. The right limb bud was injected with CMPD101, and the left one was left as a control. Note the shortened humerus (H), ulna (U), and radius (R) in the CMPD101‐injected wing. Mean ± SEM. Mann–Whitney U‐test; number of animals is indicated. Scale bar, 150 μm.
- D
Alcian blue staining of the femoral growth plates of a control and the ATD R05‐365A fetus. Note the significantly lesser blue staining of the R05‐365A growth plate stained by alcian blue pH 1.0, suggesting impaired sulfation of the extracellular matrix. Scale bars, 200 μm.
- E
Alcian blue staining of the chicken limb bud micromasses treated with CMPD101. Note the gradual inhibition of the cartilage nodules with increasing concentration of CMPD101, quantified below. Mean ± SEM. Mann–Whitney U‐test; number of micromasses is indicated. A representative experiment of four (pH 2.5) and three (pH 1.0) is shown. Scale bar, 100 μm.
- F
Alcian blue staining of the micromasses generated from Grk2 +/+ and Grk2 −/− NIH3T3 cells. Note the mildly weaker staining by alcian blue pH 2.5 and the nearly absent sulfation stained by alcian blue pH 1.0 in the Grk2 −/− micromasses. Central band, median. Box, 1st‐3rd quartile. Whiskers, 10%‐90% percentile. Mann–Whitney U‐test; number of micromasses is indicated. Scale bar, 1 mm.
- A–C
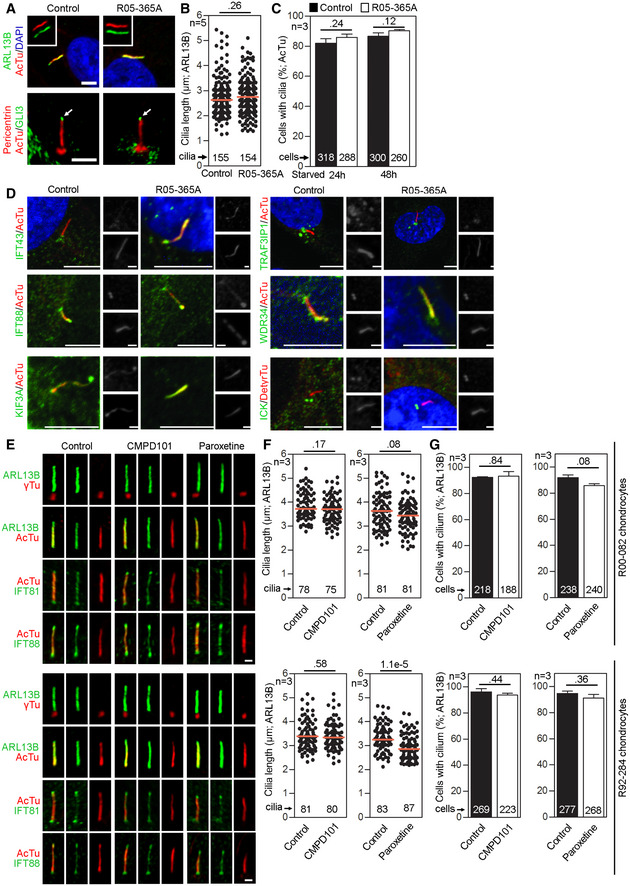
Primary cilia are normal in GRK2 −/− fibroblasts. Cells were serum starved for 24 or 48 h to induce cilia, and (A) immunostained for acetylated tubulin (AcTu, red), ARL13B (green) (upper panel; insets show the individual signals), or AcTu (red), pericentrin (red) and GLI3 (green) (lower panel). Control and GRK2 −/− cilia were positive for AcTu and ARL13B, and showed similar localization of GLI3 to the tips (lower panel, arrows). Acetylated tubulin and pericentrin staining were used to visualize the axoneme and centrioles, respectively. Scale bar, 2 μm. (B) Length distribution of cilia did not differ between control and GRK2 −/− cells. Red bars show medians; dots represent individual cilia. Mann–Whitney U test; number of biological experiments and the total numbers of analyzed cilia are indicated. (C) There was no difference in the efficiency of ciliogenesis between control and GRK2 −/− cells. Mean ± SEM. Welch's t‐test; number of biological experiments and the total numbers of analyzed cells are indicated.
- D
Loss of GRK2 did not affect localization of ciliary and IFT components. Immunofluorescence of serum‐starved (48 hr) control and GRK2 −/− fibroblasts immunostained with AcTu or detyrosinated tubulin (DetyrTu) to mark the cilium (red), and IFT43, IFT88, KIF3A, TRAF3IP1, WDR34, or ICK (green). No significant differences in staining were found between control and GRK2 −/− cilia, suggesting normal IFT. Scale bars, 5 μm and 1 μm (insets).
- E–G
Inhibition of GRK2 activity did not affect primary cilia in chondrocytes. (E) Control human R92‐284 and R00‐082 chondrocytes were serum starved in the presence of a GRK2 inhibitor, either 20 μM CMPD101 or 10 μM paroxetine, for 24 h before they were fixed and immunostained for cilia (ARL13B; gamma tubulin, γTu; acetylated tubulin, AcTu) and the retrograde IFT‐B proteins IFT81 or IFT88. Scale bar, 1 μm. (F) Cilia length was measured using the ARL13B signal. Red bar, median. Mann–Whitney U‐test; number of biological experiments and total cilia numbers are indicated. (G) The percentage of ciliated cells was calculated. Mean ± SEM. Welch's t‐test; number of biological experiments and total cell numbers are indicated.
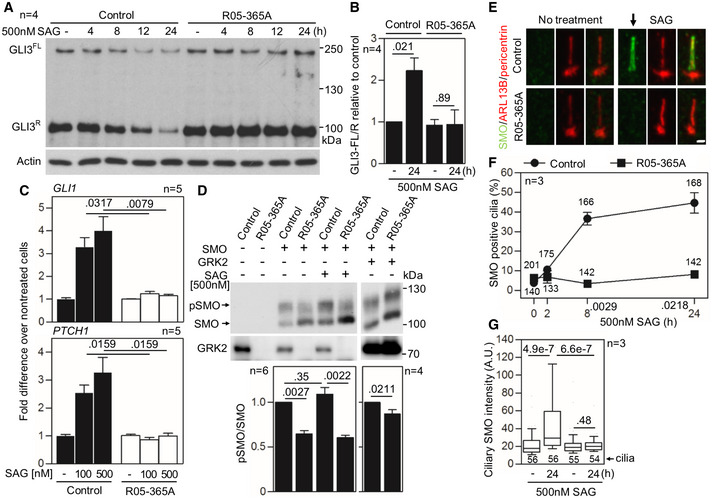
- A, B
Defective GLI3 processing in GRK2 −/− fibroblasts. Cells were serum starved to induce cilia before treatment with the Hh pathway activator SAG (Smoothened agonist), and the whole cell lysates were immunoblotted for GLI3. Note the SAG‐mediated downregulation of both full‐length (FL) and repressor (R) GLI3 in control fibroblasts, demonstrating normal processing. There was no effect of SAG on GLI3 processing in GRK2 −/− cells. A representative experiment of four is shown. (B) Quantitation of the GLI3FL to GLI3R ratio using densitometry. Mean ± SEM. Mann–Whitney U test; number of biological replicates is indicated.
- C
Defective SAG response in GRK2 −/− fibroblasts. Cells were treated with SAG for 24 h. Transcript levels of GLI3 targets GLI1 and PTCH1 were determined by qRT–PCR; GAPDH was used for normalization. Note the SAG‐mediated induction of GLI1 and PTCH1 expression in controls but not in GRK2 −/− cells. Mean ± SEM. Mann–Whitney U‐test; number of biological replicates is indicated.
- D
Under‐phosphorylation of Smoothened (SMO) in GRK2 −/− fibroblasts. Lysates of SMO‐transfected cells were resolved by the phospho(p)‐shift PAGE and immunoblotted for SMO. The portion of pSMO analyzed by densitometry is shown. GRK2 add‐back demonstrates a rescue of the pSMO in GRK2 −/− fibroblasts. Mean ± SEM. Mann–Whitney U‐test; number of biological replicates is indicated.
- E–G
Defective SMO accumulation in cilia of GRK2 −/− fibroblasts. Cells were treated with SAG and immunostained for SMO, ARL13B, and pericentrin. Note the failure in SMO accumulation in cilia of GRK2 −/− cells (arrow). Scale bar, 2 μm (E). The percentage of SMO‐positive cilia was calculated and plotted. Mean ± SEM. Welch's t‐test; number of biological experiments and the total numbers of analyzed cilia are indicated (F). The intensity of ciliary SMO was analyzed and plotted. Central band, median. Box, 1st‐3rd quartile. Whiskers, 10%‐90% percentile. Mann–Whitney U‐test; number of biological experiments and the total numbers of analyzed cilia are indicated (G).
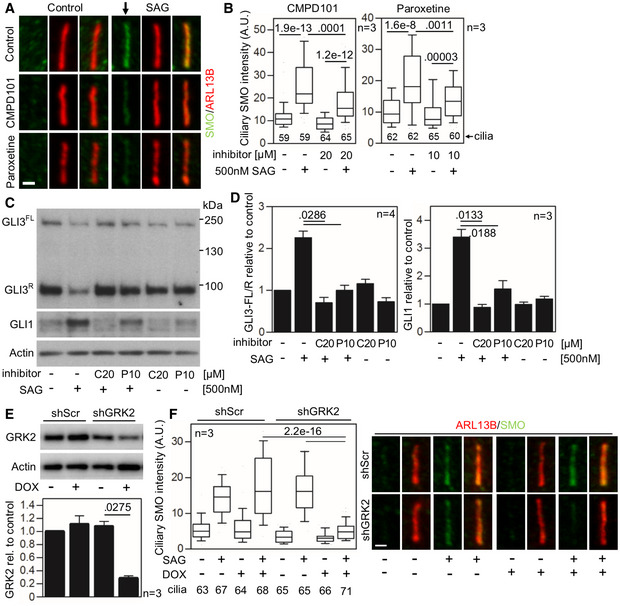
- A–D
Defective SMO cilia accumulation and inhibited Hh signaling in chondrocytes treated with GRK2 inhibitors. Control human R00‐082 chondrocytes were serum starved in the presence of a GRK2 inhibitor, either CMPD101 (C) or paroxetine (P), for 24 h before they were treated with SAG for additional 12 (A, B) or 24 h (C, D). (A,B) Cilia were stained by ARL13B and SMO antibodies, and the intensity of ciliary SMO was analyzed and plotted. Note the impaired SMO accumulation in cilia caused by GRK2 inhibition (black arrow). Central band, median. Box, 1st‐3rd quartile. Whiskers, 10%‐90% percentile. Mann–Whitney U test; number of biological experiments and the total numbers of analyzed cilia are indicated. Scale bar, 1 μm. (C) Cell lysates were immunoblotted for GLI3 processing and GLI1 upregulation; actin levels served as a loading control. GLI3FL and GLI3R, full‐length, and repressor GLI3 variants, respectively. (D) Quantification of GLI3 and GLI1 levels by densitometry. Note the impaired GLI3 processing and no GLI1 upregulation in cells treated with CMPD101 or paroxetine. Mean ± SEM. Mann–Whitney U‐test (GLI3 ratio) and Welch's t‐test (GLI1 levels); number of biological experiments is indicated.
- E, F
Defective SMO cilia accumulation in chondrocytes with downregulated GRK2. (E) Doxycycline (DOX)‐inducible GRK2 downregulation in control human R00‐082 chondrocytes, tested by Western blot, normalized to actin, and plotted below. Mean ± SEM. Welch's t‐test; number of biological experiments is indicated. shScr, scramble shRNA. (F) Cells pre‐treated with DOX for three days were serum starved, SAG treated, stained, and analyzed as in (A,B), and the intensity of ciliary SMO was analyzed and plotted. Note the impaired SMO accumulation in cilia caused by GRK2 loss. Central band, median. Box, 1st‐3rd quartile. Whiskers, 10%‐90% percentile. Mann–Whitney U test; number of biological experiments and the total numbers of analyzed cilia are indicated. Scale bar, 1 μm.
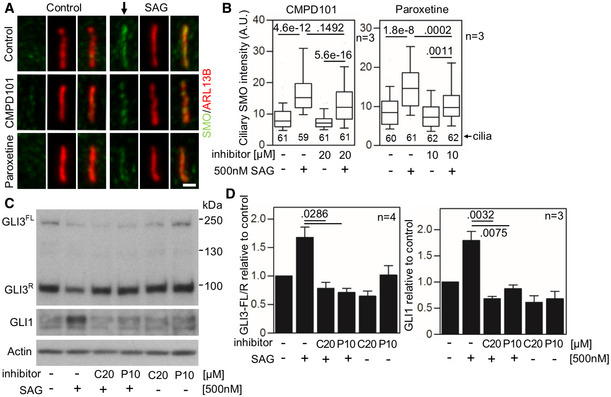
- A–D
Defective SMO cilia accumulation and inhibited Hh signaling in chondrocytes treated with GRK2 inhibitors. Control human R92‐284 chondrocytes were serum starved in the presence of a GRK2 inhibitor, either CMPD101 (C) or paroxetine (P), for 24 h before they were treated with SAG for additional 12 (A, B) or 24 h (C, D). (A, B) Cilia were stained by ARL13B and SMO antibodies, and the intensity of ciliary SMO was analyzed and plotted. Note the impaired SMO accumulation in cilia caused by GRK2 inhibition (black arrow). Central band, median. Box, 1st–3rd quartile. Whiskers, 10%–90% percentile. Mann–Whitney U‐test; number of biological experiments and the total numbers of analyzed cilia are indicated. Scale bar, 1 μm. (C) Cell lysates were immunoblotted for GLI3 processing and GLI1 upregulation; actin levels served as a loading control. GLI3FL and GLI3R, full‐length and repressor GLI3 variants, respectively. (D) Quantification of GLI3 and GLI1 levels by densitometry. Note the impaired GLI3 processing and no GLI1 upregulation in cells treated with CMPD101 or paroxetine. Mean ± SEM. Mann–Whitney U‐test (GLI3 ratio) and Welch's t‐test (GLI1 levels); number of biological experiments is indicated.
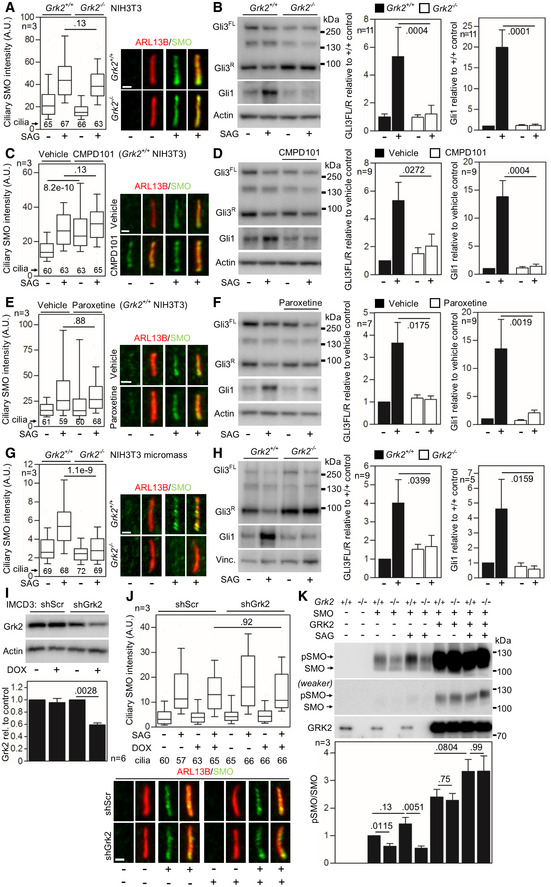
- A
Serum‐starved Grk2 +/+ and Grk2 −/− NIH3T3 cells were treated with 500 nM SAG for 4 h; the cells were immunostained for ARL13B and SMO, and the intensity of ciliary SMO was analyzed and plotted. Note the normal ciliary SMO intensity in Grk2 −/− cells. Central band, median. Box, 1st–3rd quartile. Whiskers, 10–90% percentile. Mann–Whitney U test; number of biological experiments and the total numbers of analyzed cilia are indicated. Scale bars, 1 μm.
- B
Serum‐starved Grk2 +/+ and Grk2 −/− NIH3T3 cells were treated with 500 nM SAG for 10–16 h, and immunoblotted for Gli3 and Gli1. The optical density of the bands was normalized to that of actin, and the Gli3‐FL/R ratios and Gli1 protein levels were plotted. Mean ± SEM. Mann–Whitney U‐test; number of biological experiments is indicated. Gli3FL and Gli3R, full‐length and repressor GLI3 variants, respectively.
- C–F
Grk2 +/+ NIH3T3 cells were serum starved together with 25 μM CMPD101 (C, D) or 1 μM paroxetine (E, F) for 12 h, and treated with 500 nM SAG for 4 hours (C, E) or 12 h (D, F). (C, E) Inhibition of Grk2 activity by neither CMPD101 nor paroxetine prevents the SAG‐induced ciliary SMO accumulation. Central band, median. Box, 1st–3rd quartile. Whiskers, 10%–90% percentile. Mann–Whitney U test; number of biological experiments and the total numbers of analyzed cilia are indicated. Scale bars, 1 μm. (D, F) CMPD101 and paroxetine inhibit SAG‐mediated Gli3 processing and Gli1 upregulation. Mean ± SEM. Mann–Whitney U test; number of biological experiments is indicated.
- G, H
Micromasses derived from Grk2 +/+ and Grk2 −/− NIH3T3 cells were serum starved, treated, and analyzed as in (C–F). (G) Note the inhibition of ciliary SMO intensity in Grk2 −/− micromasses. Central band, median. Box, 1st–3rd quartile. Whiskers, 10%–90% percentile. Mann–Whitney U‐test; number of biological experiments and the total numbers of analyzed cilia are indicated. Scale bars, 1 μm. (H) Western blots for Gli3 processing and Gli1 upregulation. Mean ± SEM. Mann–Whitney U‐test; number of biological experiments is indicated. Vinc., vinculin.
- I, J
Normal SMO cilia accumulation in murine IMCD3 cells with downregulated Grk2. (I) Doxycycline (DOX)‐inducible Grk2 downregulation, tested by Western blot, normalized to actin and plotted below. Mean ± SEM. Mann–Whitney U‐test; number of biological experiments is indicated. shScr, scramble shRNA. (J) Cells pre‐treated with DOX for 3 days were serum starved, SAG treated, stained, and analyzed as in (A), and the intensity of ciliary SMO was analyzed and plotted. Note the normal SMO accumulation in cilia in cells with Grk2 downregulation. Central band, median. Box, 1st–3rd quartile. Whiskers, 10%–90% percentile. Mann–Whitney – test; number of biological experiments and the total numbers of analyzed cilia are indicated. Scale bar, 1 μm.
- K
Under‐phosphorylation of SMO in Grk2 −/− NIH3T3 cells. Lysates of SMO‐transfected cells were resolved by the phospho(p)‐shift PAGE and immunoblotted for SMO. The portion of pSMO analyzed by densitometry is shown. GRK2 add‐back demonstrates a rescue of the pSMO in Grk2 −/− cells. Mean ± SEM. Welch's t‐test; number of biological replicates is indicated.
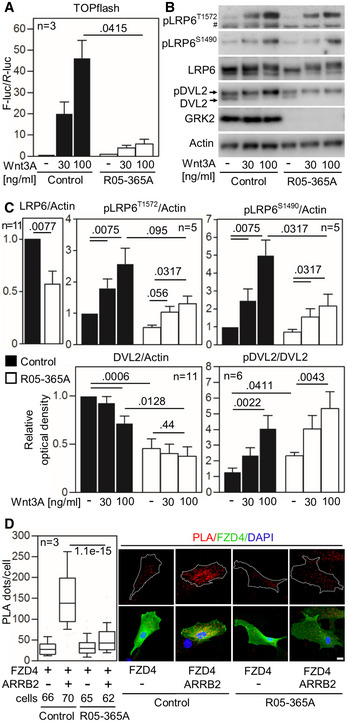
- A
Control and GRK2 −/− fibroblasts were transfected with the TOPflash Firefly (F) luciferase vector together with a control Renilla (R) luciferase vector, and the effect of Wnt3A on TOPflash transcriptional activation was determined by dual‐luciferase assay. Note the impaired response to Wnt3A in GRK2 −/− cells. Mean ± SEM. Welch′s t‐test; number of biological experiments is indicated.
- B, C
Low phosphorylation (p) of Wnt3A co‐receptor LRP6 as determined by Western blot with pS1490‐ and pT1572‐LRP6 specific antibodies, reduced LRP6 and DVL2 expression, and increased steady state phosphorylation of DVL2. A representative experiment of four is shown. #, nonspecific band. (C) Densitometry of Western blot results demonstrating decreased levels of LRP6 in GRK2 −/− cells, lower response of GRK2 −/− cells to Wnt3A by LRP6 phosphorylation at S1490, and tendency toward the similar defect at T1572. Densitometry also showed less of total DVL2 levels, and increased steady state pDVL2 in GRK2 −/− cells. Mean ± SEM. Mann–Whitney U‐test; number of biological experiments is indicated.
- D
Loss of interaction between Frizzled 4 (FZD4) and ß‐Arrestin 2 (ARRB2) in GRK2 −/− fibroblasts. Proximity ligation assay (PLA) between expressed FZD4‐GFP and ARRB2‐Flag showed significantly reduced proximity events between the two proteins in GRK2 −/− cells. White dashed lines outline the transfected cells. Central band, median. Box, 1st–3rd quartile. Whiskers, 10–90% percentile. Mann–Whitney U‐test; number of biological experiments and the total numbers of analyzed cells are indicated. Scale bar, 10 μm.
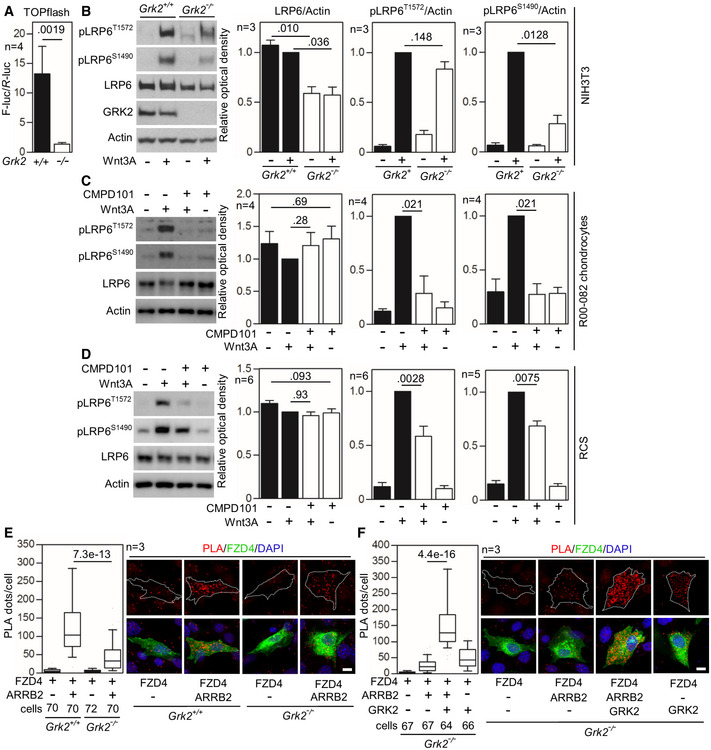
- A
Control (+/+) and Grk2 −/− NIH3T3 cells were transfected with the TOPflash Firefly (F) luciferase vector together with a control Renilla (R) luciferase vector, treated with Wnt3A (100 ng/ml) for 24 h and subjected to dual‐luciferase assay. Note the impaired response to Wnt3A in Grk2 −/− cells. Mean ± SEM. Mann–Whitney U test; number of biological experiments is indicated.
- B
Control (+/+) and Grk2 −/− NIH3T3 cells were treated with 40 ng/ml Wnt3A for 1 h. Note the lower LRP6 expression and inhibited Wnt3A‐induced LRP6 phosphorylation in the Grk2 −/− NIH3T3 cells. Mean ± SEM. Welch's t‐test; number of biological experiments is indicated.
- C, D
Loss of LRP6 phosphorylation in chondrocytes treated with the GRK2 inhibitor CMPD101. Control human R00‐082 chondrocytes (C) and rat chondrosarcoma (RCS) cells (D) were treated with 20 μM CMPD101 overnight and then treated with 100 ng/ml Wnt3A for 1 h. Note the less LRP6 phosphorylation (pS1490‐ and pT1572‐LRP6) in cells treated with CMPD101. Mean ± SEM. Mann–Whitney U test; number of biological experiments is indicated.
- E, F
Loss of interaction between Frizzled 4 (FZD4) and ß‐Arrestin 2 (ARRB2) in Grk2 −/− NIH3T3 cells. (E) Proximity ligation assay (PLA) between expressed FZD4‐GFP and ARRB2‐Flag showed significantly reduced proximity events between the two proteins in Grk2 −/− cells. (F) GRK2 add‐back rescued the interaction. White dashed lines outline the transfected cells. Central band, median. Box, 1st–3rd quartile. Whiskers, 10–90% percentile. Mann–Whitney U test; number of biological experiments and the total numbers of analyzed cells are indicated. Scale bars, 10 μm.
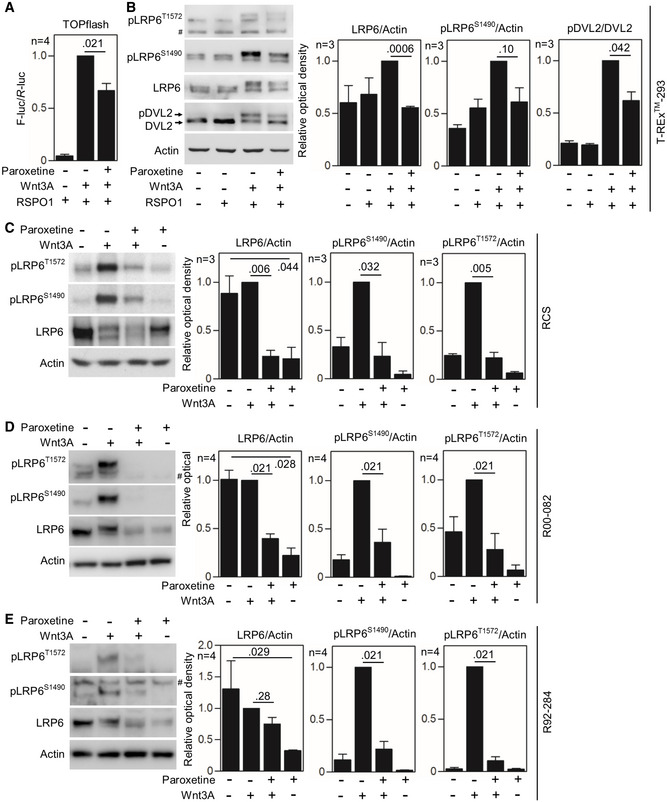
- A
T‐REx™‐293 cells were transfected with the TOPflash Firefly (F) luciferase vector together with a control Renilla (R) luciferase vector, and the effect of Wnt3A on TOPflash transcriptional activation was determined by dual‐luciferase assay. Note the less Wnt3A‐induced TOPflash trans‐activation in cells treated with 20 μM paroxetine. R‐spondin‐1 (RSPO1) was used to block endogenous inhibition of canonical Wnt. Mean ± SEM. Mann–Whitney U‐test; number of biological experiments is indicated.
- B
T‐REx™ 293 cells with GRK2 inhibited by 20 μM paroxetine show lower levels of LRP6 and lower pDVL2/DVL2 ratio, as determined by Western blot and quantified by densitometry. No significant Wnt3A‐induced LRP6‐T1572 phosphorylation was observed in T‐REx™ 293 cells. Mean ± SEM. Welch's t‐test; number of biological experiments is indicated.
- C–E
Rat chondrosarcoma (RCS) cells (C), and control R00‐082 (D) and R92‐284 (E) chondrocytes were treated with 20 μM paroxetine overnight and then treated with Wnt3A for 1 h. Note the lower levels of LRP6 and less LRP6 phosphorylation (pS1490‐ and pT1572‐LRP6) in cells treated with paroxetine. #, nonspecific band. Mean ± SEM. Welch's t‐test (C) and Mann–Whitney U test (D, E); number of biological experiments is indicated.
References
-
- Ågren M, Kogerman P, Kleman MI, Wessling M, Toftgård R (2004) Expression of the PTCH1 tumor suppressor gene is regulated by alternative promoters and a single functional Gli‐binding site. Gene 330: 101–114 - PubMed
-
- Arts HH, Bongers EMHF, Mans DA, van Beersum SEC, Oud MM, Bolat E, Spruijt L, Cornelissen EAM, Schuurs‐Hoeijmakers JHM, de Leeuw N et al (2011) C14ORF179 encoding IFT43 is mutated in Sensenbrenner syndrome. J Med Genet 48: 390–395 - PubMed
-
- Aza‐Blanc P, Lin HY, Ruiz i Altaba A, Kornberg TB (2000) Expression of the vertebrate Gli proteins in Drosophila reveals a distribution of activator and repressor activities. Development 127: 4293–4301 - PubMed
Publication types
MeSH terms
Substances
Supplementary concepts
Grants and funding
LinkOut - more resources
Full Text Sources
Molecular Biology Databases
Research Materials
