

Factors affecting the doses of roxadustat vs darbepoetin alfa for anemia treatment in hemodialysis patients
- PMID: 33200512
- PMCID: PMC8451884
- DOI: 10.1111/1744-9987.13609
Factors affecting the doses of roxadustat vs darbepoetin alfa for anemia treatment in hemodialysis patients
Abstract
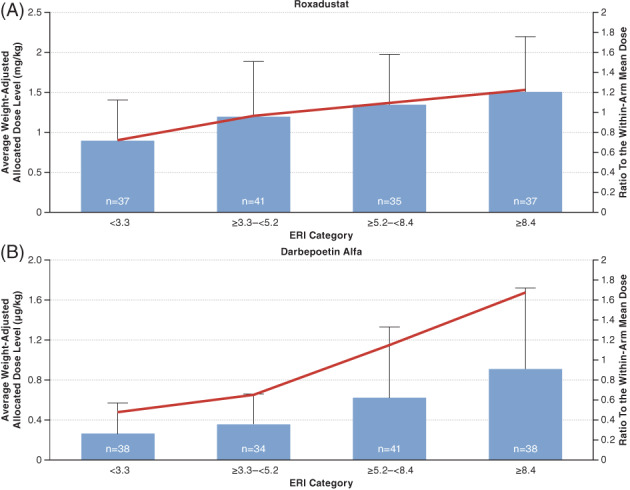
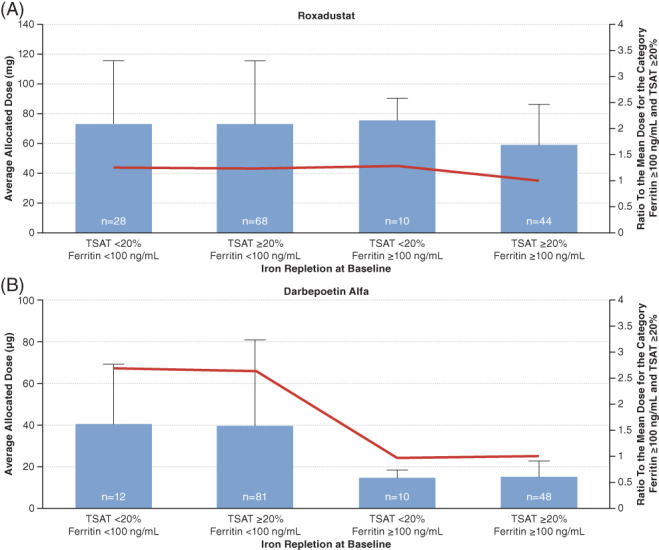
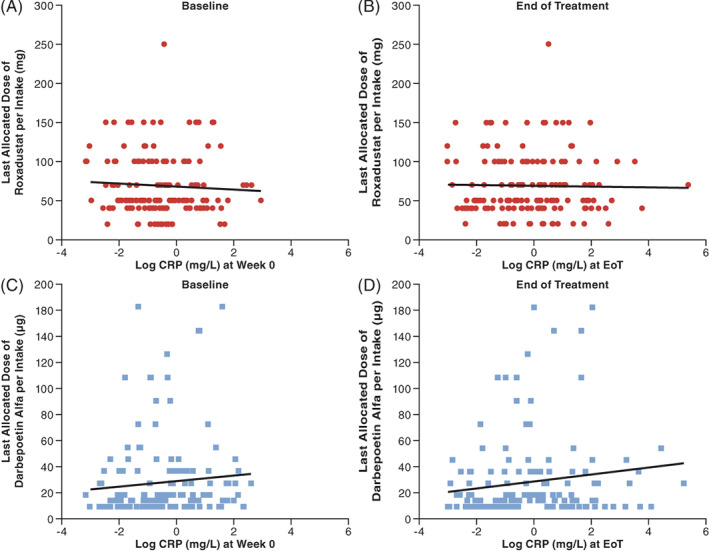
Roxadustat is an oral hypoxia-inducible factor prolyl hydroxylase inhibitor for the treatment of anemia in chronic kidney disease (CKD). Emerging evidence suggests that roxadustat may be beneficial for patients who inadequately respond to erythropoiesis-stimulating agents (ESAs). This post-hoc analysis of a Japanese, double-blind, randomized, phase 3 study in hemodialysis-dependent CKD patients treated with traditional ESAs assessed the impact of factors associated with ESA hyporesponsiveness on roxadustat and darbepoetin alfa (DA) doses required to maintain target hemoglobin. Endpoints included mean of average doses of roxadustat and DA per administration in the last 6 weeks (AAD/6W) by prior ESA-resistance index (ERI), iron repletion (transferrin saturation; ferritin), and high-sensitivity C-reactive protein (hs-CRP). Of 415 enrolled patients, 303 were randomized (roxadustat, n = 151; DA, n = 152). Weight-adjusted AAD/6W increased with increasing ERI for roxadustat (ERI <3.3, 0.89 mg/kg; ERI ≥8.4, 1.51 mg/kg) and DA (ERI <3.3, 0.26 μg/kg; ERI ≥8.4, 0.91 μg/kg); the weight-adjusted AAD/6W relative to within-arm mean AAD/6W showed a trend toward increased DA doses for the ERI ≥8.4 category (P = .089). AAD/6W remained stable for roxadustat but increased for DA with decreasing baseline iron repletion markers. The relationship between roxadustat doses and end of treatment (EoT) hs-CRP was not significant (estimated slope, -0.494; P = .814); a trend toward increased DA doses was observed with increasing EoT hs-CRP (estimated slope, 2.973; P = .075). Roxadustat doses required to maintain target hemoglobin appear to be less affected by factors that underlie ESA hyporesponsiveness, relative to DA; roxadustat may be beneficial for patients hyporesponsive to ESAs.
Keywords: anemia; chronic kidney disease; darbepoetin alfa; inflammation; roxadustat.
© 2020 The Authors. Therapeutic Apheresis and Dialysis published by John Wiley & Sons Australia, Ltd on behalf of International Society for Apheresis, Japanese Society for Apheresis, and Japanese Society for Dialysis Therapy.
Figures
References
-
- Pfeffer MA, Burdmann EA, Chen CY, et al. A trial of darbepoetin alfa in type 2 diabetes and chronic kidney disease. N Engl J Med. 2009;361(21):2019–2032. - PubMed
-
- Del Vecchio L, Locatelli F. An overview on safety issues related to erythropoiesis‐stimulating agents for the treatment of anaemia in patients with chronic kidney disease. Expert Opin Drug Saf. 2016;15(8):1021–1030. - PubMed
-
- Johnson DW, Pollock CA, Macdougall IC. Erythropoiesis‐stimulating agent hyporesponsiveness. Nephrology (Carlton, Vic). 2007;12(4):321–330. - PubMed
-
- Solomon SD, Uno H, Lewis EF, et al. Erythropoietic response and outcomes in kidney disease and type 2 diabetes. N Engl J Med. 2010;363(12):1146–1155. - PubMed
Publication types
MeSH terms
Substances
Grants and funding
LinkOut - more resources
Full Text Sources
Medical
Research Materials
Miscellaneous
