

Increased transcriptome variation and localised DNA methylation changes in oocytes from aged mice revealed by parallel single-cell analysis
- PMID: 33201571
- PMCID: PMC7744954
- DOI: 10.1111/acel.13278
Increased transcriptome variation and localised DNA methylation changes in oocytes from aged mice revealed by parallel single-cell analysis
Erratum in
-
Correction to 'Increased transcriptome variation and localised DNA methylation changes in oocytes from aged mice revealed by parallel single-cell analysis'.Aging Cell. 2024 Nov;23(11):e14364. doi: 10.1111/acel.14364. Epub 2024 Oct 29. Aging Cell. 2024. PMID: 39468960 Free PMC article. No abstract available.
Abstract
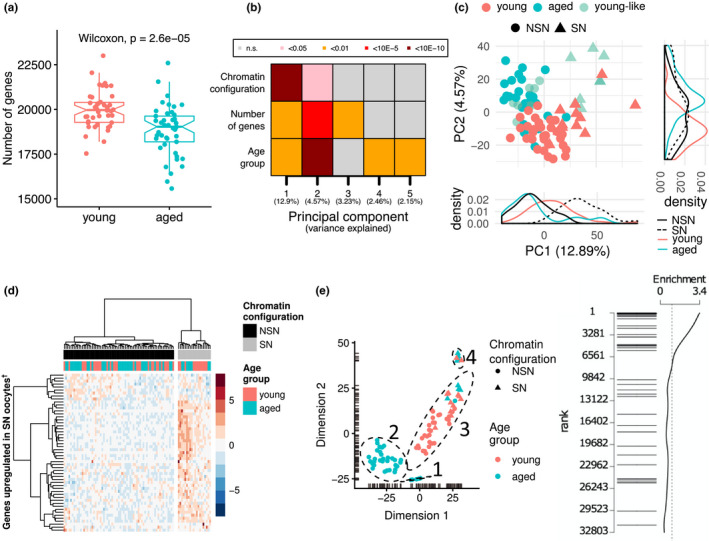
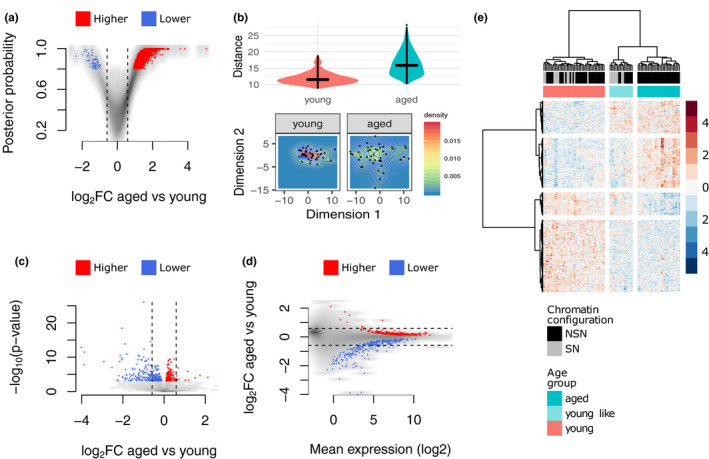
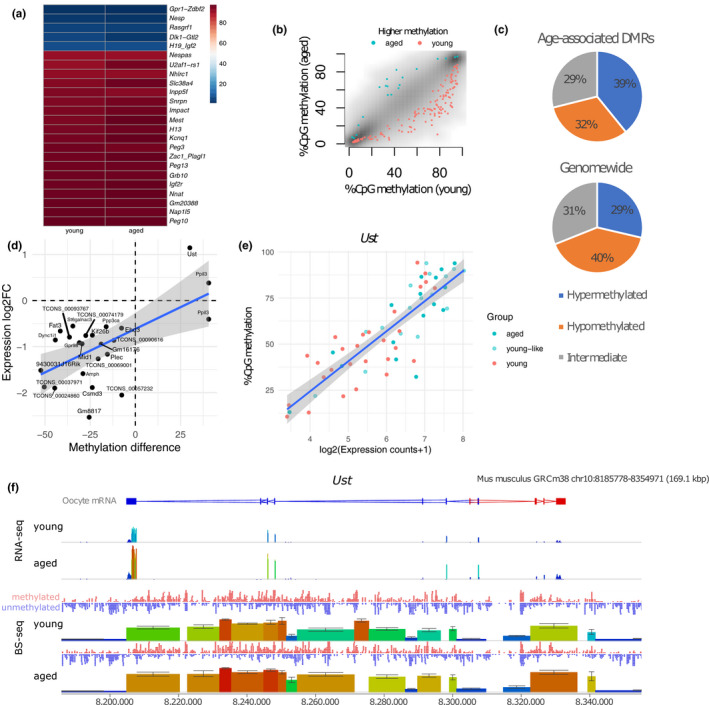
Advancing maternal age causes a progressive reduction in fertility. The decline in developmental competence of the oocyte with age is likely to be a consequence of multiple contributory factors. Loss of epigenetic quality of the oocyte could impair early developmental events or programme adverse outcomes in offspring that manifest only later in life. Here, we undertake joint profiling of the transcriptome and DNA methylome of individual oocytes from reproductively young and old mice undergoing natural ovulation. We find reduced complexity as well as increased variance in the transcriptome of oocytes from aged females. This transcriptome heterogeneity is reflected in the identification of discrete sub-populations. Oocytes with a transcriptome characteristic of immature chromatin configuration (NSN) clustered into two groups: one with reduced developmental competence, as indicated by lower expression of maternal effect genes, and one with a young-like transcriptome. Oocytes from older females had on average reduced CpG methylation, but the characteristic bimodal methylation landscape of the oocyte was preserved. Germline differentially methylated regions of imprinted genes were appropriately methylated irrespective of age. For the majority of differentially expressed transcripts, the absence of correlated methylation changes suggests a post-transcriptional basis for most age-related effects on the transcriptome. However, we did find differences in gene body methylation at which there were corresponding changes in gene expression, indicating age-related effects on transcription that translate into methylation differences. Interestingly, oocytes varied in expression and methylation of these genes, which could contribute to variable competence of oocytes or penetrance of maternal age-related phenotypes in offspring.
Keywords: DNA methylation; advanced maternal age; chromatin; epigenetics; gene expression; oocytes; single-cell genomics.
© 2020 The Authors. Aging Cell published by the Anatomical Society and John Wiley & Sons Ltd.
Conflict of interest statement
The authors declare no competing interests.
Figures

Similar articles
-
DNA methylation mechanisms in the maturing and ageing oocyte.Epigenetics Chromatin. 2025 Jun 11;18(1):34. doi: 10.1186/s13072-025-00600-x. Epigenetics Chromatin. 2025. PMID: 40495235 Free PMC article. Review.
-
Transcriptome and DNA methylation profiling during the NSN to SN transition in mouse oocytes.BMC Mol Cell Biol. 2025 Jan 3;26(1):2. doi: 10.1186/s12860-024-00527-3. BMC Mol Cell Biol. 2025. PMID: 39754059 Free PMC article.
-
Maternal loss of mouse Nlrp2 alters the transcriptome and DNA methylome in GV oocytes and impairs zygotic genome activation in embryos.Clin Epigenetics. 2025 Jun 3;17(1):92. doi: 10.1186/s13148-025-01889-x. Clin Epigenetics. 2025. PMID: 40462191 Free PMC article.
-
Reproductive and epigenetic outcomes associated with aging mouse oocytes.Hum Mol Genet. 2009 Jun 1;18(11):2032-44. doi: 10.1093/hmg/ddp127. Epub 2009 Mar 17. Hum Mol Genet. 2009. PMID: 19293340
-
Epigenetic changes associated with oocyte aging.Sci China Life Sci. 2012 Aug;55(8):670-6. doi: 10.1007/s11427-012-4354-3. Epub 2012 Aug 30. Sci China Life Sci. 2012. PMID: 22932882 Review.
Cited by
-
Oocyte Aging: A Multifactorial Phenomenon in A Unique Cell.Aging Dis. 2024 Feb 1;15(1):5-21. doi: 10.14336/AD.2023.0527. Aging Dis. 2024. PMID: 37307833 Free PMC article. Review.
-
DNA methylation mechanisms in the maturing and ageing oocyte.Epigenetics Chromatin. 2025 Jun 11;18(1):34. doi: 10.1186/s13072-025-00600-x. Epigenetics Chromatin. 2025. PMID: 40495235 Free PMC article. Review.
-
The dynamics of DNA methylation, histone methylation and acetylation during oocyte aging in mammalian species and possible interventions to regulate them.J Assist Reprod Genet. 2025 Jul 14. doi: 10.1007/s10815-025-03577-4. Online ahead of print. J Assist Reprod Genet. 2025. PMID: 40653579 Review.
-
Midkine as a driver of age-related changes and increase in mammary tumorigenesis.Cancer Cell. 2024 Nov 11;42(11):1936-1954.e9. doi: 10.1016/j.ccell.2024.09.002. Epub 2024 Oct 3. Cancer Cell. 2024. PMID: 39366375
-
Proteostasis in the Male and Female Germline: A New Outlook on the Maintenance of Reproductive Health.Front Cell Dev Biol. 2021 Apr 16;9:660626. doi: 10.3389/fcell.2021.660626. eCollection 2021. Front Cell Dev Biol. 2021. PMID: 33937261 Free PMC article. Review.
References
-
- Angermueller, C. , Clark, S. J. , Lee, H. J. , Macaulay, I. C. , Teng, M. J. , Hu, T. X. , Krueger, F. , Smallwood, S. A. , Ponting, C. P. , Voet, T. , Kelsey, G. , Stegle, O. , & Reik, W. (2016). Parallel single‐cell sequencing links transcriptional and epigenetic heterogeneity. Nature Methods, 13(3), 229–232. 10.1038/nmeth.3728 - DOI - PMC - PubMed
-
- Barone, S. , Sarogni, P. , Valli, R. , Pallotta, M. M. , Silvia, G. , Frattini, A. , Khan, A. W. , Rapalini, E. , Parri, C. , & Musio, A. (2020). Chromosome missegregation in single human oocytes is related to the age and gene expression profile. International Journal of Molecular Sciences, 21(6), 1934 10.3390/ijms21061934 - DOI - PMC - PubMed
-
- Barragán, M. , Pons, J. , Ferrer‐Vaquer, A. , Cornet‐Bartolomé, D. , Schweitzer, A. , Hubbard, J. , Auer, H. , Rodolosse, A. , & Vassena, R. (2017). The transcriptome of human oocytes is related to age and ovarian reserve. Molecular Human Reproduction, 23(8), 535–548. 10.1093/molehr/gax033 - DOI - PubMed
-
- Branco, M. R. , King, M. , Perez‐Garcia, V. , Bogutz, A. B. , Caley, M. , Fineberg, E. , Lefebvre, L. , Cook, S. J. , Dean, W. , Hemberger, M. , & Reik, W. (2016). Maternal DNA Methylation Regulates Early Trophoblast Development. Developmental Cell, 36(2), 152–163. 10.1016/j.devcel.2015.12.027 - DOI - PMC - PubMed
Publication types
MeSH terms
Substances
Grants and funding
LinkOut - more resources
Full Text Sources
Medical
Molecular Biology Databases
