. 2021 Jul 1;50(5):20200309.
doi: 10.1259/dmfr.20200309. Epub 2020 Nov 30.

Accuracy of high-resolution ultrasound (US) for gingival soft tissue thickness mesurement in edentulous patients prior to implant placement

Affiliations

Accuracy of high-resolution ultrasound (US) for gingival soft tissue thickness mesurement in edentulous patients prior to implant placement

Gül Sönmez et al. Dentomaxillofac Radiol. .

Abstract

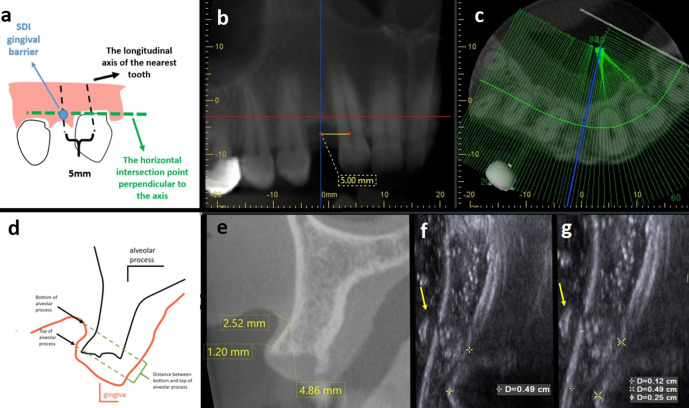
Objectives: To evaluate and compare the accuracy of high-resolution ultrasound (US) with two different cone beam CT (CBCT) units and clinical assessment for measuring gingival soft tissue thickness in edentulous patients prior to implant placement.

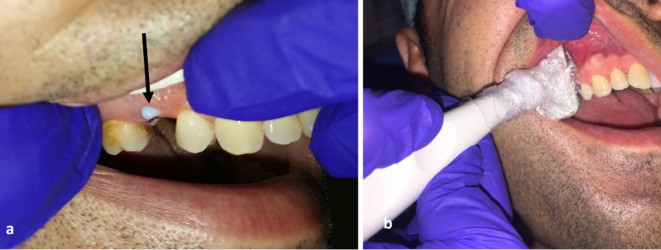
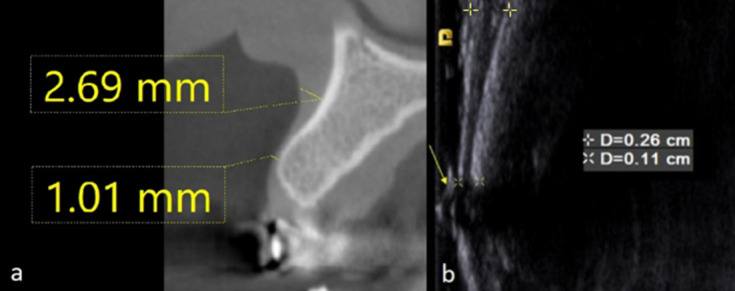
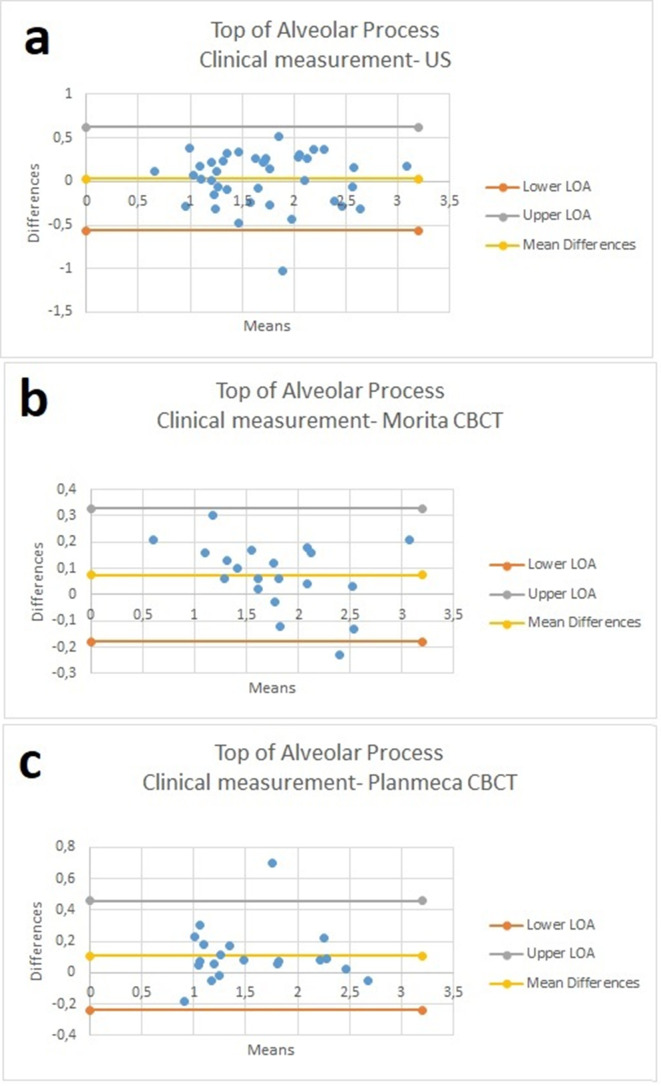
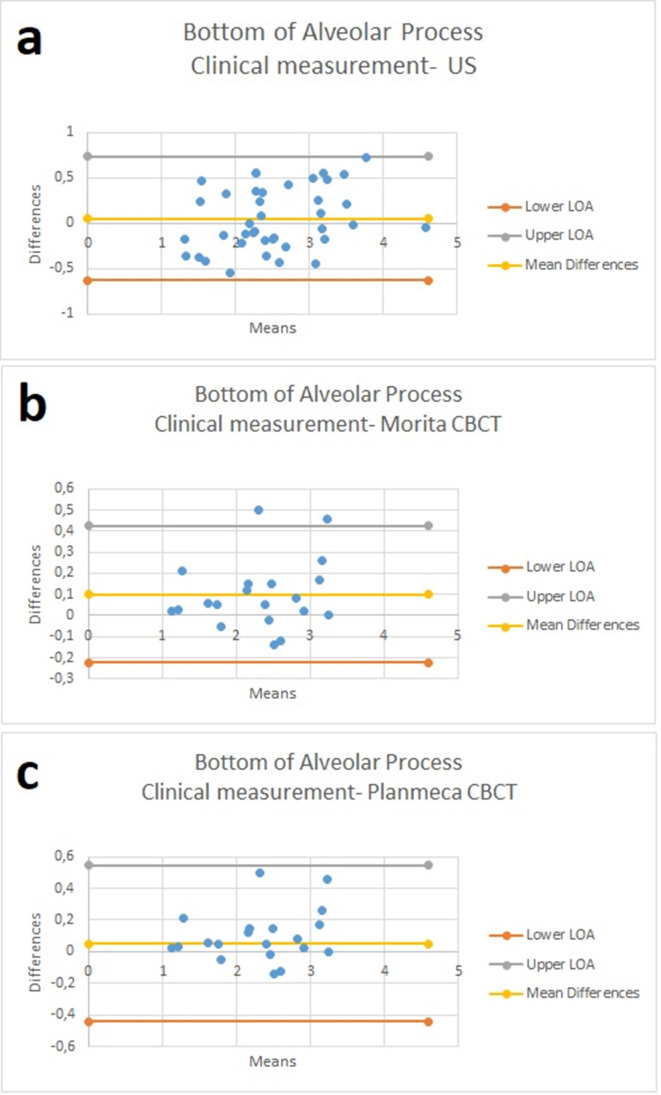
Methods and materials: The study consisted of 40 maxillary implant sites of 40 healthy patients (20 females, 20 males; mean age, 47.88 years). We prospectively evaluated labial/buccal gingival thickness in 40 implant regions (16 anterior and 24 posterior) by using limited field of view (FOV) CBCT images and US images in comparison to gold standard transgingival probing measurements. One-way analysis of variance (ANOVA) was used to compare mean measurements obtained from CBCT (Morita and Planmeca), US, and transgingival probing. Interclass correlation coefficient (ICC) estimates were calculated based on means with two-way mixed and absolute-agreement model. Bland Altman plot was used to describe agreement between clinical vs US and CBCT measurements by constructing limits of agreement. Statistical significance was set at p < 0.05.

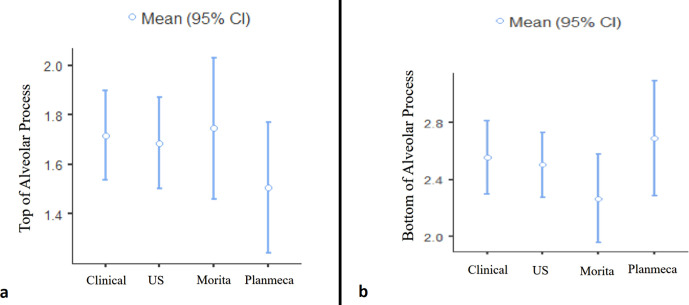
Results: There was no significant difference between methods used according to mean gingival thickness measurements obtained from the top (p = 0.519) and bottom (p = 0.346) of the alveolar process. US and CBCT measurements highly correlated with clinical measurements for both top and bottom alveolar process gingival thickness (p < 0.001). Distribution of differences between clinical measurements and both CBCT measurements showed statistically significant differences according to 0 (p < 0.05). Distribution of differences between clinical measurements and US measurements did not show statistically significant difference (p > 0.05).

Conclusion: High-resolution US provided accurate information for the measurement of gingival soft tissue thickness in edentulous patients prior to implant placement.

Keywords: Dental implantation; Gingival thickness; Measurement; Ultrasonography.


Figures

Figure 1.
Figure 1.
Gingival soft tissue thickness measurement of the same implant region conducted by CBCT (i-Dixel Software, Morita 3D Accuitomo 170®, J Morita, Kyoto, Japan) and US ACUSON S 2000 (Siemens, Munich, Germany) in mm and cm.) (a) Schematic drawing of reference point determination. Black arrow shows the longitudinal axis of nearest adjacent tooth and 5 mm distance on cemento-enamal junction level; green arrow shows the horizontal intersection point perpendicular to long axis; blue circle and arrow show SDI gingival barrier. (b) Representative panoramic view showing 5 mm distance measurement between longitudinal axis of adjacent tooth; blue line corresponds to selected cross-sectional image. (c) Axial CBCT image: blue line corresponds to selected cross-sectional image. (d) Representative schematic drawing of reference point determination. (e) Representative CBCT image of the drawing shown in (d). Labial/buccal soft tissue thickness measurements were performed perpendicular to alveolar process at two different points; top of the alveolar process and bottom of the alveolar process on CBCT images by using measurement tools in mm. The distance between top of alveolar process and bottom (f) Vertical distance measurement between reference points was found to be 0.49 cm in US image. Hyperechogenic barrier was used as reference point for mesiodistal location of measurement point. Yellow arrow shows hyperechogenic gingival barrier. (g) In US images gingival thickness measurement of top and bottom of alveolar process was 0.12 cm and 0.25 cm, respectively.
Figure 2.
Figure 2.
(a) Gingival barrier placement prior to US examination. Black arrow shows acrylic gingival barrier. (b) A 15 MHz hockey (stick) probe was covered with ultrasonography gel and sterile sheath and the transducer was positioned perpendicular to alveolar process in order to enable cross-sectional assessment of the implant site.
Figure 3.
Figure 3.
Gingival soft tissue thickness measurement of the same implant region conducted by CBCT (i-Dixel Software, Morita 3D Accuitomo 170®, J Morita, Kyoto, Japan) and US ACUSON S 2000 (Siemens, Munich, Germany) in mm and cm, respectıvely. Gingival soft tissue thickness measurement of the same implant region conducted by CBCT and US. (a) Soft tissue measurement was conducted on CBCT images perpendicular to the alveolar process at two different points: top of alveolar process and bottom of alveolar process. (b) Soft tissue measurement on US images perpendicular to the alveolar process at two different points: top of alveolar process and bottom of alveolar process. Yellow arrow shows hyperechogenic gingival barrier.
Figure 4.
Figure 4.
Analysis of mean differences between methods used. (a) Analysis of mean differences between different methods for the top of alveolar process gingival thickness measurements according to one-way ANOVA analysis. (b) Analysis of mean differences between different methods for the bottom of alveolar process gingival thickness measurements according to one-way ANOVA analysis.
Figure 5.
Figure 5.
Bland-Altman graphics for the measurements performed at the top of alveolar process. (a) Mean difference between clinical and US measurements was found to be 0.032. (b) Mean difference between clinical and Morita CBCT measurements was found to be 0.075.) (c) Mean difference between clinical and Planmeca CBCT measurements was found to be 0.1095.
Figure 6.
Figure 6.
Bland-Altman graphics for the measurements performed at the bottom of alveolar process. (a) Mean difference between clinical and US measurements was found to be 0.0518.) (b) Mean difference between clinical measurement and Morita CBCT measurement was found to be 0.1). (c) Mean difference between clinical measurement and Planmeca CBCT measurement was found to be 0.051.

References

    1. Kamburoğlu K, Gülşahı A, Genç Y, Paksoy CS. A comparison of peripheral marginal bone loss at dental implants measured with conventional intraoral film and digitized radiographs. J Oral Implantol 2012; 38: 211–9. doi: 10.1563/AAID-JOI-D-09-00147 - DOI - PubMed
    1. Garber DA. The esthetic dental implant: letting restoration be the guide. J Am Dent Assoc 1995; 126: 319–25. doi: 10.14219/jada.archive.1995.0175 - DOI - PubMed
    1. Levin L, Pathael S, Dolev E, Schwartz-Arad D. Aesthetic versus surgical success of single dental implants: 1- to 9-year follow-up. Pract Proced Aesthet Dent 2005; 17: 533–8. - PubMed
    1. Cook DR, Mealey BL, Verrett RG, Mills MP, Noujeim ME, Lasho DJ, et al. . Relationship between clinical periodontal biotype and labial plate thickness: an in vivo study. Int J Periodontics Restorative Dent 2011; 31: 345–54. - PubMed
    1. Fu J-H, Lee A, Wang H-L. Influence of tissue biotype on implant esthetics. Int J Oral Maxillofac Implants 2011; 26: 499–508. - PubMed

LinkOut - more resources