. 2020 Dec 17;5(24):e141316.
doi: 10.1172/jci.insight.141316.

Childhood severe acute malnutrition is associated with metabolomic changes in adulthood

Affiliations

Childhood severe acute malnutrition is associated with metabolomic changes in adulthood

Debbie S Thompson et al. JCI Insight. .

Abstract

BACKGROUNDSevere acute malnutrition (SAM) is a major contributor to global mortality in children under 5 years. Mortality has decreased; however, the long-term cardiometabolic consequences of SAM and its subtypes, severe wasting (SW) and edematous malnutrition (EM), are not well understood. We evaluated the metabolic profiles of adult SAM survivors using targeted metabolomic analyses.METHODSThis cohort study of 122 adult SAM survivors (SW = 69, EM = 53) and 90 age-, sex-, and BMI-matched community participants (CPs) quantified serum metabolites using direct flow injection mass spectrometry combined with reverse-phase liquid chromatography. Univariate and sparse partial least square discriminant analyses (sPLS-DAs) assessed differences in metabolic profiles and identified the most discriminative metabolites.RESULTSSeventy-seven metabolite variables were significant in distinguishing between SAM survivors (28.4 ± 8.8 years, 24.0 ± 6.1 kg/m2) and CPs (28.4 ± 8.9 years, 23.3 ± 4.4 kg/m2) (mean ± SDs) in univariate and sPLS-DA models. Compared with CPs, SAM survivors had less liver fat; higher branched-chain amino acids (BCAAs), urea cycle metabolites, and kynurenine/tryptophan (KT) ratio (P < 0.001); and lower β-hydroxybutyric acid and acylcarnitine/free carnitine ratio (P < 0.001), which were both associated with hepatic steatosis (P < 0.001). SW and EM survivors had similar metabolic profiles as did stunted and nonstunted SAM survivors.CONCLUSIONAdult SAM survivors have distinct metabolic profiles that suggest reduced β-oxidation and greater risk of type 2 diabetes (BCAAs, KT ratio, urea cycle metabolites) compared with CPs. This indicates that early childhood SAM exposure has long-term metabolic consequences that may worsen with age and require targeted clinical management.FUNDINGHealth Research Council of New Zealand, Caribbean Public Health Agency, Centre for Global Child Health at the Hospital for Sick Children. DST is an Academic Fellow and a Restracomp Fellow at the Centre for Global Child Health. GBG is a postdoctoral fellow of the Research Foundation Flanders.

Keywords: Cardiovascular disease; Diabetes; Metabolism.


Conflict of interest statement

Conflict of interest: The authors have declared that no conflict of interest exists.

Figures

Figure 1
Figure 1. Group classification of adult SAM survivors and age-, sex-, and BMI-matched community participants based on the serum concentrations of metabolite variables.
(A) Volcano plot displaying the differential metabolite variables measured in serum of either adult SAM survivors (n = 122) or community participants (n = 90). The horizontal x axis plots the log2 fold change of metabolite variables between groups, while the vertical y axis represents the negative log10 FDR-corrected P value obtained from linear models testing group differences while adjusting for age, sex, and BMI. Gray dots represent metabolite variables that are nonsignificant (NS); blue dots are those with FDR-corrected P < 0.05; red dots are those with both FDR-corrected P < 0.05 and a log2 fold change between groups > 0.25 or < –0.25. Positive x values represent metabolite variables that are higher in adult SAM survivors while negative x values represent those that are lower. (B) Two-dimensional sparse partial least square determinant analysis (sPLS-DA) score plot showing a partial separation of adult SAM survivors (blue circles) and community participants (red circles) based on the serum concentrations of the top selected metabolite variables. Crossed circles indicate group centroids colored as per legend, and the white versus light blue zones demarcate the decision line for group classification. sPLS-DA was performed on standardized concentrations of metabolites that were Box-Cox transformed and adjusted for age, sex, and BMI. BER, balanced error rate.
Figure 2
Figure 2. Correlation plot of the 77 retained metabolite variables in serum that best distinguish SAM survivors (n = 122) from community participants(n = 90) based on sPLS-DA.
Asterisks indicate metabolite variables that also have both an FDR-corrected P < 0.05 and an absolute log2 fold change > 0.25 in univariate models. AA, amino acids; FC, fold change.
Figure 3
Figure 3. Box plots of differentially expressed metabolite variables in serum from the TMIC PRIME Assay mass spectrometry–based analysis between SAM survivors (n = 122) and age-, sex-, and BMI-matched community participants (n = 90).
Box plots summarize medians (midline) and IQRs; circles represent outlying data points; FDR-corrected P values are presented. Gray box includes the top 15 metabolite variables that were most differential between groups; black box highlights differential metabolites previously associated with NCDs. Lyso PC, lysophosphatidylcholines; SM, sphingomyelins, PC aa, phosphatidylcholine di-acyl; PC ae, phosphatidylcholines acyl-alkyl.
Figure 4
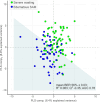
Figure 4. Two-dimensional PLS-DA score plot showing group classification of adult survivors of severe wasting (n = 69, green circles) and edematous malnutrition (n = 53, blue circles) based on the serum concentrations of measured metabolite variables.
Crossed circles indicate group centroids colored as per legend; the white versus light blue zones demarcate the decision line for group classification. PLS-DA was performed on standardized concentrations of metabolites that were Box-Cox transformed and adjusted for age, sex, and BMI.
Figure 5
Figure 5. Pairwise correlation plots.
Pairwise correlation plots between concentrations of β-hydroxybutyric acid, acylcarnitine-to-carnitine ratio, MLA, and L/S ratio in SAM survivors (n = 65) and community participants (n = 69). Correlations were evaluated with nonparametric Spearman’s test.
Figure 6
Figure 6. Participant pairwise similarity.
Participant pairwise similarity (n = 155) presented by heatmaps (left) and networks (right) generated from (A) clinical characteristics, (B) body composition, (C) metabolite variables, and (D) all data types integrated by SNF to form 2 or 4 (K = 2 vs. K = 4) clusters of participants based on the spectral clustering of similarity matrices. The alluvial plot illustrates the redistribution of participants classified into either 2 or 4 clusters where each flow line, colored as per legend, represents the redistribution of a participant between groups. Heatmap colors indicate similarity between participants (dark blue, low similarity; progression toward yellow, increasing similarity). Colors in top horizontal border code for participant attributes: SAM survivors (blue) versus community participants (red) and men (dark) versus women (pale). In network plots, nodes (circles) represent participants colored in gray scale by cluster assignment as per vertical border legend on right of heatmaps. Network edges (lines) represent participants’ pairwise similarities: as per legend, colors indicate contributing data type(s), and both edge thickness and length reflect similarity between participant pairs (i.e., long edges connect participants with low similarity, and short edges connect those with high similarity). Normalized Mutual Information (NMI) metrics assess clustering quality by indicating whether cluster assignment reflects known group labels (e.g., sex or SAM exposure); NMI values are between 0 and 1, with 1 indicating perfect cluster alignment with group labels and 0 having no mutual information (i.e., groups are completely split across clusters). CP, community participant; SNF, similarity network fusion.
Figure 7
Figure 7. Flow chart detailing recruitment of adult survivors of SAM (n = 122) and community participants (n = 90).
“Unable to participate” includes adult survivors of SAM who were unavailable because of migration (n = 53), illness (n = 19), refusal (n = 14), or pregnancy (n = 30). TMRU, Tropical Metabolism Research Unit; UHWI, University Hospital of the West Indies; JAMAKAS, Jamaica Marasmus and Kwashiorkor Adult Survivors; JA-MET, Jamaica Metabolomics.

Similar articles

Cited by

References

    1. UNICEF et al. Levels and Trends in Child Malnutrition: Key Findings of the 2019 Edition of the Joint Child Malnutrition Estimates. WHO. https://www.who.int/nutgrowthdb/jme-2019-key-findings.pdf 2019. Accessed November 16, 2020.
    1. Barker DJ. The developmental origins of adult disease. J Am Coll Nutr. 2004;23(suppl 6):588S–595S. - PubMed
    1. Barker DJ, et al. Type 2 (non-insulin-dependent) diabetes mellitus, hypertension and hyperlipidaemia (syndrome X): relation to reduced fetal growth. Diabetologia. 1993;36(1):62–67. doi: 10.1007/BF00399095. - DOI - PubMed
    1. Victora CG, et al. Maternal and child undernutrition: consequences for adult health and human capital. Lancet. 2008;371(9609):340–357. doi: 10.1016/S0140-6736(07)61692-4. - DOI - PMC - PubMed
    1. DeBoer MD, et al. Early childhood growth failure and the developmental origins of adult disease: do enteric infections and malnutrition increase risk for the metabolic syndrome? Nutr Rev. 2012;70(11):642–653. doi: 10.1111/j.1753-4887.2012.00543.x. - DOI - PMC - PubMed

Publication types