Observational Study
. 2020 Nov 17;16(11):e1009153.
doi: 10.1371/journal.pgen.1009153. eCollection 2020 Nov.

Multivariable G-E interplay in the prediction of educational achievement

Affiliations
Observational Study

Multivariable G-E interplay in the prediction of educational achievement

Andrea G Allegrini et al. PLoS Genet. .

Abstract

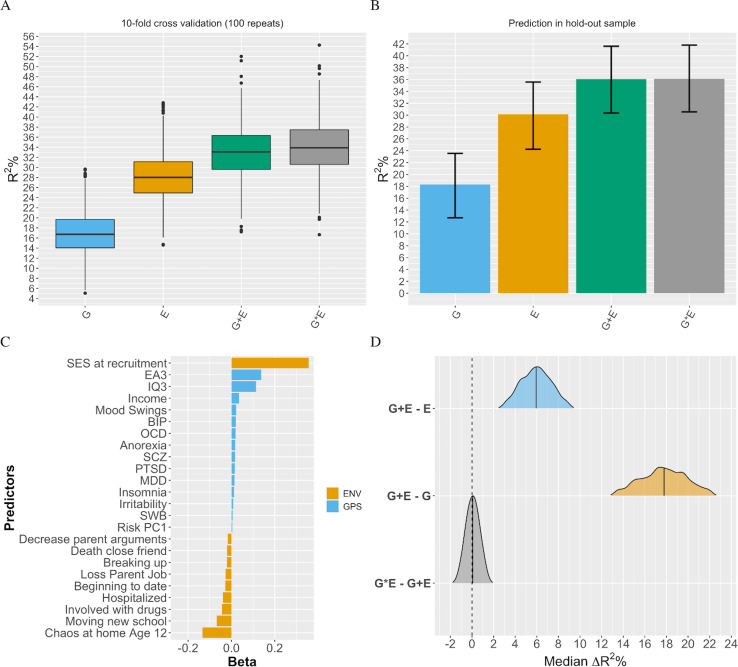
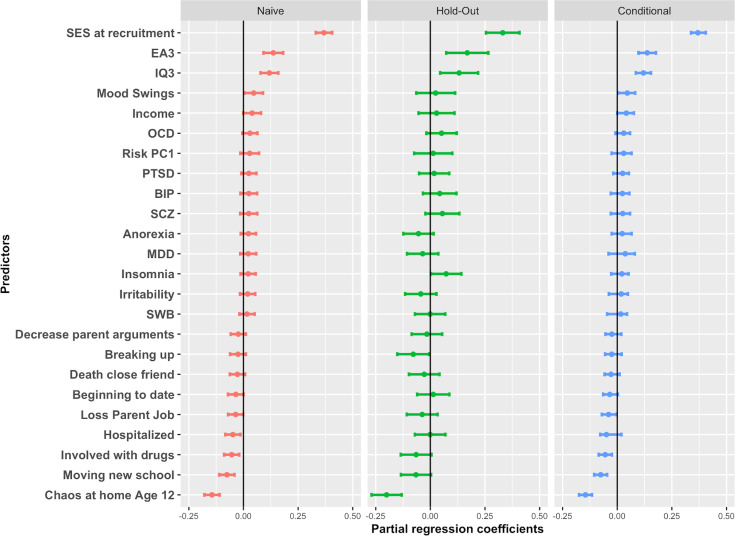
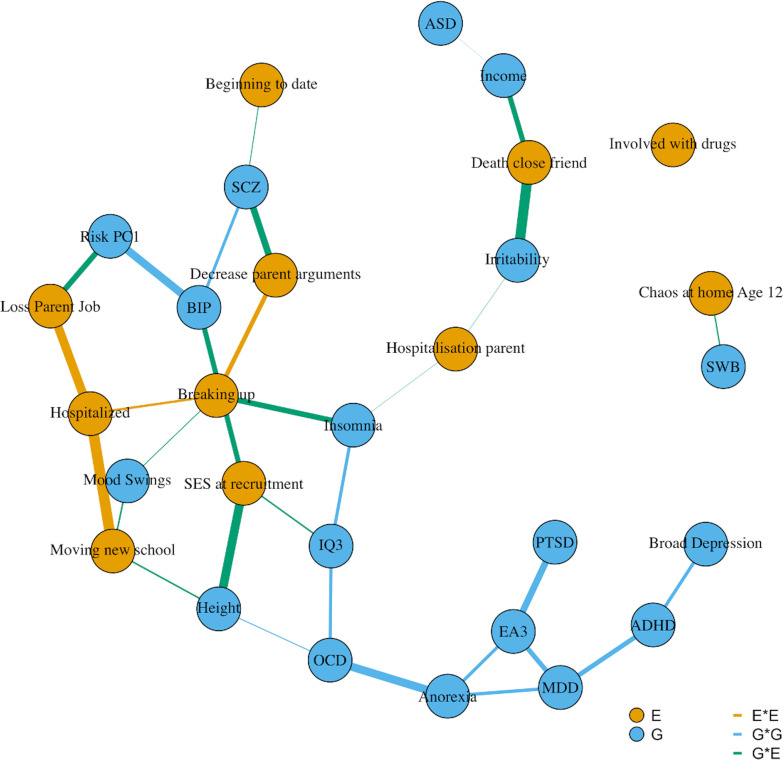
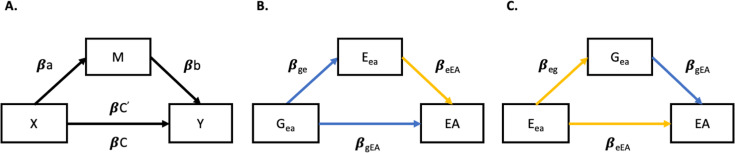
Polygenic scores are increasingly powerful predictors of educational achievement. It is unclear, however, how sets of polygenic scores, which partly capture environmental effects, perform jointly with sets of environmental measures, which are themselves heritable, in prediction models of educational achievement. Here, for the first time, we systematically investigate gene-environment correlation (rGE) and interaction (GxE) in the joint analysis of multiple genome-wide polygenic scores (GPS) and multiple environmental measures as they predict tested educational achievement (EA). We predict EA in a representative sample of 7,026 16-year-olds, with 20 GPS for psychiatric, cognitive and anthropometric traits, and 13 environments (including life events, home environment, and SES) measured earlier in life. Environmental and GPS predictors were modelled, separately and jointly, in penalized regression models with out-of-sample comparisons of prediction accuracy, considering the implications that their interplay had on model performance. Jointly modelling multiple GPS and environmental factors significantly improved prediction of EA, with cognitive-related GPS adding unique independent information beyond SES, home environment and life events. We found evidence for rGE underlying variation in EA (rGE = .38; 95% CIs = .30, .45). We estimated that 40% (95% CIs = 31%, 50%) of the polygenic scores effects on EA were mediated by environmental effects, and in turn that 18% (95% CIs = 12%, 25%) of environmental effects were accounted for by the polygenic model, indicating genetic confounding. Lastly, we did not find evidence that GxE effects significantly contributed to multivariable prediction. Our multivariable polygenic and environmental prediction model suggests widespread rGE and unsystematic GxE contributions to EA in adolescence.


Conflict of interest statement

The authors have declared that no competing interests exist.

Figures

Fig 1
Fig 1. Multivariable prediction of educational achievement.
Panel A = repeated 10-fold cross validation in training set, for the environmental (E), multi-polygenic score (G), joint (G+E), and interaction (G*E) prediction models. Panel B = Hold-out set prediction of EA for best models obtained via repeated cross validation in training set. Error bars are 95% bootstrapped confidence intervals. Panel C = G+E model used in hold-out set prediction. Figure shows variables selected via repeated cross-validation in the training set, and relative importance. Panel D = Comparison of prediction accuracy for models tested as bootstrapped R2 difference between nested models in the hold-out set. Distributions represent independent (non-mediated) genetic effects (G+E−E), environmental effects (G+E−G), and G*E effects (G*E–G+E). Note. PGS = polygenic scores, ENV = Environmental measures. ASD = Autism Spectrum Disorder, BIP = Bipolar Disorder, BMI = Body Mass Index, EA3 = Educational Attainment, IQ3 = Intelligence, OCD = Obsessive Compulsive Disorder, PTSD = Post-Traumatic Stress Disorder, SCZ = Schizophrenia.
Fig 2
Fig 2. Relative contributions of model selected variables for the G+E model in the prediction of educational achievement.
Figure shows partial regression coefficients, and 95% CIs around estimates. Naive = partial regression coefficients from multiple regression of selected variables in Training set; Hold-out = partial regression coefficients of selected variables in the hold-out set; Conditional = partial regression coefficients of training set for selected variables estimated with a conditional probability from a truncated distribution (see methods section). Note. ASD = Autism Spectrum Disorder, ADHD = Attention-Deficit Hyperactivity Disorder, BIP = Bipolar Disorder, EA3 = Educational Attainment, IQ3 = Intelligence, MDD = Major Depressive Disorder, SWB = Subjective Well-Being, OCD = Obsessive Compulsive Disorder, PTSD = Post-Traumatic Stress Disorder, Risk PC1 = First Principal Component of Risky behaviors, SCZ = Schizophrenia.
Fig 3
Fig 3. Interaction network of glinternet model.
Note. Edges width represent interactions weights. E = Environmental measure, G = Genome-wide polygenic score. Polygenic scores acronyms: ASD = Autism Spectrum Disorder, ADHD = Attention-Deficit Hyperactivity Disorder, BIP = Bipolar Disorder, EA3 = Educational Attainment, IQ3 = Intelligence, Income = household income, MDD = Major Depressive Disorder, SWB = Subjective Well-Being, OCD = Obsessive Compulsive Disorder, PTSD = Post-Traumatic Stress Disorder, Risk PC1 = First Principal Component of Risky behaviors, SCZ = Schizophrenia.
Fig 4
Fig 4
Panel A = schematic representation of mediation analysis; βC = effect of a predictor X on an outcome Y; βa = effect of X on a mediator (M); βb = effect of M on Y after adjusting for X; βC’ = effect of X on Y after adjusting for M. Panel B = Directed acyclic graph (DAG) showing Eea mediated effects of Gea on EA in the hold out-set; βge = causal path between Gea and Eea equivalent to rG,E; βeEA = direct independent Eea effects on EA; βgEA = total Gea effects on EA. Panel C = DAG showing Gea mediated effects on EA (genetic confounding, see methods and discussion); βeg = causal path between Eea and Gea equivalent to rG,E; βgEA = direct independent Gea effects on EA; βeEA = total Eea effects on EA. Note. Blue paths represent G model effects, yellow paths represent E model effects.

Similar articles

Cited by

References

    1. Asbury K, Plomin R. G is for genes: what genetics can teach us about how we teach our children. Wiley, Oxford; 2013.
    1. Rimfeld K, Malanchini M, Krapohl E, Hannigan LJ, Dale PS, Plomin R. The stability of educational achievement across school years is largely explained by genetic factors. NPJ science of learning. 2018;3(1):16 10.1038/s41539-018-0030-0 - DOI - PMC - PubMed
    1. Polderman TJC, Benyamin B, de Leeuw CA, Sullivan PF, van Bochoven A, Visscher PM, et al. Meta-analysis of the heritability of human traits based on fifty years of twin studies. Nature genetics. 2015;47:702 10.1038/ng.3285 - DOI - PubMed
    1. Plomin R, Bergeman CS. The nature of nurture: Genetic influence on “environmental” measures. Behavioral and Brain Sciences. 1991;14(3):373–86.
    1. Plomin R, DeFries JC, Loehlin JC. Genotype-environment interaction and correlation in the analysis of human behavior. Psychological bulletin. 1977;84(2):309 - PubMed

Publication types