. 2021 Mar 4;28(3):524-534.e7.
doi: 10.1016/j.stem.2020.10.015. Epub 2020 Nov 16.

CRISPR-Mediated Induction of Neuron-Enriched Mitochondrial Proteins Boosts Direct Glia-to-Neuron Conversion

Affiliations

CRISPR-Mediated Induction of Neuron-Enriched Mitochondrial Proteins Boosts Direct Glia-to-Neuron Conversion

Gianluca L Russo et al. Cell Stem Cell. .

Erratum in

Abstract

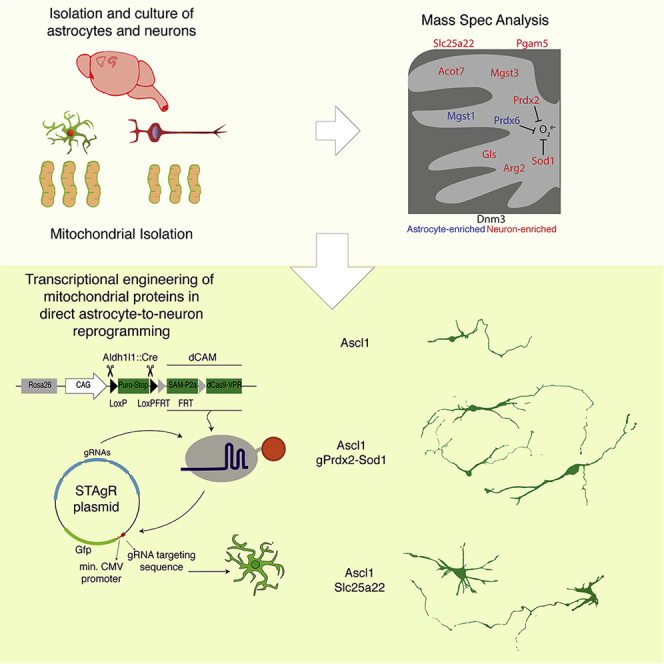
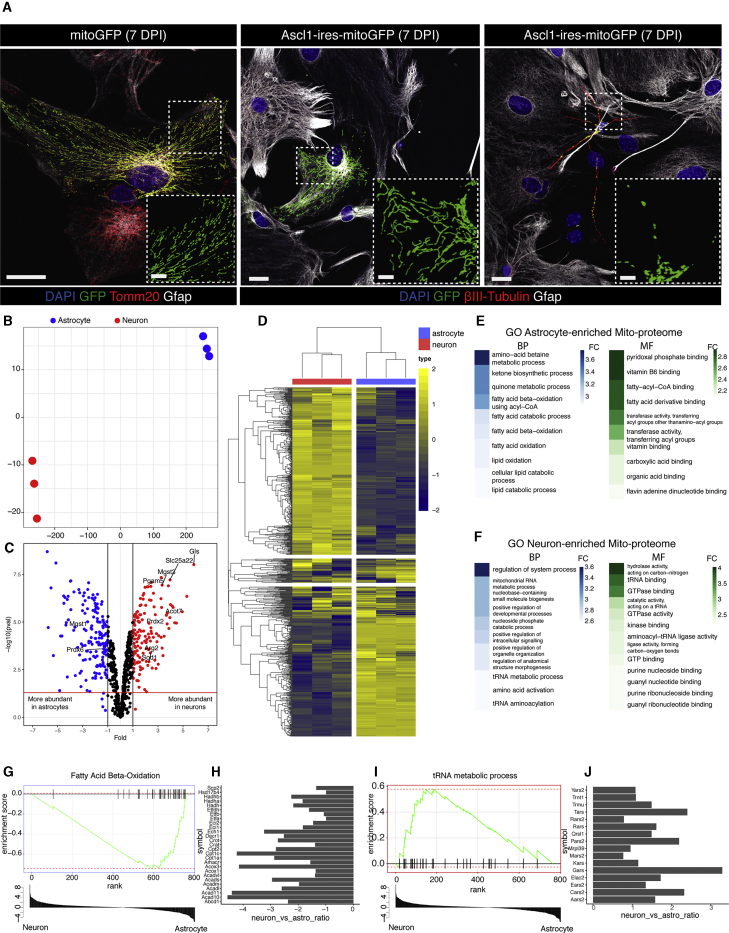
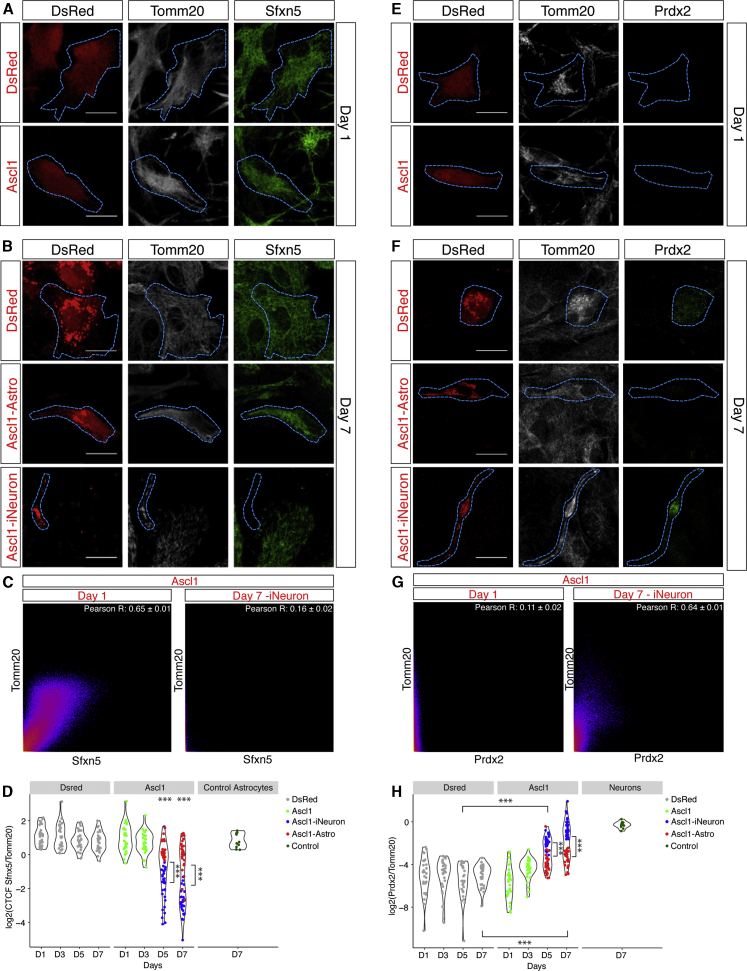
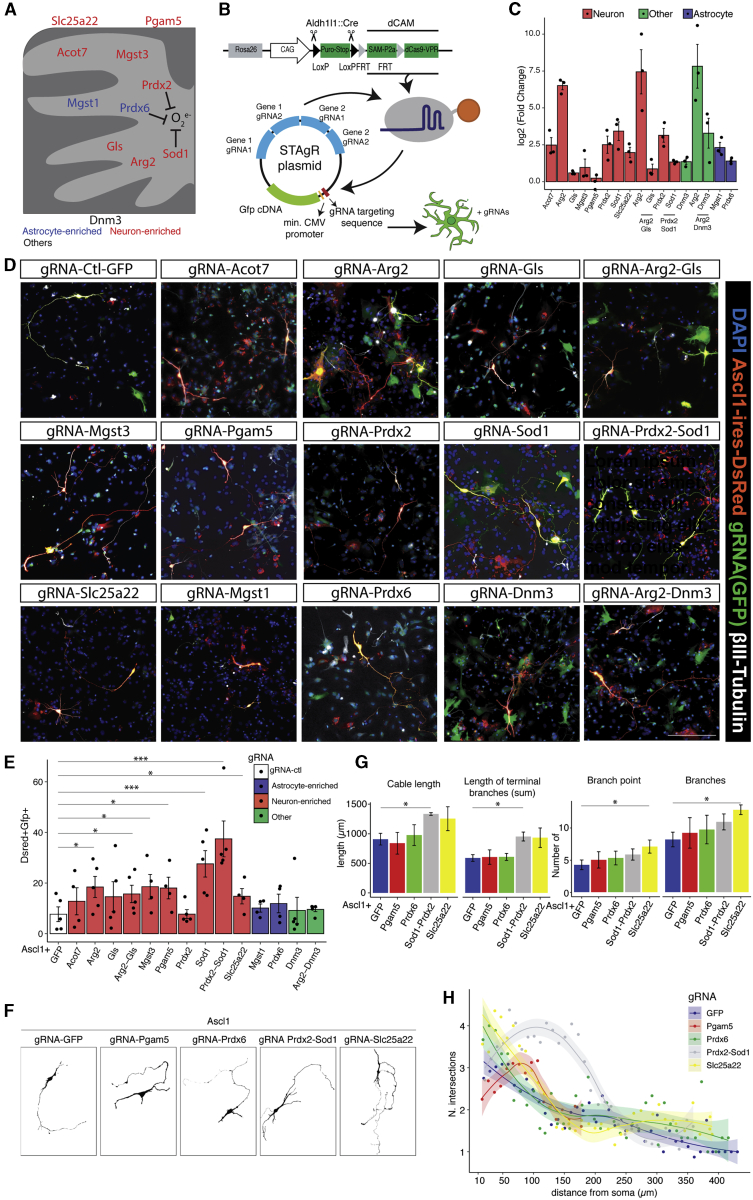
Astrocyte-to-neuron conversion is a promising avenue for neuronal replacement therapy. Neurons are particularly dependent on mitochondrial function, but how well mitochondria adapt to the new fate is unknown. Here, we determined the comprehensive mitochondrial proteome of cortical astrocytes and neurons, identifying about 150 significantly enriched mitochondrial proteins for each cell type, including transporters, metabolic enzymes, and cell-type-specific antioxidants. Monitoring their transition during reprogramming revealed late and only partial adaptation to the neuronal identity. Early dCas9-mediated activation of genes encoding mitochondrial proteins significantly improved conversion efficiency, particularly for neuron-enriched but not astrocyte-enriched antioxidant proteins. For example, Sod1 not only improves the survival of the converted neurons but also elicits a faster conversion pace, indicating that mitochondrial proteins act as enablers and drivers in this process. Transcriptional engineering of mitochondrial proteins with other functions improved reprogramming as well, demonstrating a broader role of mitochondrial proteins during fate conversion.

Keywords: CRISPR-a; antioxidant; direct reprogramming; metabolism; mitochondria; proteome.


Conflict of interest statement

Declaration of Interests The authors declare no competing interests.

Figures

None
Graphical abstract
Figure 1
Figure 1
Astrocytes and Neurons Differ in Mitochondrial Structure and Proteome (A) Micrograph of mitochondrial morphology in control (mitoGFP) astrocytes (left panel), Ascl1-non-reprogrammed astrocytes (center panel), and Ascl1-induced neurons (right panel, Ascl1-mitoGFP), 7 DPI. Scale bars, 20 μm and 6 μm (insets). (B) t-SNE plot of samples considering only mitochondrial proteins. (C) Volcano plot of mitochondrial proteins with log2 ratio of abundance of neurons/astrocytes (x axis) and the –log10 of the corresponding significance value (p value, y axis); 2-fold changes (vertical lines), significance cutoff p = 0.05 (horizontal line). Proteins significantly more abundant in astrocytes are shown in blue and more abundant in neurons in red. Names highlight proteins covered in this study. (D) Unsupervised heatmap cluster analysis of all detected mitochondrial proteins. Astrocytes, blue; neurons, red. n = 3 for each group. The color scale indicates Z score. (E and F) GO terms of the top 10 biological processes (BPs; blue, left panels) and molecular functions (MFs; green, right panels) for astrocyte-enriched (E) and neuron-enriched (F) mitochondrial proteins. The color bar represents the fold change compared with the expected number of genes for each term. Terms were considered if exact Fisher test < 0.01. (G–J) Examples of 2 terms identified by gene set enrichment analysis (GSEA) (G and I) and barplots (H and J) of the main genes associated with the respective terms (in G or I).
Figure 2
Figure 2
Mitochondrial Protein Changes during Astrocyte-to-Neuron Reprogramming (A, B, E, and F) Micrographs showing immunostaining in astrocytes transduced with DsRed or Ascl1-ires-DsRed as indicated. Scale bars, 20 μm. (C and G) Examples of scatterplots of the pixel intensity correlation between Tomm20 and Sfxn5 (C) or Prdx2 (G) in Ascl1-transduced cells on day 1 (left panel) and in reprogrammed cells on day 7 (right panel). Pearson’s coefficient as average of 3 cells/biological replicate; n = 3 biological replicates. (D and H) Violin plots of the log2 ratio of the intensity of the expression of Sfxn5 (D) or Prdx2 (H) normalized to Tomm20 intensity over time. Each dot represents 1 cell. 10 cells analyzed/biological replicate/condition/day. n = 3 biological replicates; ∗∗∗p ≤ 0.001.
Figure 3
Figure 3
CRISPRa-Mediated Activation of Neuron-Enriched Mitochondrial Proteins Improves Neuronal Reprogramming (A and B) Schemes of the selected candidates in mitochondria and the dCas9-CAM-STAgR (string assembly gRNA) system employed here. (C) Real-time quantitative PCR (qPCR) of the candidates in dCas9-CAM gene-specific gRNA-expressing cells. Data are shown as log2 fold change over the gRNA scramble control (mean ± SEM). n = 3 for each group. (D) Micrographs showing reprogrammed cells (βIII-tubulin+-DsRed+-GFP+) upon co-transfection of Ascl1-ires-DsRed (red) and different STAgR constructs (green). Scale bar, 100 μm. (E) Reprogramming efficiency as the percentage of βIII-tubulin+/DsRed+/GFP+ at 7 DPT. Data are shown as mean ± SEM. p < 0.05, ∗∗∗p < 0.001. n = 5 per experimental condition. (F) Examples of the morphology of reprogrammed neurons co-expressing Ascl1 and the indicated gRNAs. (G) Morphological analysis of reprogrammed neurons upon induction of selected candidates (x axis). Data are shown as mean ± SEM. Paired t test, p ≤ 0.05; n = 4 biological replicates. (H) Sholl analysis of reprogrammed neurons co-expressing Ascl1 and the indicated candidates. Data are shown as mean ± SEM. Paired t test, p ≤ 0.05; n = 4 biological replicates.
Figure 4
Figure 4
Continuous Single-Cell Live Imaging Reveals Several Roles of Prdx2-Sod1 Activation in Neuronal Reprogramming (A) Scheme of continuous live imaging and the analysis performed. (B) Time course analysis of the percentage of cells acquiring neuronal morphology over double-transfected cells at the indicated time points. Data are shown as mean ± SEM. p ≤ 0.05. n = 3 biological replicates for each group. (C and D) Violin plot showing the lifespan of all cells analyzed irrespective of their final identity (C) and cells that died without converting (D), following expression of Ascl1-gRNA-GFP or Ascl1-gRNA-Prdx2-Sod1. n = 5 biological replicates for each group. p ≤ 0.05 (E–G) Violin plots showing the lifespan (E and F) and speed of reprogramming (G) upon expression of Ascl1-gRNA-GFP or Ascl1-gRNA-Prdx2-Sod1. n = 5 biological replicates (color-coded) for each group. p ≤ 0.05, ∗∗p ≤ 0.01, ∗∗∗p ≤ 0.001.

References

    1. Barker R.A., Götz M., Parmar M. New approaches for brain repair-from rescue to reprogramming. Nature. 2018;557:329–334. - PubMed
    1. Boulos S., Meloni B.P., Arthur P.G., Bojarski C., Knuckey N.W. Peroxiredoxin 2 overexpression protects cortical neuronal cultures from ischemic and oxidative injury but not glutamate excitotoxicity, whereas Cu/Zn superoxide dismutase 1 overexpression protects only against oxidative injury. J. Neurosci. Res. 2007;85:3089–3097. - PubMed
    1. Bresell A., Weinander R., Lundqvist G., Raza H., Shimoji M., Sun T.H., Balk L., Wiklund R., Eriksson J., Jansson C. Bioinformatic and enzymatic characterization of the MAPEG superfamily. FEBS J. 2005;272:1688–1703. - PubMed
    1. Breunig C.T., Durovic T., Neuner A.M., Baumann V., Wiesbeck M.F., Köferle A., Götz M., Ninkovic J., Stricker S.H. One step generation of customizable gRNA vectors for multiplex CRISPR approaches through string assembly gRNA cloning (STAgR) PLoS ONE. 2018;13:e0196015. - PMC - PubMed
    1. Breunig C.T., Neuner A.M., Giehrl-Schwab J., Wurst W., Götz M., Stricker S.H. A Customizable Protocol for String Assembly gRNA Cloning (STAgR) J. Vis. Exp. 2018;(142):e58556. - PubMed

Publication types

Substances