. 2020 Nov 17;12(22):22626-22655.
doi: 10.18632/aging.103874. Epub 2020 Nov 17.

Colon cancer-specific diagnostic and prognostic biomarkers based on genome-wide abnormal DNA methylation

Affiliations

Colon cancer-specific diagnostic and prognostic biomarkers based on genome-wide abnormal DNA methylation

Yilin Wang et al. Aging (Albany NY). .

Abstract

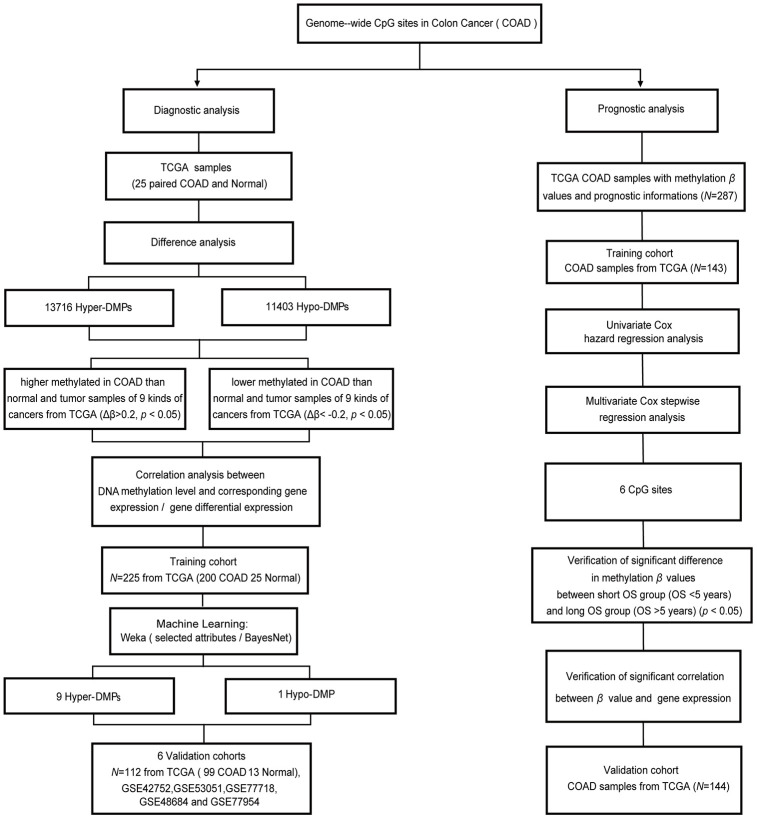
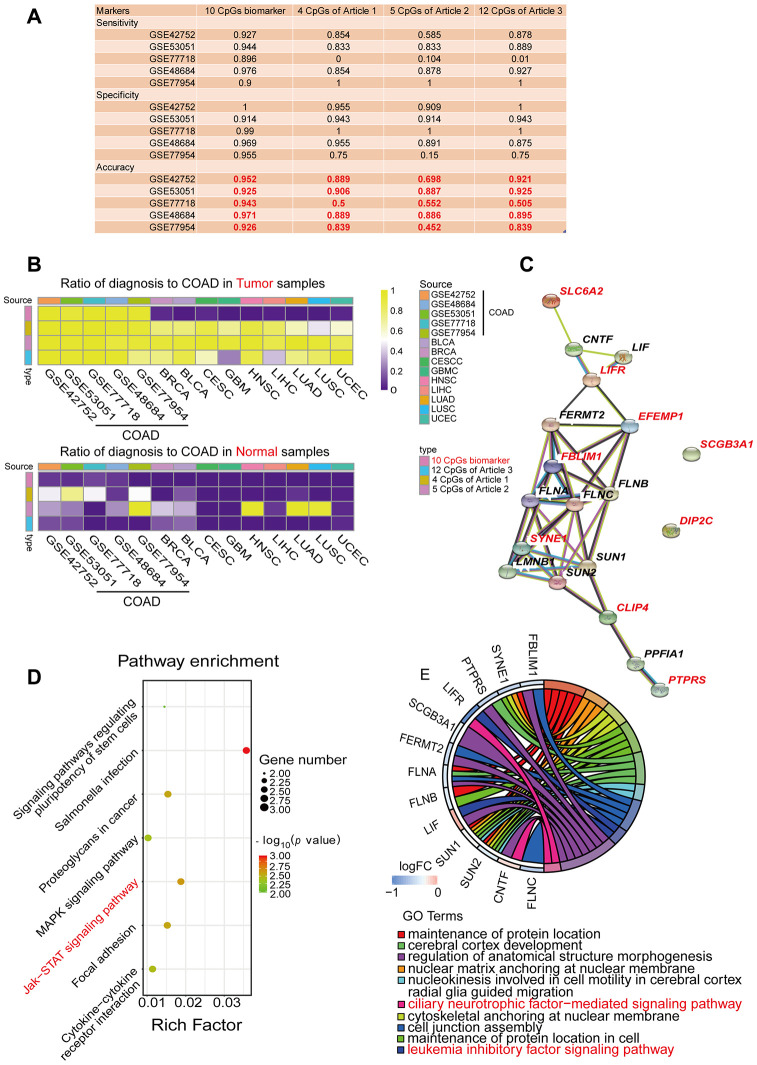
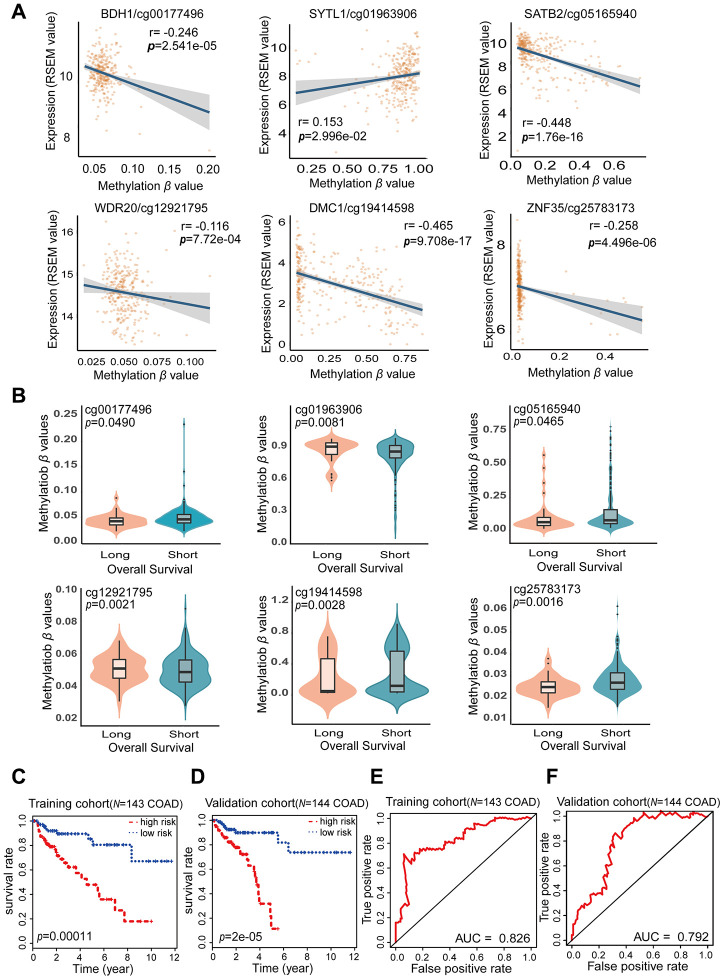
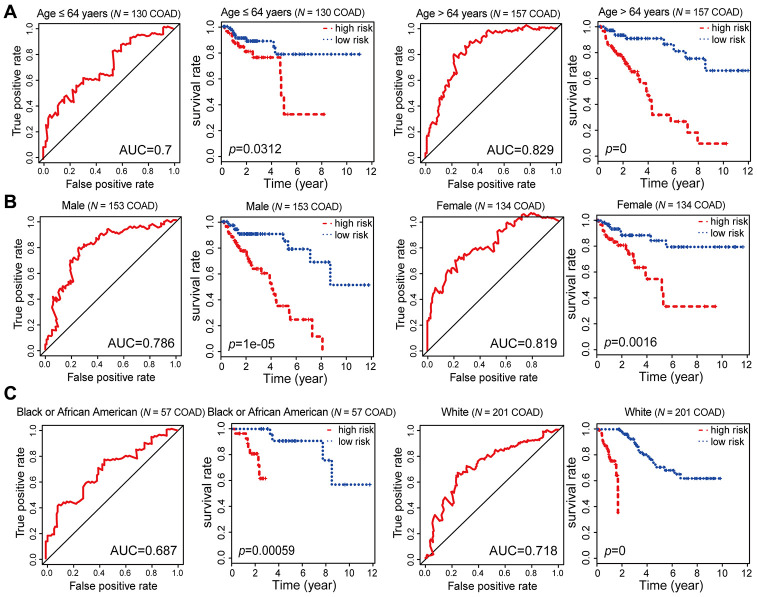
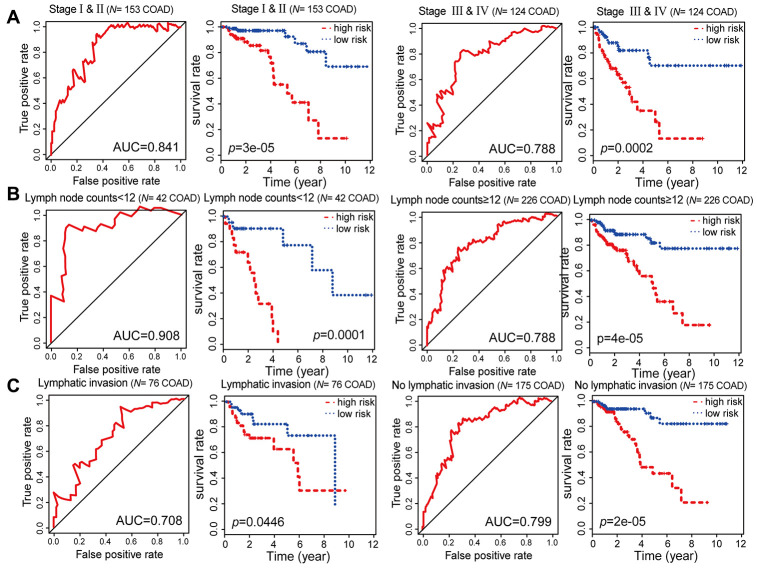
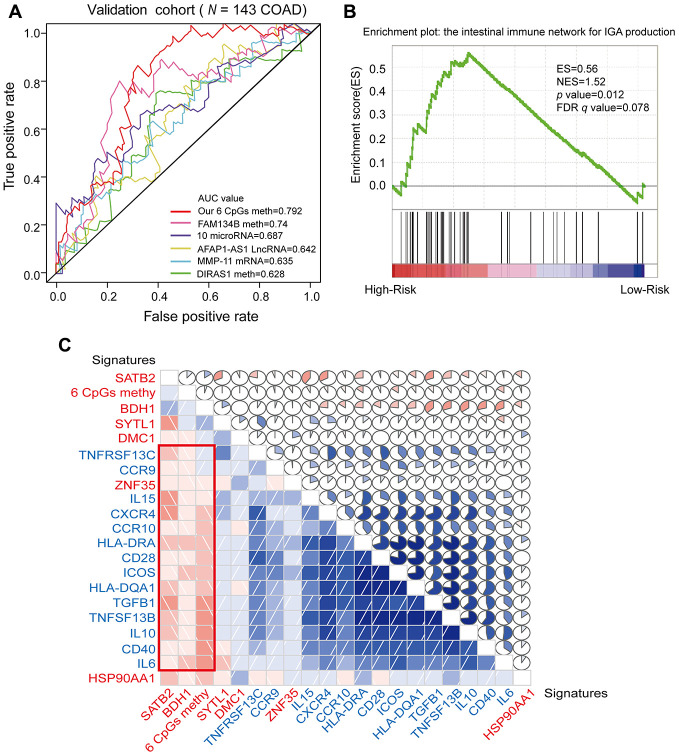
Abnormal DNA methylation is a major early contributor to colon cancer (COAD) development. We conducted a cohort-based systematic investigation of genome-wide DNA methylation using 299 COAD and 38 normal tissue samples from TCGA. Through conditional screening and machine learning with a training cohort, we identified one hypomethylated and nine hypermethylated differentially methylated CpG sites as potential diagnostic biomarkers, and used them to construct a COAD-specific diagnostic model. Unlike previous models, our model precisely distinguished COAD from nine other cancer types (e.g., breast cancer and liver cancer; error rate ≤ 0.05) and from normal tissues in the training cohort (AUC = 1). The diagnostic model was verified using a validation cohort from The Cancer Genome Atlas (AUC = 1) and five independent cohorts from the Gene Expression Omnibus (AUC ≥ 0.951). Using Cox regression analyses, we established a prognostic model based on six CpG sites in the training cohort, and verified the model in the validation cohort. The prognostic model sensitively predicted patients' survival (p ≤ 0.00011, AUC ≥ 0.792) independently of important clinicopathological characteristics of COAD (e.g., gender and age). Thus, our DNA methylation analysis provided precise biomarkers and models for the early diagnosis and prognostic evaluation of COAD.

Keywords: COAD; DMP; diagnosis; pan-cancer; prognosis.


Conflict of interest statement

CONFLICTS OF INTEREST: The authors declare no competing financial interests.

Figures

Figure 1
Figure 1
Workflow diagram for biomarker screening and model construction. The DNA methylation levels of genome-wide CpG sites were used to screen biomarkers and construct diagnostic and prognostic models of COAD. Left side: diagnostic biomarker selection and COAD-specific diagnostic model construction. Conditional screening and machine learning using the selected attributes and BayesNet functions of WEKA were performed to obtain the final nine Hyper-DMPs and one Hypo-DMP as potential biomarkers in the training cohort from TCGA (including 200 COAD and 25 normal samples). BayesNet was used to evaluate the COAD-specific diagnostic model based on these DMPs in the validation cohort from TCGA (including 99 COAD and 13 normal samples) and five independent GEO cohorts (GSE42752, GSE53051, GSE77718, GSE48684 and GSE77954). Right side: prognostic biomarker selection and COAD prognostic model construction. Univariate Cox hazard regression analysis and multivariate Cox stepwise regression analysis were applied to 143 TCGA COAD samples as the training cohort to obtain six CpG sites as potential biomarkers. The prognostic model based on these six CpG sites was evaluated using 144 TCGA COAD samples as the validation cohort.
Figure 2
Figure 2
Distribution of DMPs. (A) Unsupervised hierarchical clustering and heat map display of the methylation levels of the Hyper- and Hypo-DMPs in 25 paired COAD and normal samples from TCGA. (B) The distribution of Hyper-DMPs and Hypo-DMPs in different genomic region types. Island, a CpG site located within a CpG island; Shore, a CpG site located < 2 kilobases from a CpG island; Shelf, a CpG site located > 2 kilobases from a CpG island; Open sea, a CpG site not in an island or annotated gene. (C) The numbers and ratios of Hyper-DMPs and Hypo-DMPs according to their distance from the promoter. TSS1500, 200-1500 base pairs upstream of the transcription start site; TSS200, 200 base pairs upstream of the transcription start site; 5′UTR, 5′ untranslated region; 1st Exon, exon 1; 3′UTR, 3′ untranslated region. (D) The positional distribution (in terms of promoter distance) of the DMPs in which the methylation level correlated positively or negatively with the expression of the corresponding gene (FDR < 0.05). (E) Chromosome distribution of Hyper-DMPs and Hypo-DMPs. Chr: chromosome.
Figure 3
Figure 3
Evaluation of the COAD-specific diagnostic biomarkers and diagnostic model. (A) Heat maps of the average methylation levels of the nine Hyper-DMPs and one Hypo-DMP in all the samples from 10 cancer types. The legend on the right marks the source and CpG type. The picture on the left represents the tumor samples in TCGA, while the picture on the right represents the normal samples in TCGA. (B) Unsupervised hierarchical clustering of the methylation levels of the nine Hyper-DMPs and one Hypo-DMP in all the samples from 10 cancer types. The legend on the right marks the source and CpG type. (CF) Confusion tables (C, E) and corresponding ROC curves (D, F) for the binary results of the COAD-specific diagnostic model in the training cohort (N = 225) and the validation cohort (N = 112) from TCGA. (G) ROC curves of the COAD-specific diagnostic model in five GEO COAD validation cohorts (GSE42752, GSE53051, GSE77718, GSE48684 and GSE77954, which included 22 COAD and 41 normal samples, 35 COAD and 18 normal samples, 96 paired COAD and normal samples, 64 COAD and 41 normal samples, and 20 COAD and 11 normal samples, respectively). (H) The correlation between the DMP methylation level and the expression of the corresponding gene for each diagnostic biomarker, determined through Pearson correlation tests (r > 0.2, FDR < 0.05). Gene expression is presented as the RSEM normalized count converted by log2 (x + 1).
Figure 4
Figure 4
Performance comparison of diagnostic models and enrichment analysis of the corresponding genes. (A) Table displaying the classification performance of different methylation models for COAD and normal tissues in five independent GEO cohorts (GSE42752, GSE53051, GSE77718, GSE48684 and GSE77954). In addition, Azuara et al. [24] (Article 1) reported four CpG sites as diagnostic biomarkers for COAD, and the methylation values for each of them were available in the COAD cohort from TCGA; Beggs et al. [25] (Article 2) reported six CpG sites as diagnostic biomarkers for COAD, and the methylation values for five of them were available in the COAD cohort from TCGA; and Naumov et al. [26] (Article 3) reported 14 CpG sites as diagnostic biomarkers for COAD, and the methylation values for 12 of them were available in the COAD cohort from TCGA. (B) Heat map comparing our diagnostic model with the previous methylation models. Rows are labeled with the different sources of methylation data. The legend indicates that the range is 0-1. The color represents the percentage of the total samples predicted to be COAD. In the cohorts for the nine different cancer types, the ideal results should be 0. (C) Predicted protein interaction network of the genes corresponding to the COAD-specific diagnostic biomarkers. Version 11.0 of the STRING protein database was used. The different line colors represent different kinds of correlations between the proteins corresponding to the model (dark blue for coexistence, black for co-expression, pink for an experiment, light blue for a database, green for text mining, and purple for homology). The red genes are the corresponding genes of the diagnostic biomarkers. Note that CLIP4 is the corresponding gene for both cg08808128 and cg05038216. (D, E) KEGG (D) and GO (E) enrichment analysis results from the STRING protein database. All seven results are shown for the KEGG enrichment analysis, and the top 10 results are shown for the GO enrichment analysis, with p-values arranged from large to small. In the KEGG enrichment graph (D), the X-axis represents the Rich factor, indicating the degree of enrichment (Rich factor = observed gene counts/background gene counts), and the Y-axis represents the enriched KEGG terms. The color represents the -log10 (p-value), and the size of the dot represents the number of genes. In the GO enrichment graph (E), the GO term indicates the GO enrichment pathway.
Figure 5
Figure 5
Characteristics of the potential prognostic biomarkers and evaluation of the combined prognostic model based on six CpG sites. (A) The correlations between the methylation β levels of the prognostic biomarkers and the expression of the corresponding genes were evaluated with Pearson correlation tests. Gene expression is presented as the RSEM normalized count converted by log2 (x + 1). (B) Violin plots of the methylation β values for patients with longer (> 5 years) and shorter (< 5 years) OS in the training cohort, with the median in the centerline. A Wilcoxon test was used to determine the difference between the two groups. The corresponding CpG sites, cor-values and p-values are shown at the top of the plot. (C, D) Kaplan-Meier analysis was performed on the OS of high-risk and low-risk patients using our prognostic model in the training (N = 143) (C) and validation (N = 144) (D) cohorts from TCGA. The difference in OS between the two groups was determined with a log-rank test. Higher risk scores were associated with significantly poorer OS. Patients were divided into low-risk and high-risk groups using the median risk score as the cut-off. (E, F) ROC curves showing the sensitivity and specificity of the prognostic model in predicting patients’ OS in the training (N = 143) (E) and validation (N = 144) (F) cohorts from TCGA.
Figure 6
Figure 6
Kaplan-Meier and ROC analysis results based on age, gender and race. (A) Grouping of COAD patients according to their age at first diagnosis: ≤ 64 years (N = 130, 45.30%), > 64 years (N = 157, 54.70%). (B) Grouping of COAD patients according to gender: male (N = 153, 53.31%), female (N = 134, 46.69%). (C) Grouping of COAD patients according to race: black or African American (N = 57, 21.19%), white (N = 201, 74.72%).
Figure 7
Figure 7
Kaplan-Meier and ROC analysis results based on stage, examined lymph node count and lymphatic invasion. (A) Grouping of COAD patients according to stage: early (stage I and II [N = 153, 53.31%]) and advanced (stage III and IV [N = 124, 43.21%]). (B) Grouping of COAD patients according to examined lymph node count: < 12 (N = 42, 14.63%) and ≥ 12 (N = 226, 78.75%). (C) Grouping of COAD patients according to lymphatic invasion: lymphatic invasion (N = 76, 26.48%) and no lymphatic invasion (N = 175, 60.98%).
Figure 8
Figure 8
ROC analysis of different prognostic biomarkers and functional enrichment analysis of the corresponding genes. (A) ROC curve showing the sensitivity and specificity of our prognostic model and other known models in predicting the OS of patients in the validation cohort from TCGA. (B) COAD samples were divided into high-risk and low-risk groups, and the enrichment of IINIP pathway gene expression was analyzed using GSEA. ES, concentration fraction; NES, standardized ES; p-value, normalized p-value; FDR q-value, p-value corrected by the FDR method. (C) Correlation of the expression of the core enrichment genes from the IINIP pathway, the combined methylation level of our prognostic model and the expression of the genes corresponding to the individual CpG sites of the COAD prognostic biomarkers. The red signature represents the expression of the genes corresponding to the six CpG sites and the six-site combined methylation value; the blue signature represents the expression of the core enrichment genes in the IINIP pathway. Lower triangle: grids showing the correlation between two signatures, where blue indicates a positive correlation and red indicates a negative correlation. Upper triangle: circles represent the one-to-one correlation coefficients, differentiated by the fill area and intensity of shading. Blue indicates a positive correlation and red indicates a negative correlation.

Similar articles

Cited by

References

    1. Siegel RL, Miller KD, Jemal A. Cancer statistics, 2019. CA Cancer J Clin. 2019; 69:7–34. 10.3322/caac.21551 - DOI - PubMed
    1. Rawla P, Sunkara T, Barsouk A. Epidemiology of colorectal cancer: incidence, mortality, survival, and risk factors. Prz Gastroenterol. 2019; 14:89–103. 10.5114/pg.2018.81072 - DOI - PMC - PubMed
    1. Ting WC, Chen LM, Pao JB, Yang YP, You BJ, Chang TY, Lan YH, Lee HZ, Bao BY. Common genetic variants in Wnt signaling pathway genes as potential prognostic biomarkers for colorectal cancer. PLoS One. 2013; 8:e56196. 10.1371/journal.pone.0056196 - DOI - PMC - PubMed
    1. Cancer Genome Atlas Network. Comprehensive molecular characterization of human colon and rectal cancer. Nature. 2012; 487:330–37. 10.1038/nature11252 - DOI - PMC - PubMed
    1. Hong SN. Genetic and epigenetic alterations of colorectal cancer. Intest Res. 2018; 16:327–37. 10.5217/ir.2018.16.3.327 - DOI - PMC - PubMed

Publication types

Substances

LinkOut - more resources