. 2020 Nov 16;12(22):22759-22775.
doi: 10.18632/aging.103909. Epub 2020 Nov 16.

NEAT1/miR-200b-3p/SMAD2 axis promotes progression of melanoma

Affiliations

NEAT1/miR-200b-3p/SMAD2 axis promotes progression of melanoma

Wen-Jie Zhou et al. Aging (Albany NY). .

Abstract

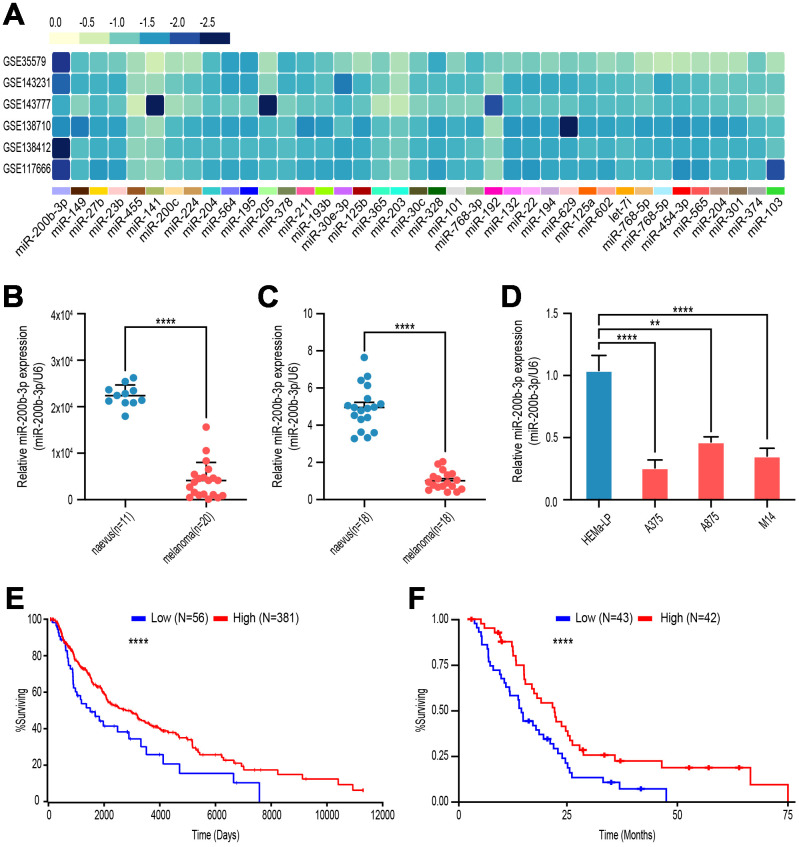
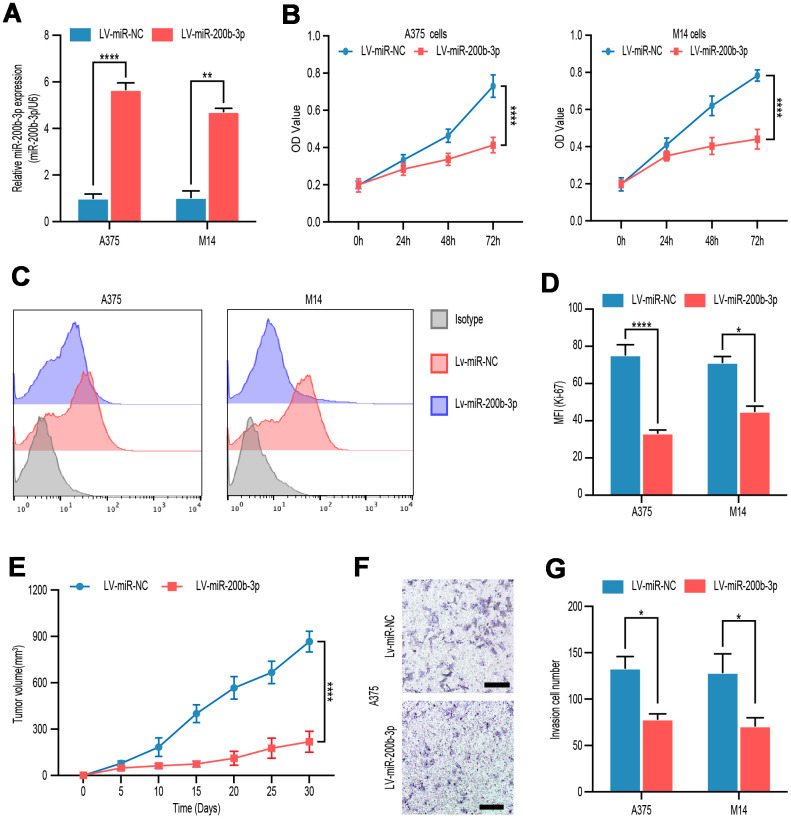
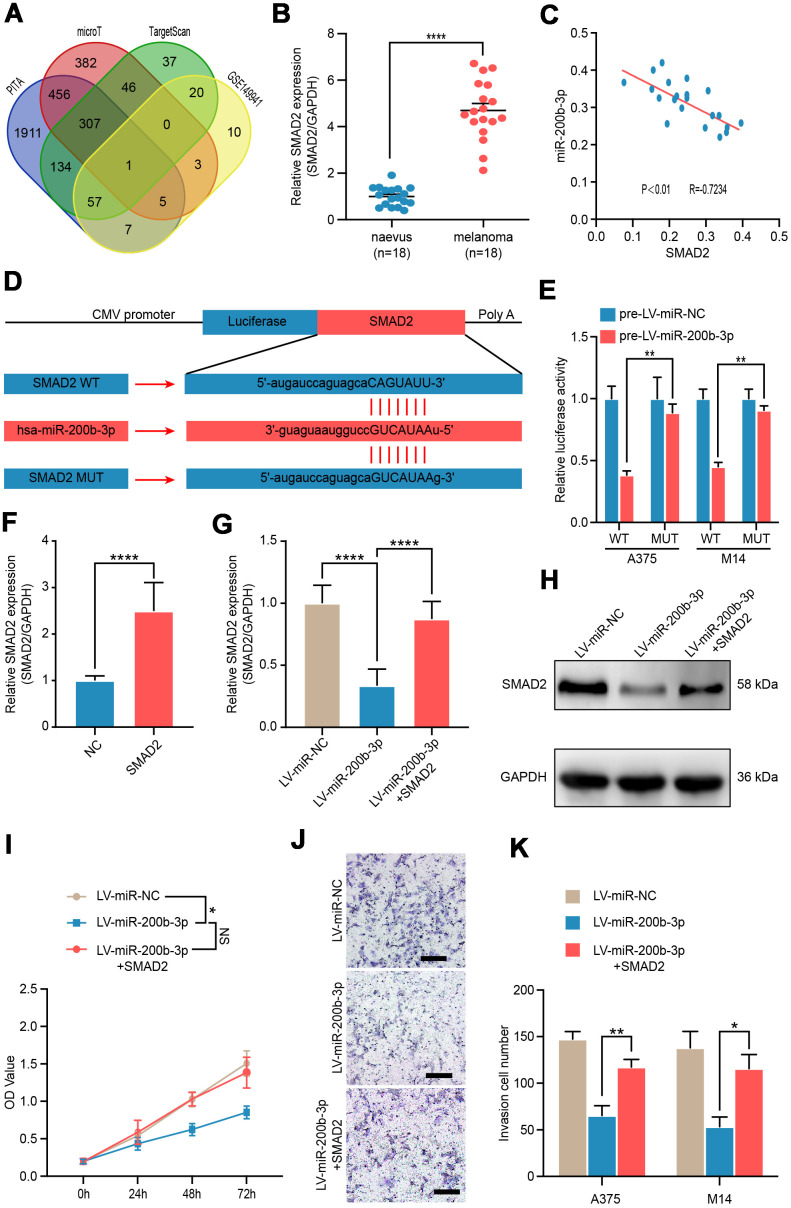
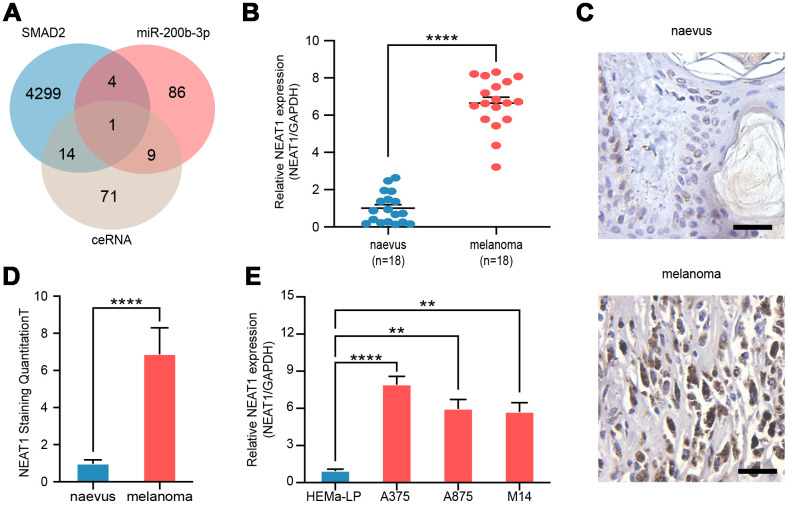
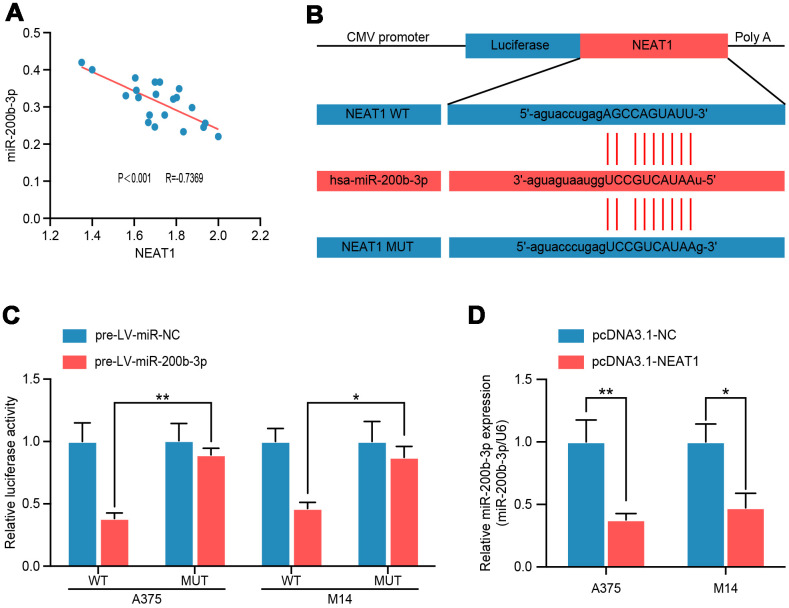
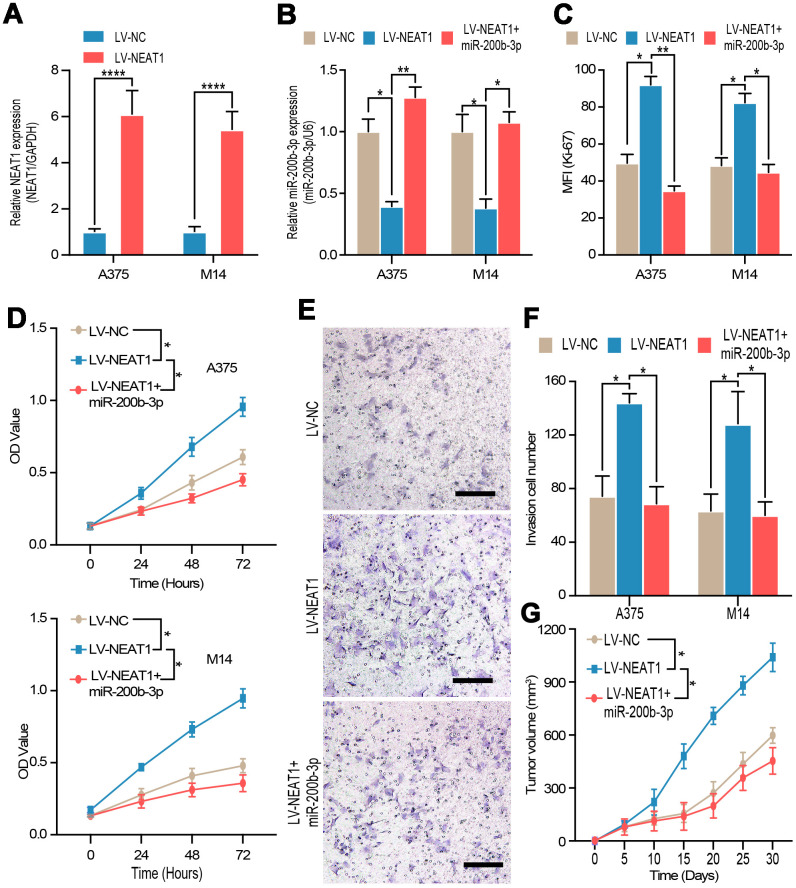
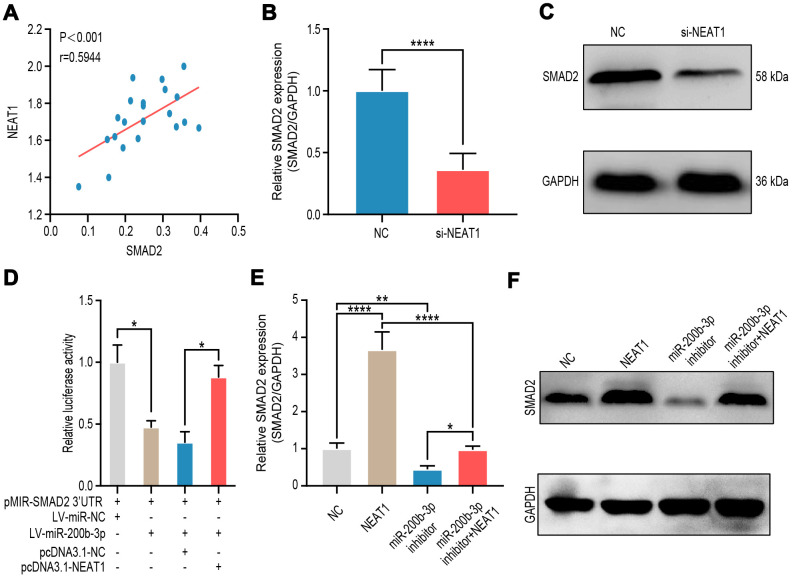
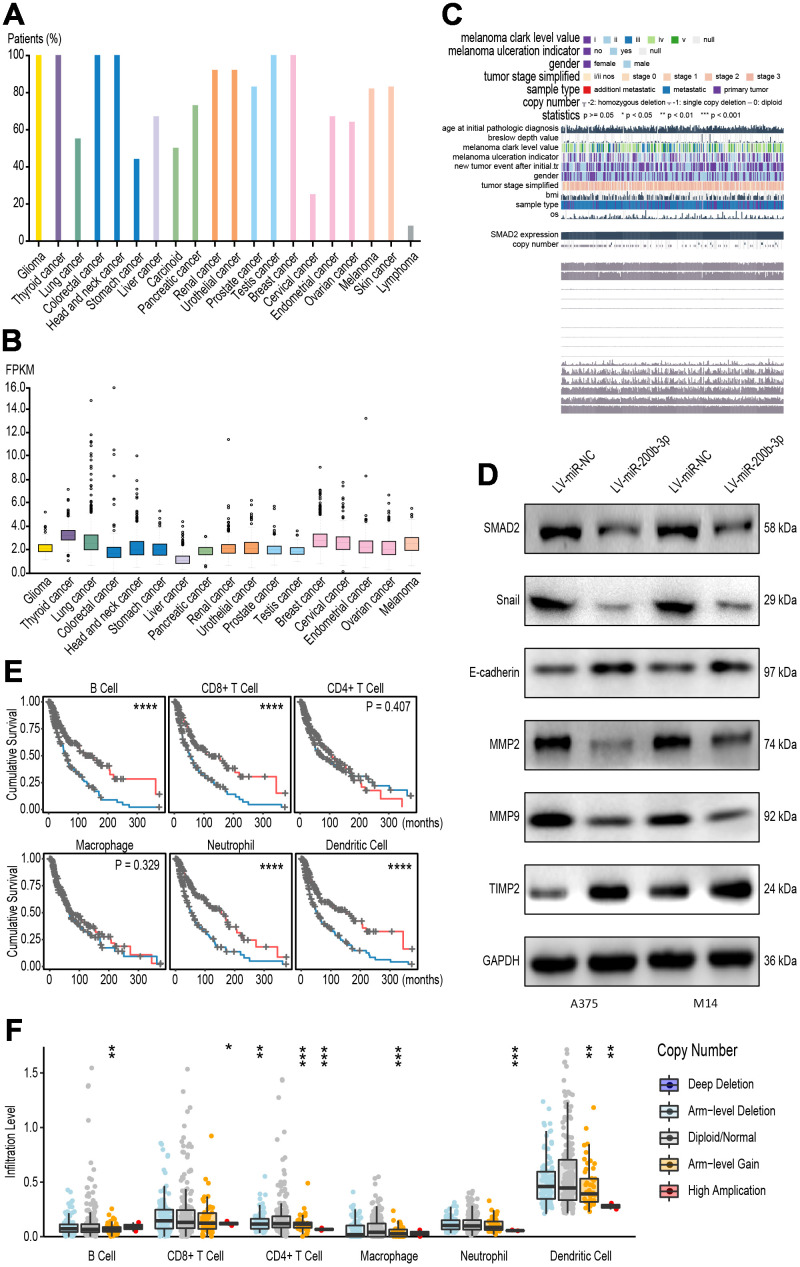
Melanoma is a skin malignancy with a high mutation frequency of genetic alterations. MicroRNA (miR)-200b-3p is involved in various cancers, while in melanoma its bio-function remains unknown. In this study, we found that miR-200b-3p was down-regulated in melanoma tissues and cell lines compared to benign nevus cells. Overexpression of miR-200b-3p significantly inhibited the proliferation and invasion of melanoma cells. According to bioinformatics analysis and sequencing data, we supposed that SMAD family member 2 (SMAD2) was the target gene and nuclear enriched abundant transcript 1 (NEAT1) was the upstream long non-coding RNA (lncRNA) of miR-200b-3p. These predictions were verified by western blotting and quantitative real-time reverse transcription PCR (RT-qPCR). Luciferase reporter assays revealed that NEAT1 up-regulated SMAD2 by directly sponging miR-200b-3p. In vitro and in vivo, we demonstrated that both NEAT1 and SMAD2 could promote the proliferation and invasion of melanoma cells, and these effects were reversed by up-regulating miR-200b-3p. In addition, NEAT1/miR-200b-3p/SMAD2 axis promoted melanoma progression by activating EMT signaling pathway and immune responses. Taken together, the NEAT1/miR-200b-3p/SMAD2 signaling pathway promotes melanoma via activation of EMT, cell invasion and is related with immune responses, which provides new insights into the molecular mechanisms and therapeutic targets for melanoma.

Keywords: EMT; NEAT1; SMAD2; melanoma; miR-200b-3p.


Conflict of interest statement

CONFLICTS OF INTEREST: The authors declare that no conflicts of interests exist.

Figures

Figure 1
Figure 1
miR-200b-3p was down-regulated in malignant melanoma and associated with poor overall survival. (A) GSE35579, GSE143231, GSE143777, GSE138710, GSE138412, GSE117666 profiles were analyzed to screen melanoma-related miRNAs. (B) Levels of miR-200b-3p between benign nevus (n=11) and malignant melanoma (n=20) tissues were analyzed according to GSE35579. (C) Levels of miR-200b-3p of clinic samples between benign nevus (n=18) and malignant melanoma tissues (n=18) were measured by RT-qPCR. (D) Levels of miR-200b-3p in melanoma cells lines (A375, A875 and M14) compared to benign epithelial cell, HEMa-LP, by RT-qPCR. (E) Kaplan–Meier survival curves for melanoma patients with high (n=56) or low (n=381) miR-200b-3p levels. (F) Kaplan–Meier survival curves for mesothelioma patients with high (n=43) or low (n=42) miR-200b-3p levels.
Figure 2
Figure 2
miR-200b-3p inhibited proliferation and invasion of melanoma cells. (A) A375 and M14 were transfected with LV-miR-NC or LV-miR-200b-3p for 24 hours and RT-qPCR was used to access miR-200b-3p levels. (B) CCK-8 assays were used to identify cell proliferation of LV-miR-200b-3p-transfected melanoma cells compared with that of control cells. (CD) Following treatment for 48 hours, Ki67 was tested by flow cytometry in LV-miR-200b-3p-transfected cell lines compared with that of control cells. (E) Tumor growth curves were calculated after A375 cells transfected with miR-200b-3p. (FG) Cell invasion was detected after cells transfected with LV-miR-200b-3p or control at 24h. Scale bars: 100 μm.
Figure 3
Figure 3
SMAD2 was verified as a functional target of miR-200b-3p. (A) Venn diagram of intersection of miRNA-200b-3p target genes predicted by bioinformatics analysis. (B) RT-qPCR was used to test expression of SMAD2 in benign nevus (n=18) and malignant melanoma tissues (n=18). (C) Spearman’s correlation analysis showed the correlation of miR-200b-3p and SMAD2 in malignant melanoma tissues (n=18). (D) Schematic view of putative miRNA-200b-3p targeting site in the Wt and Mut 3’-untranslated region (UTR) of SMAD2. (E) Luciferase reporter assay in A375 and M14 cells transfected with luciferase report plasmids containing SMAD2 3’- UTR (WT or MUT), and control miRNA or LV-miRNA-200b-3p. (F) RT-qPCR was used to test the efficiency of SMAD2 overexpression plasmid. (GH) RT-qPCR and western blot were used to evaluate the mRNA and protein levels of SMAD2, after LV-miR-200b-3p and/or SMAD2 up-regulated lentivirus respectively. (I) CCK-8 assays were conducted to identify cell proliferation after cells were transfected LV-miR-NC, LV-miR-200b-3p, or LV-miR-200b-3p+SMAD2. (JK) Cell invasion was detected after cells were transfected with LV-miR-NC, LV-miR-200b-3p, or LV-miR-200b-3p+SMAD2 or control at 24h. Scale bars: 100 μm.
Figure 4
Figure 4
NEAT1 was upregulated in melanoma cells. (A) Venn diagram of intersection of target lncRNAs predicted by bioinformatics analysis. (B) RT-qPCR was performed to measure the level of NEAT1 in benign naevus (n=18) and melanoma tissues (n=18). (C) RNAscope detection of NEAT1 expression in melanoma tissues and benign naevus. Scale bars: 100 μm. (D) Quantitative analysis of NEAT1 expression in melanoma tissues (n=18) and benign naevus (n=18). (E) RT-qPCR was performed to measure the level of NEAT1 in various melanoma cells (A375, A875 and M14) and non-cancer cells, HEMa-LP.
Figure 5
Figure 5
NEAT1 modulated miR-200b-3p through directly binding. (A) Spearman’s correlation analysis showed the correlation of miRNA-200b-3p and NEAT1 in malignant melanoma tissues(n=18) (R=−0.7369, P < 0.001). (B) Schematic view of putative miRNA-200b-3p targeting site in the Wt and MUT 3’-UTR of NEAT1. (C) Luciferase reporter assay in A375 and M14 cells transfected with luciferase report plasmids containing NEAT1 3’- UTR (WT or MUT), and pre-miR-control or pre-miR-200b-3p. (D) RT-qPCR was performed to measure the level of miR-200b-3p after cells were transfected with pcDNA3.1-NC or pcDNA3.1-NEAT1 in A375 and M14 cells.
Figure 6
Figure 6
NEAT1 regulated tumor proliferation and invasion through miR-200b-3p. (A) RT-qPCR was used to test the efficiency of NEAT1 overexpression. (B) RT-qPCR was used to detect the expression of miR-200b-3p after cells were transfected with LV-NEAT1 and/or miR-200b-3p mimic. (CD) Cell proliferation was measured by flow cytometry and CCK8 after cells were transfected with LV-NEAT1, LV-NEAT1+miR-200b-3p mimic or control (the OD value was measured at 0h, 24h, 48h and 72h). (EF) Cell invasion was detected after cells were transfected with LV-NEAT1, LV-NEAT1+ miR-200b-3p mimic or control at 12h. (G) Tumor volume was calculated after injection of A375 cells transfected with LV-NEAT1, LV-NEAT1+ miR-200b-3p mimic or control (n=8).
Figure 7
Figure 7
NEAT1 up-regulated SMAD2 expression through sponging miR-200b-3p. (A) Spearman’s correlation analysis showed the correlation of NEAT1 and SMAD2 in malignant melanoma tissues (n=18) (R=0.5944, P < 0.001). (BC) RT-qPCR and western blot were performed to assess mRNA and protein expression of SMAD2 after A375 cells were transfected si-NEAT1 plasmid or NC plasmid treated for 24 hours. (D) Luciferase reporter assay in HEK-293T cells transfected with luciferase report plasmids containing SMAD2 3’-UTR (pMIR-SMAD2 3’-UTR) and then were co-transfected with LV-miR-200b-3p or pCDNA3.1-NEAT1. miR-NC and pcDNA3.1-NC were used as control. (EF) RT-qPCR and western blot were performed to assess mRNA and protein expression of SMAD2 after A375 cells were transfected with LV-NEAT1 and/or miR-200b-3p inhibitor or control.
Figure 8
Figure 8
The NEAT1/miR-200b-3p/SMAD2 axis tended to promote melanoma by immune regulation. (A) Pan-cancer analysis was performed to test the positive rates of SMAD2 in several cancer tissues. (B) Pan-cancer analysis showed that SMAD2 was significantly increased In 17 types of cancer tissues. (C) Sequencing data and clinical characteristic was analyzed to show SMAD2 related with signaling pathways. (D) Western blot determined SMAD2-associated signaling proteins after transfection with LV-miR-200b-3p in A375 and M14 cells. (E) Kaplan-Meier plots was drawn to visualize the survival outcomes for different immune infiltrates according to a multivariable Cox proportional hazard model. (F) Immune infiltrates assays demonstrated SMAD2-related immune cells after melanoma patients were classified according to SMAD2 levels.

Similar articles

Cited by

References

    1. Sundstrøm T, Espedal H, Harter PN, Fasmer KE, Skaftnesmo KO, Horn S, Hodneland E, Mittelbronn M, Weide B, Beschorner R, Bender B, Rygh CB, Lund-Johansen M, et al.. Melanoma brain metastasis is independent of lactate dehydrogenase a expression. Neuro Oncol. 2015; 17:1374–85. 10.1093/neuonc/nov040 - DOI - PMC - PubMed
    1. Siegel RL, Miller KD, Jemal A. Cancer statistics, 2017. CA Cancer J Clin. 2017; 67:7–30. 10.3322/caac.21387 - DOI - PubMed
    1. Alexandrov LB, Nik-Zainal S, Wedge DC, Aparicio SA, Behjati S, Biankin AV, Bignell GR, Bolli N, Borg A, Børresen-Dale AL, Boyault S, Burkhardt B, Butler AP, et al., and Australian Pancreatic Cancer Genome Initiative, and ICGC Breast Cancer Consortium, and ICGC MMML-Seq Consortium, and ICGC PedBrain. Signatures of mutational processes in human cancer. Nature. 2013; 500:415–21. 10.1038/nature12477 - DOI - PMC - PubMed
    1. Berghoff AS, Preusser M. New developments in brain metastases. Ther Adv Neurol Disord. 2018; 11:1756286418785502. 10.1177/1756286418785502 - DOI - PMC - PubMed
    1. Sulaiman SA, Ab Mutalib NS, Jamal R. miR-200c regulation of metastases in ovarian cancer: potential role in epithelial and mesenchymal transition. Front Pharmacol. 2016; 7:271. 10.3389/fphar.2016.00271 - DOI - PMC - PubMed

Publication types

MeSH terms