. 2020 Nov 13;21(22):8551.
doi: 10.3390/ijms21228551.

The Importance of Hypoxia-Inducible Factors (HIF-1 and HIF-2) for the Pathophysiology of Inflammatory Bowel Disease

Affiliations

The Importance of Hypoxia-Inducible Factors (HIF-1 and HIF-2) for the Pathophysiology of Inflammatory Bowel Disease

Evelyn L Kerber et al. Int J Mol Sci. .

Abstract

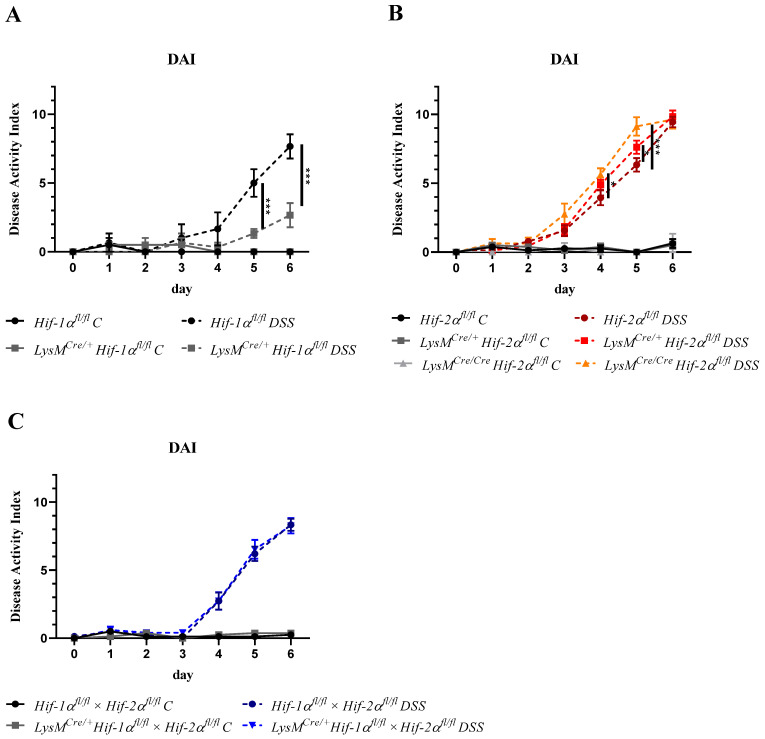
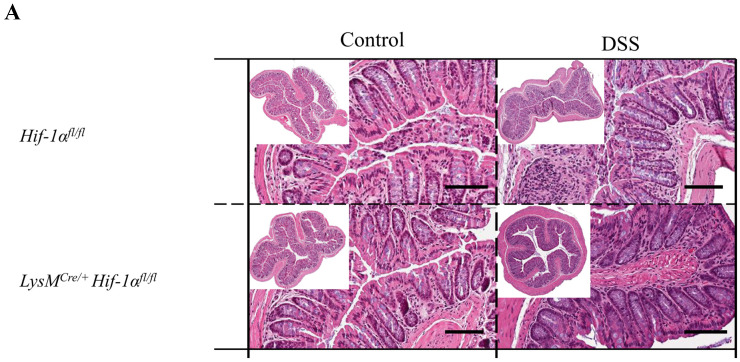
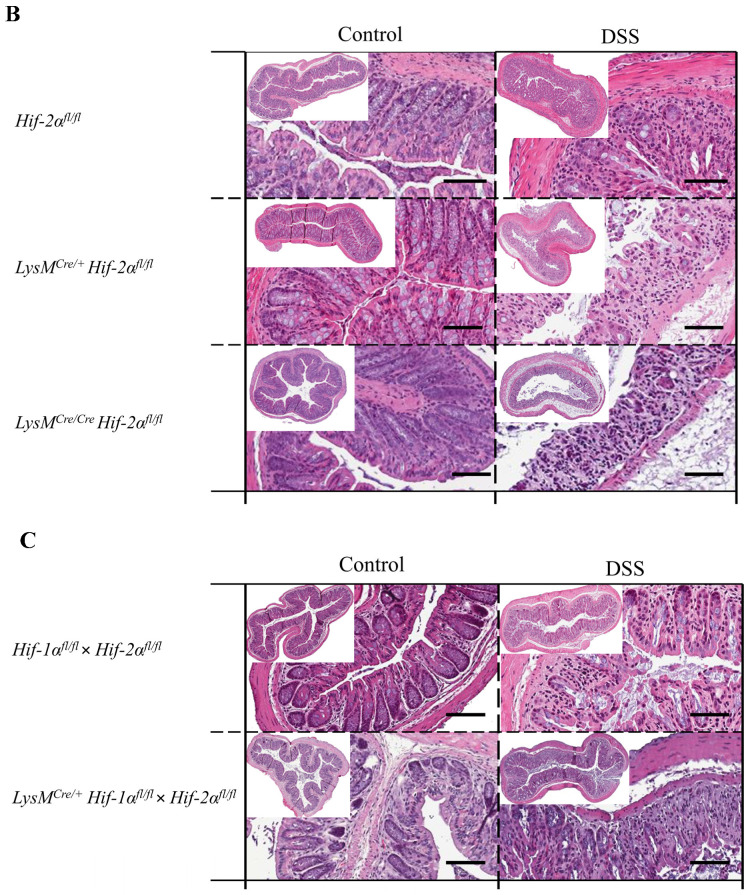
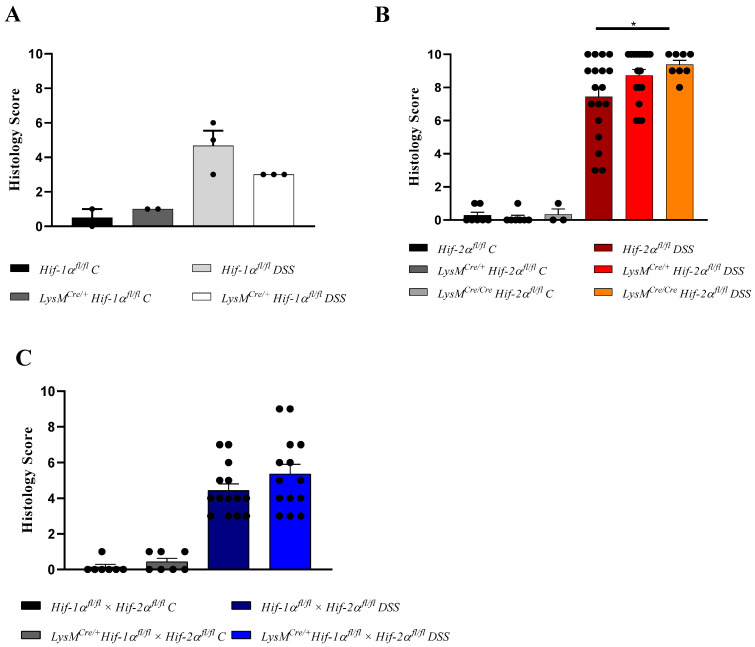
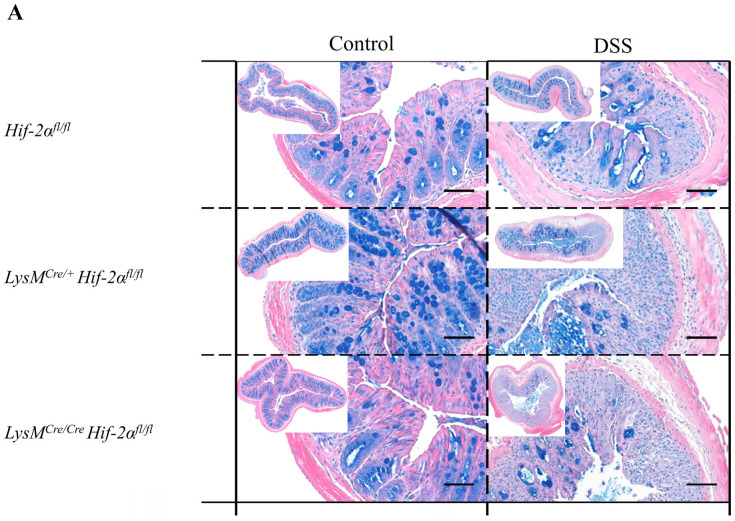
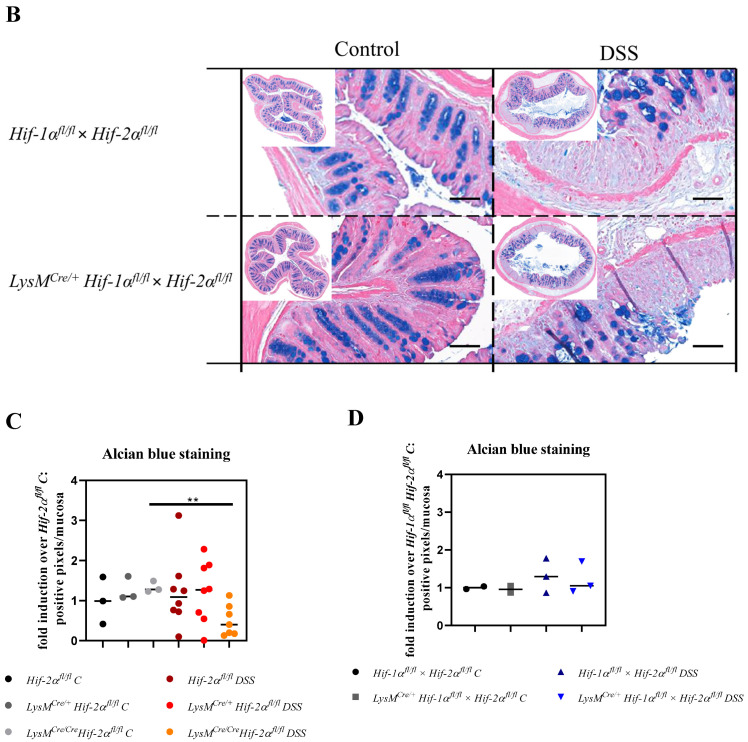
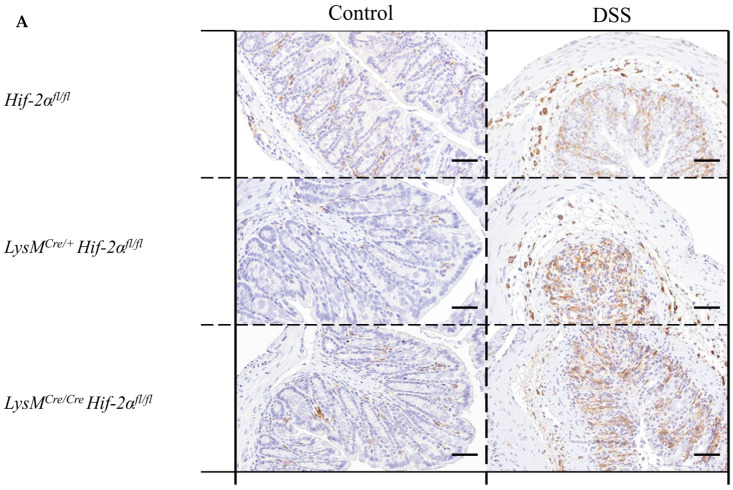
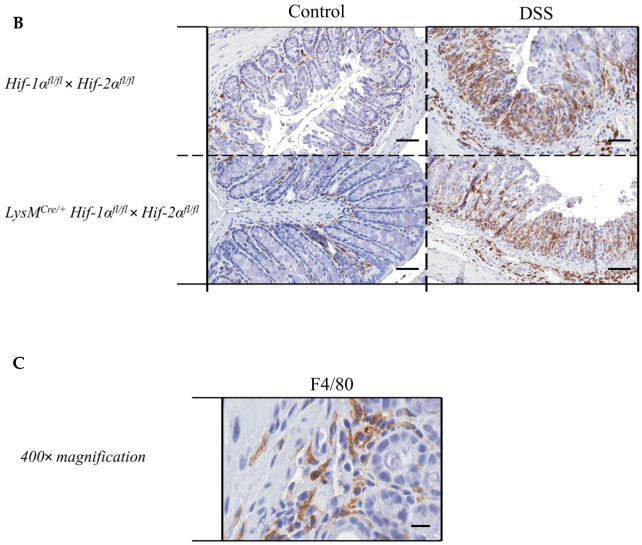
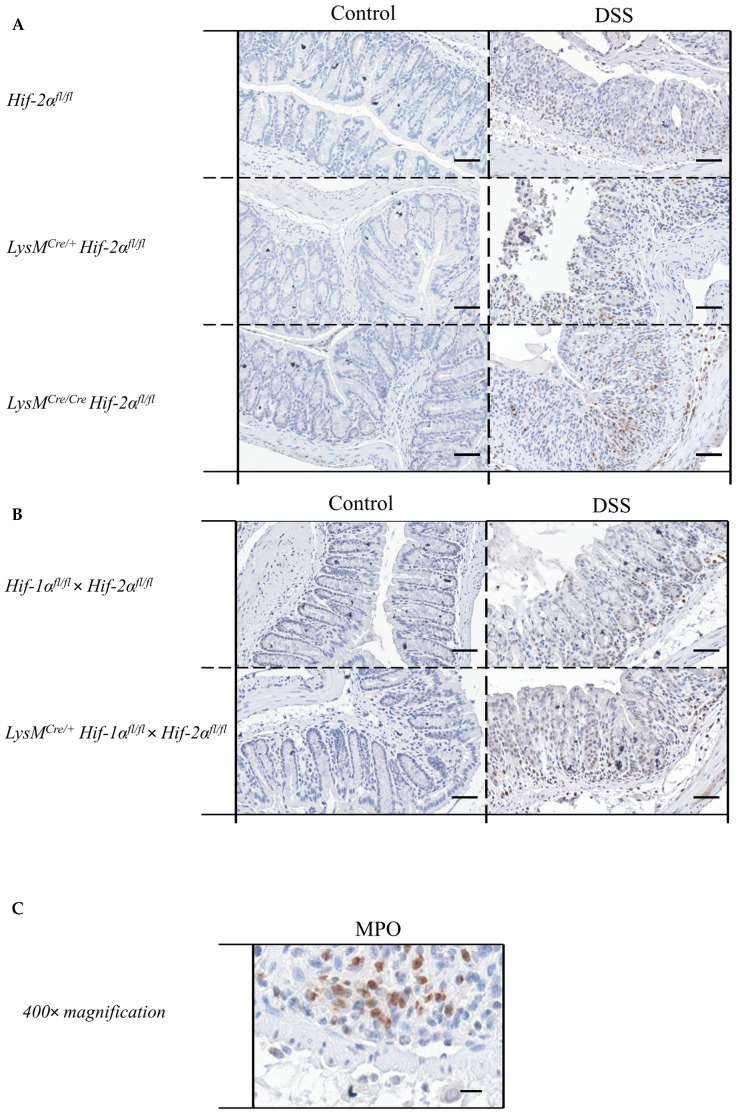
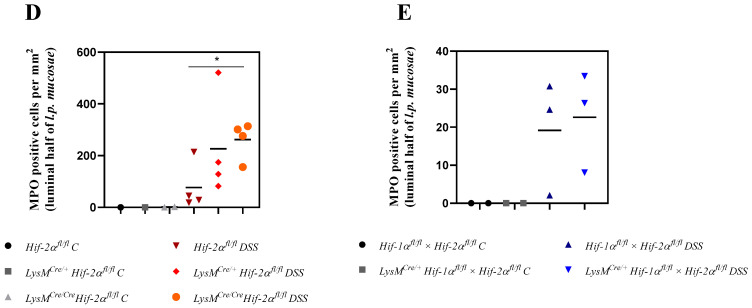
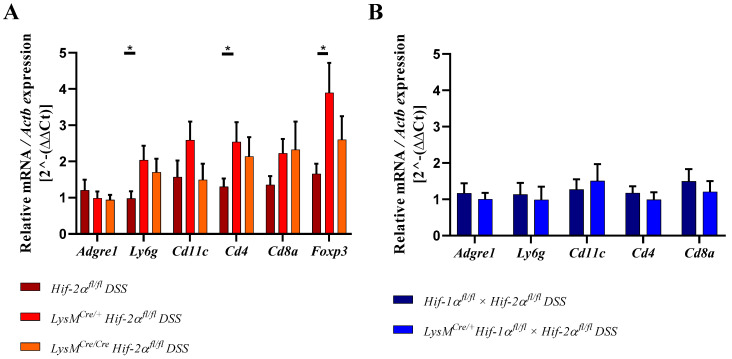
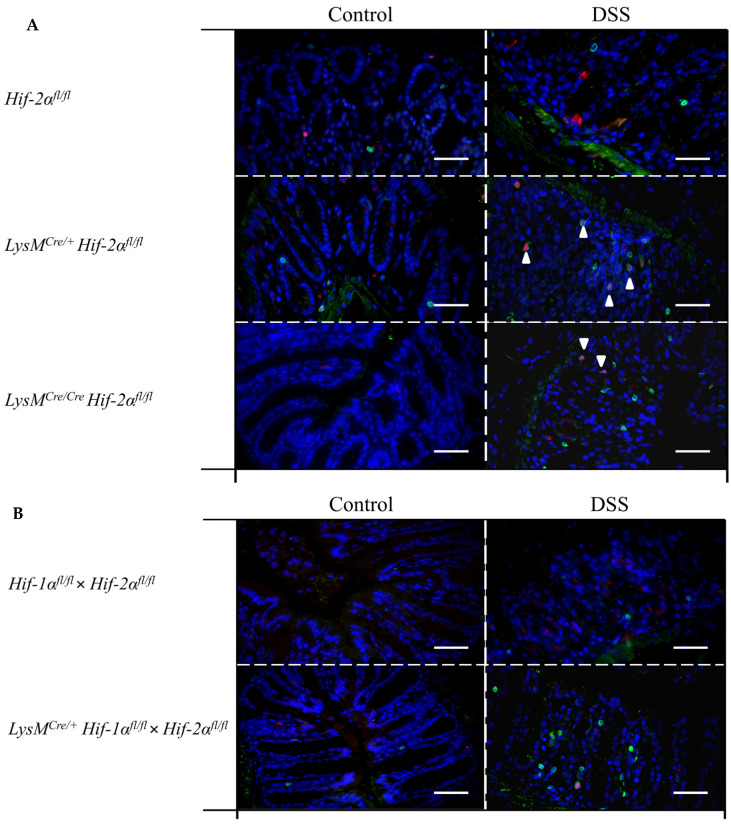
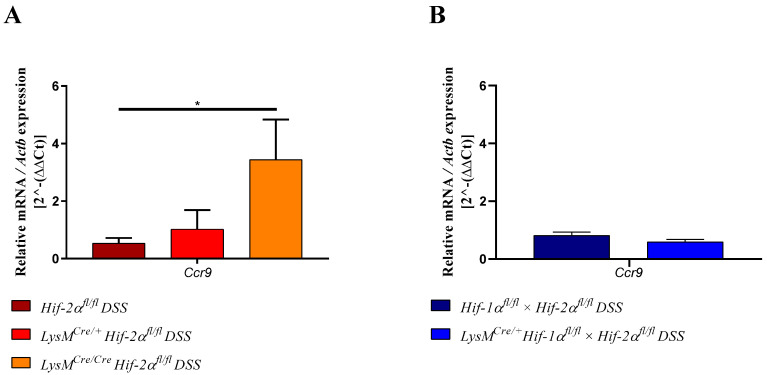
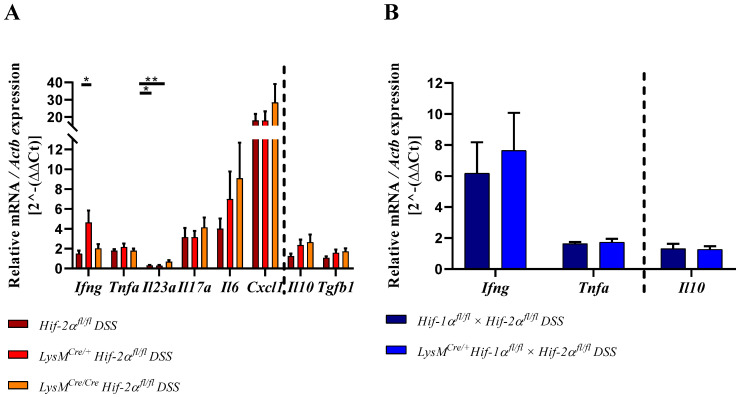
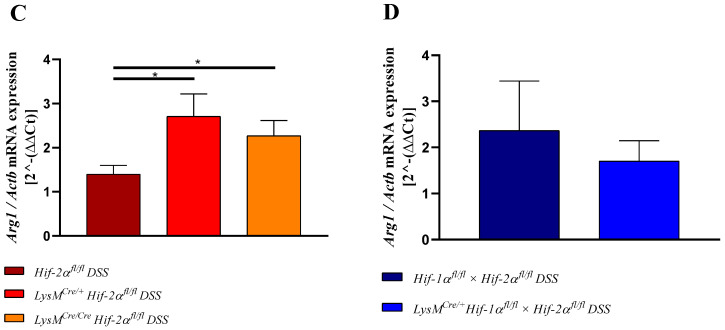
(1) Background: Hypoxia is a common feature of inflammation when hypoxia inducible factors (HIFs) adapt cells to conditions of low oxygen tension and inflammation. We studied the role of HIF-1 and HIF-2 in cells of the myeloid lineage in a mouse model of acute colitis. (2) Methods: Mice with and without a conditional knockout for either Hif-1a or Hif-2a or Hif-1a and Hif-2a in cells of the myeloid lineage were treated with 2.5% dextran sodium sulfate (DSS) for 6 days to induce an acute colitis. We analyzed the course of inflammation with respect to macroscopic (disease activity index) and microscopic (histology score and immunohistochemical staining of immune cells) parameters and quantified the mRNA expression of cytokines and chemokines in the colon and the mesenteric lymph nodes. (3) Results: A conditional knockout of myeloid Hif-1a ameliorated whereas the knockout of Hif-2a aggravated murine DSS colitis by increased recruitment of neutrophils to deeper layers of the colon. This led to higher expression of Il6, Ifng, Cd11c, Cd4, and Cd8 in the colon but also induced anti-inflammatory mediators such as Foxp3 and Il10. A conditional knockout of Hif-1a and Hif-2a did not show any differences compared to wildtype mice. (4) Conclusions: Myeloid HIF-1α and HIF-2α play opposing roles in acute DSS colitis. Thus, not only a cell type specific, but also the isoform specific modulation of HIFs needs to be addressed in attempts to modify HIF for therapeutic purposes.

Keywords: HIF-1; HIF-2; IBD; inflammation.


Conflict of interest statement

The authors declare no conflict of interest.

Figures

Figure 1
Figure 1
Myeloid HIF-1α knockout ameliorated whereas myeloid HIF-2α knockout aggravated colitis. Daily recording of the disease activity index (DAI) value with separate presentation for the different animal strains with and without dextran sodium sulfate (DSS) treatment. Statistical analysis was performed with a 2-way ANOVA (mean values ± SEM; (A): n(C) = 2, n(DSS) = 3; (B): n(C) = 3 (LysMCre/Cre Hif-2αfl/fl)/8 (Hif-2αfl/fl; LysMCre/+ Hif-2αfl/fl), n(DSS) = 8 (LysMCre/Cre Hif-2αfl/fl)/18 (Hif-2αfl/fl; LysMCre/+ Hif-2αfl/fl); and (C): n(C) = 7, n(DSS) = 14). *: p < 0.05; ***: p < 0.001.
Figure 2
Figure 2
Myeloid knockout of HIF-1α leads to low tissue destruction, while myeloid knockout of HIF-2α increased it. Exemplary presentation of H&E-stained colon tissue sections of (A) Hif-1αfl/fl, LysMCre/+ Hif-1αfl/fl animals, (B) Hif-2αfl/fl, LysMCre/+ Hif-2αfl/fl and LysMCre/Cre Hif-2αfl/fl animals, and (C) Hif-1αfl/fl × Hif-2αfl/fl and LysMCre/+ Hif-1αfl/fl × Hif-2αfl/fl animals after DSS treatment and the control group. Tissue sections from DSS-treated LysMCre/Cre Hif-2αfl/fl animals showed the highest structural damage of tissue. Tissue sections from DSS-treated LysMCre/+ Hif-1αfl/fl animals showed the least structural damage. A: n(Control) = 2, n(DSS) = 3; B: n(Control) = 3 (LysMCre/Cre Hif-2αfl/fl)/8 (Hif-2αfl/fl; LysMCre/+ Hif-2αfl/fl), n(DSS) = 8 (LysMCre/Cre Hif-2αfl/fl)/18 (Hif-2αfl/fl, LysMCre/+ Hif-2αfl/fl); and C: n(Control) = 7, n(DSS) = 14. Magnification overview image: 100×; magnification detail image: 200×; and scale bar: 100 µm.
Figure 2
Figure 2
Myeloid knockout of HIF-1α leads to low tissue destruction, while myeloid knockout of HIF-2α increased it. Exemplary presentation of H&E-stained colon tissue sections of (A) Hif-1αfl/fl, LysMCre/+ Hif-1αfl/fl animals, (B) Hif-2αfl/fl, LysMCre/+ Hif-2αfl/fl and LysMCre/Cre Hif-2αfl/fl animals, and (C) Hif-1αfl/fl × Hif-2αfl/fl and LysMCre/+ Hif-1αfl/fl × Hif-2αfl/fl animals after DSS treatment and the control group. Tissue sections from DSS-treated LysMCre/Cre Hif-2αfl/fl animals showed the highest structural damage of tissue. Tissue sections from DSS-treated LysMCre/+ Hif-1αfl/fl animals showed the least structural damage. A: n(Control) = 2, n(DSS) = 3; B: n(Control) = 3 (LysMCre/Cre Hif-2αfl/fl)/8 (Hif-2αfl/fl; LysMCre/+ Hif-2αfl/fl), n(DSS) = 8 (LysMCre/Cre Hif-2αfl/fl)/18 (Hif-2αfl/fl, LysMCre/+ Hif-2αfl/fl); and C: n(Control) = 7, n(DSS) = 14. Magnification overview image: 100×; magnification detail image: 200×; and scale bar: 100 µm.
Figure 3
Figure 3
Myeloid knockout of HIF-1α led to a low colon histology score, while myeloid knockout of HIF-2α increased it. H&E-stained sections of the colon of Hif-1αfl/fl, LysMCre/+ Hif-1αfl/fl animals (A), Hif-2αfl/fl, LysMCre/+ Hif-2αfl/fl and LysMCre/Cre Hif-2αfl/fl animals (B), and Hif-1αfl/fl × Hif-2αfl/fl and LysMCre/+ Hif-1αfl/fl × Hif-2αfl/fl animals (C) with and without DSS treatment were evaluated by a histology score (for parameters see Table 2). The DSS-treated LysMCre/Cre Hif-2αfl/fl animals showed the highest score and DSS-treated LysMCre/+ Hif-1αfl/fl animals had the lowest score. Statistical analysis was performed with an unpaired t-test. Mean values ± SEM; A: n(C) = 2, n(DSS) = 3; B: n(C) = 3 (LysMCre/Cre Hif-2αfl/fl)/8 (Hif-2αfl/fl, LysMCre/+ Hif-2αfl/fl), n(DSS) = 8 (LysMCre/Cre Hif-2αfl/fl)/18 (Hif-2αfl/fl, LysMCre/+ Hif-2αfl/fl); and C: n(C) = 7, n(DSS) = 14. Each black dot represents the score of a single animal. *: p < 0.05.
Figure 4
Figure 4
Reduced mucin production after tissue destruction. Exemplary presentation of alcian blue-stained colon tissue sections of (A) Hif-2αfl/fl, LysMCre/+ Hif-2αfl/fl and LysMCre/Cre Hif-2αfl/fl animals and (B) Hif-1αfl/fl × Hif-2αfl/fl and LysMCre/+ Hif-1αfl/fl × Hif-2αfl/fl animals with and without DSS treatment and quantification of histological data (C,D). No positive alcian blue staining was observed in damaged colon areas. Statistical analysis was performed with an unpaired t-test; (A): n(Control) = 3 (LysMCre/Cre Hif-2αfl/fl)/5 (Hif-2αfl/fl, LysMCre/+ Hif-2αfl/fl), n(DSS) = 8 (LysMCre/Cre Hif-2αfl/fl)/12 (Hif-2αfl/fl, LysMCre/+ Hif-2αfl/fl), (B): n(Control) = 2, n(DSS) = 3. counterstaining: eosin. Magnification overview image: 100×; magnification detail image: 200×; and scale bar: 100 µm, (C,D): every indicated spot depicts the quantitative analysis of a complete cross section of one colon. **: p < 0.01.
Figure 4
Figure 4
Reduced mucin production after tissue destruction. Exemplary presentation of alcian blue-stained colon tissue sections of (A) Hif-2αfl/fl, LysMCre/+ Hif-2αfl/fl and LysMCre/Cre Hif-2αfl/fl animals and (B) Hif-1αfl/fl × Hif-2αfl/fl and LysMCre/+ Hif-1αfl/fl × Hif-2αfl/fl animals with and without DSS treatment and quantification of histological data (C,D). No positive alcian blue staining was observed in damaged colon areas. Statistical analysis was performed with an unpaired t-test; (A): n(Control) = 3 (LysMCre/Cre Hif-2αfl/fl)/5 (Hif-2αfl/fl, LysMCre/+ Hif-2αfl/fl), n(DSS) = 8 (LysMCre/Cre Hif-2αfl/fl)/12 (Hif-2αfl/fl, LysMCre/+ Hif-2αfl/fl), (B): n(Control) = 2, n(DSS) = 3. counterstaining: eosin. Magnification overview image: 100×; magnification detail image: 200×; and scale bar: 100 µm, (C,D): every indicated spot depicts the quantitative analysis of a complete cross section of one colon. **: p < 0.01.
Figure 5
Figure 5
Macrophages without functional HIF-2α showed a similar migration pattern compared to wildtype cells. Exemplary presentation of F4/80-stained colon tissue sections of (A) Hif-2αfl/fl, LysMCre/+ Hif-2αfl/fl and LysMCre/Cre Hif-2αfl/fl animals, and (B) Hif-1αfl/fl × Hif-2αfl/fl and LysMCre/+ Hif-1αfl/fl × Hif-2αfl/fl animals with and without DSS treatment and an exemplary high-resolution image that shows the specificity of the staining (C). After DSS treatment, increased numbers of F4/80-positive cells were observed in the lamina propria mucosae and tela submucosa in all tissue sections. (A): n(Control) = 3 (LysMCre/Cre Hif-2αfl/fl)/5 (Hif-2αfl/fl, LysMCre/+ Hif-2αfl/fl), n(DSS) = 8 (LysMCre/Cre Hif-2αfl/fl)/12 (Hif-2αfl/fl, LysMCre/+ Hif-2αfl/fl); (B): n(Control) = 7, n(DSS) = 14. (A) and (B): magnification 200×, scale bar: 100 µm; (C): magnification 400×, scale bar: 50 µm.
Figure 5
Figure 5
Macrophages without functional HIF-2α showed a similar migration pattern compared to wildtype cells. Exemplary presentation of F4/80-stained colon tissue sections of (A) Hif-2αfl/fl, LysMCre/+ Hif-2αfl/fl and LysMCre/Cre Hif-2αfl/fl animals, and (B) Hif-1αfl/fl × Hif-2αfl/fl and LysMCre/+ Hif-1αfl/fl × Hif-2αfl/fl animals with and without DSS treatment and an exemplary high-resolution image that shows the specificity of the staining (C). After DSS treatment, increased numbers of F4/80-positive cells were observed in the lamina propria mucosae and tela submucosa in all tissue sections. (A): n(Control) = 3 (LysMCre/Cre Hif-2αfl/fl)/5 (Hif-2αfl/fl, LysMCre/+ Hif-2αfl/fl), n(DSS) = 8 (LysMCre/Cre Hif-2αfl/fl)/12 (Hif-2αfl/fl, LysMCre/+ Hif-2αfl/fl); (B): n(Control) = 7, n(DSS) = 14. (A) and (B): magnification 200×, scale bar: 100 µm; (C): magnification 400×, scale bar: 50 µm.
Figure 6
Figure 6
Neutrophils without functional HIF-2α showed a higher migration pattern compared to wildtype cells. Exemplary presentation of MPO-stained colon tissue sections of (A) Hif-2αfl/fl, LysMCre/+ Hif-2αfl/fl and LysMCre/Cre Hif-2αfl/fl animals, and (B) Hif-1αfl/fl × Hif-2αfl/fl and LysMCre/+ Hif-1αfl/fl × Hif-2αfl/fl animals with and without DSS treatment and an exemplary high-resolution image that shows the specificity of the staining (C). Quantification of histological data (D,E) show no significant differences. Statistical analysis was performed with an unpaired t-test; (A): n(Control) = 3 (LysMCre/Cre Hif-2αfl/fl)/8 (Hif-2αfl/fl, LysMCre/+ Hif-2αfl/fl), n(DSS) = 8 (LysMCre/Cre Hif-2αfl/fl)/18 (Hif-2αfl/fl, LysMCre/+ Hif-2αfl/fl); (B): n(Control) = 7, n(DSS) = 14. (A) and (B): magnification 200×, scale bar: 100 µm; (C): magnification 400×, scale bar: 50 µm. (D,E): every indicated spot depicts the quantitative analysis of 4 sections (400× magnification) per colon. *: p < 0.05.
Figure 6
Figure 6
Neutrophils without functional HIF-2α showed a higher migration pattern compared to wildtype cells. Exemplary presentation of MPO-stained colon tissue sections of (A) Hif-2αfl/fl, LysMCre/+ Hif-2αfl/fl and LysMCre/Cre Hif-2αfl/fl animals, and (B) Hif-1αfl/fl × Hif-2αfl/fl and LysMCre/+ Hif-1αfl/fl × Hif-2αfl/fl animals with and without DSS treatment and an exemplary high-resolution image that shows the specificity of the staining (C). Quantification of histological data (D,E) show no significant differences. Statistical analysis was performed with an unpaired t-test; (A): n(Control) = 3 (LysMCre/Cre Hif-2αfl/fl)/8 (Hif-2αfl/fl, LysMCre/+ Hif-2αfl/fl), n(DSS) = 8 (LysMCre/Cre Hif-2αfl/fl)/18 (Hif-2αfl/fl, LysMCre/+ Hif-2αfl/fl); (B): n(Control) = 7, n(DSS) = 14. (A) and (B): magnification 200×, scale bar: 100 µm; (C): magnification 400×, scale bar: 50 µm. (D,E): every indicated spot depicts the quantitative analysis of 4 sections (400× magnification) per colon. *: p < 0.05.
Figure 7
Figure 7
Myeloid knockout of HIF-2α increased the numbers of neutrophils and T-cells in inflamed colon tissue. The expression of Adgre1, Ly6g, Cd11c, Cd4, Cd8a, and Foxp3 were quantitatively determined by qPCR in the colonic tissue of DSS-treated animals. After 6 days of DSS treatment an increased expression of Ly6g, Cd4, Cd8a, and Foxp3 were observed in RNA samples from DSS-treated LysMCre/+ Hif-2αfl/fl and LysMCre/Cre Hif-2αfl/f animals. Statistical analysis was performed with an unpaired t-test (mean values ± SEM; (A): n = 6 (LysMCre/Cre Hif-2αfl/f)/15 (Hif-2αfl/fl, LysMCre/+ Hif-2αfl/fl); (B): n = 14). All data were normalized to the untreated wildtype control. Gene expression of untreated animals did not differ markedly from the respective wildtype control and is depicted in suppl. Figure S4. *: p < 0.05.
Figure 8
Figure 8
Myeloid knockout of HIF-2α increased the numbers of T-cells and Treg cells in inflamed colon tissue. Exemplary presentation of CD3- (green, surface staining) and FoxP3- (red, nuclear staining) stained colon tissue sections of (A) Hif-2αfl/fl, LysMCre/+ Hif-2αfl/fl and LysMCre/Cre Hif-2αfl/fl animals, and (B) Hif-1αfl/fl × Hif-2αfl/fl and LysMCre/+ Hif-1αfl/fl × Hif-2αfl/fl animals with and without DSS treatment. (A,B): n(Control) = 2; n(DSS) = 4 (magnification 200×, scale bar: 100 µm). Marked cells (arrows) are double-positive for CD3 and FoxP3.
Figure 9
Figure 9
Myeloid knockout of HIF-2α induced the migration of lymphocytes towards the gut. The expression of Ccr9 was quantitatively determined by qPCR in mesenteric lymph nodes of DSS-treated animals. After 6 days of DSS treatment a significantly increased expression of Ccr9 was observed in RNA samples from DSS- LysMCre/Cre Hif-2αfl/fl animals. Statistical analysis was performed with an unpaired t-test (mean values ± SEM; (A): n = 7 (LysMCre/Cre Hif-2αfl/fl)/10 (Hif-2αfl/fl; LysMCre/+ Hif-2αfl/fl); (B) n = 7/8). All data were normalized to the untreated wildtype control. Gene expression of untreated animals did not differ markedly from the respective wildtype control and is depicted in suppl. Figure S5. *: p < 0.05.
Figure 10
Figure 10
Myeloid knockout of HIF-2α induces both the pro- and the anti-inflammatory cytokine response during inflammation. Figure 10 (A,B) shows the expression of pro- (left of the dotted line) and antiinflammatory (right of the dotted line) cytokines. Cytokines were quantified by qPCR in the colonic tissue of DSS-treated animals. Figure 10 (C,D) shows the expression of Arg1 quantified by qPCR. Statistical analysis was performed with an unpaired t-test (mean values ± SEM; A: n =6 (LysMCre/Cre Hif-2αfl/fl)/15 (Hif-2αfl/fl; LysMCre/+ Hif-2αfl/fl); B: n = 14). All data were normalized to the untreated wildtype control. Gene expression of untreated animals did not differ markedly from the respective wildtype control and is depicted in suppl. Figure S6. *: p < 0.05; **: p < 0.01.
Figure 10
Figure 10
Myeloid knockout of HIF-2α induces both the pro- and the anti-inflammatory cytokine response during inflammation. Figure 10 (A,B) shows the expression of pro- (left of the dotted line) and antiinflammatory (right of the dotted line) cytokines. Cytokines were quantified by qPCR in the colonic tissue of DSS-treated animals. Figure 10 (C,D) shows the expression of Arg1 quantified by qPCR. Statistical analysis was performed with an unpaired t-test (mean values ± SEM; A: n =6 (LysMCre/Cre Hif-2αfl/fl)/15 (Hif-2αfl/fl; LysMCre/+ Hif-2αfl/fl); B: n = 14). All data were normalized to the untreated wildtype control. Gene expression of untreated animals did not differ markedly from the respective wildtype control and is depicted in suppl. Figure S6. *: p < 0.05; **: p < 0.01.

Similar articles

Cited by

References

    1. Dignass A., Schulze H., Preiß J.C., Zeitz M., Aust D.E., Barretton G., Autschbach F., Ballauff A., Bokemeyer B., Fichtner-Feigl S., et al. Updated German guideline on diagnosis and treatment of ulcerative colitis, 2011. Z. Gastroenterol. 2011;49:1276. doi: 10.1055/s-0031-1281666. - DOI - PubMed
    1. Alatab S., Sepanlou S.G., Ikuta K., Vahedi H., Bisignano C., Safiri S., Sadeghi A., Nixon M.R., Abdoli A., Abolhassani H., et al. The global, regional, and national burden of inflammatory bowel disease in 195 countries and territories, 1990–2017: A systematic analysis for the Global Burden of Disease Study 2017. Lancet Gastroenterol. Hepatol. 2020;5:17–30. doi: 10.1016/S2468-1253(19)30333-4. - DOI - PMC - PubMed
    1. Ekbom A., Helmick C., Zack M., Adami H.O. Ulcerative colitis and colorectal cancer: A Population-Based Study. N. Engl. J. Med. 1990;323:1228–1233. doi: 10.1056/NEJM199011013231802. - DOI - PubMed
    1. Hamilton S.R. Colorectal carcinoma in patients with Crohn’s Disease. Gastroenterology. 1985;89:398–407. doi: 10.1016/0016-5085(85)90343-9. - DOI - PubMed
    1. Fakhoury M., Negrulj R., Mooranian A., Al-Salami H. Inflammatory bowel disease: Clinical aspects and treatments. J. Inflamm. Res. 2014;7:113. doi: 10.2147/JIR.S65979. - DOI - PMC - PubMed

MeSH terms

LinkOut - more resources