

Point-of-Decision Prompts Increase Dietary Fiber Content of Consumers' Food Choices in an Online Grocery Shopping Simulation
- PMID: 33202916
- PMCID: PMC7697633
- DOI: 10.3390/nu12113487
Point-of-Decision Prompts Increase Dietary Fiber Content of Consumers' Food Choices in an Online Grocery Shopping Simulation
Abstract
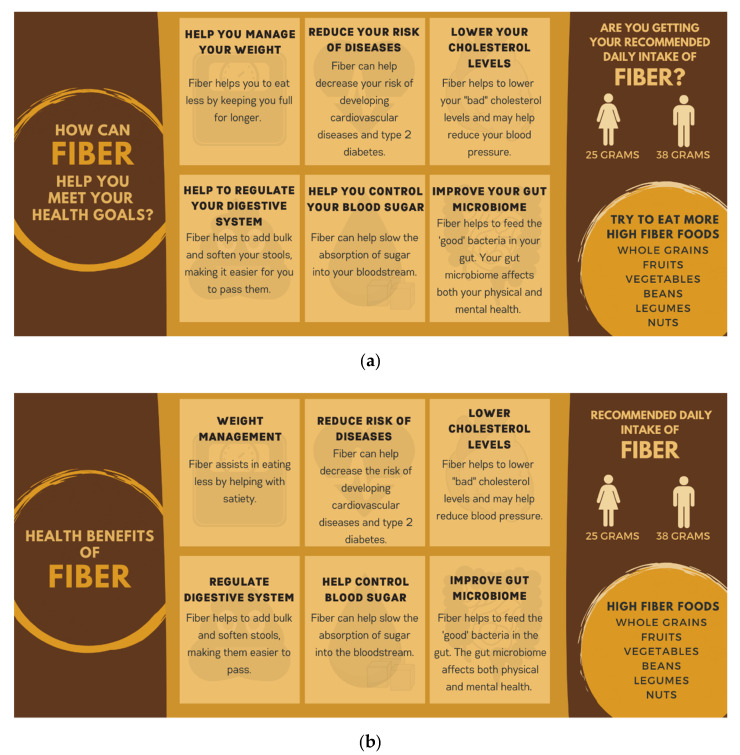
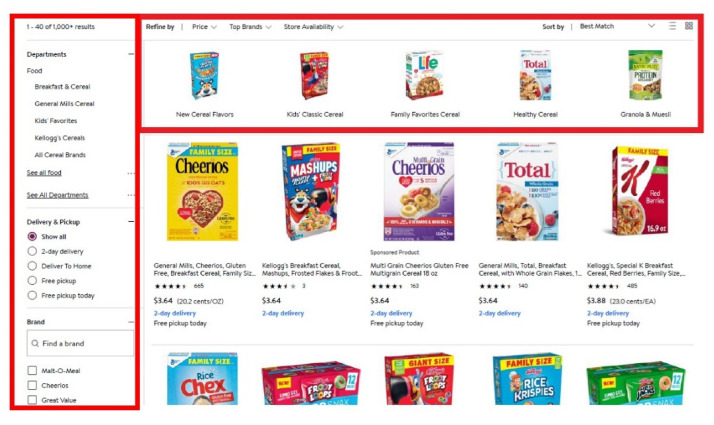
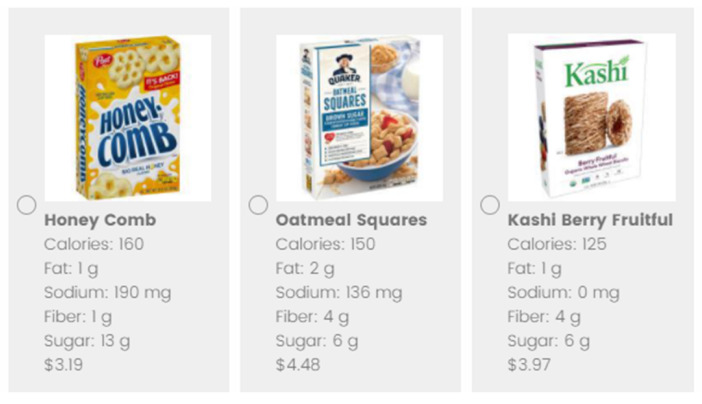
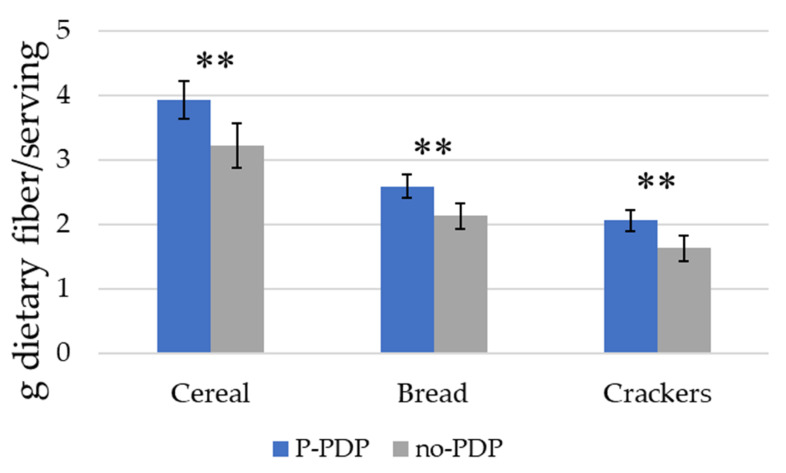
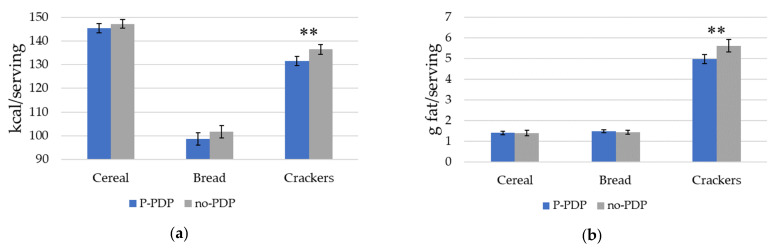
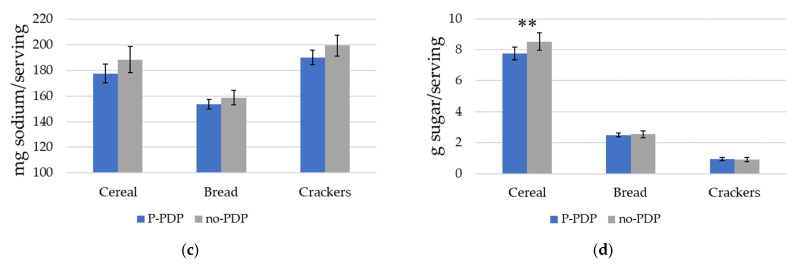
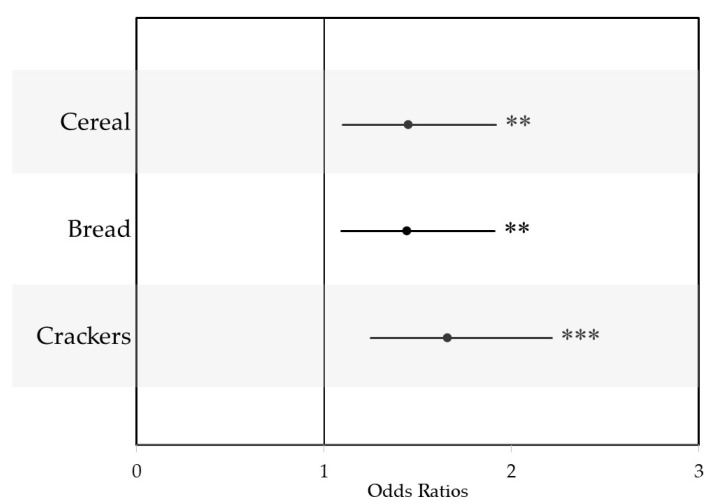
Only 5% of Americans consume the recommended amount of dietary fiber. In an online simulated shopping experiment, we examined whether a fiber-focused point-of-decision prompt (PDP) would influence consumers to choose food products that were higher in this important nutrient. We hypothesized that participants exposed to the dietary fiber PDP would choose products with more dietary fiber/serving than those who were not exposed to the PDP. The experiment was completed by 753 participants. Participants were randomly assigned to a condition in which they were not exposed to a PDP (the no-PDP condition), a personalized PDP, or PDP without personalization. Choices in the two PDP conditions were not significantly different. Therefore, the PDP conditions were pooled together into one condition and compared with control participants that did not receive the fiber-focused PDP. Across the three product categories, participants in the PDP condition chose products that had a greater amount of dietary fiber/serving (cereal: 22% increase; bread: 22% increase; crackers: 26% increase; p < 0.01) and products that had a greater healthiness rating (cereals (odds ratio (OR): 1.45, 95% confidence interval (95% CI): (1.10, 1.92)), bread (OR: 1.44, 95% CI: (1.09, 1.91)), and crackers (OR: 1.66, 95% CI: (1.25, 2.21)). Overall, the fiber PDP influenced participants to choose healthier products that contained greater amounts of dietary fiber.
Keywords: diet quality; fiber; food choice; nutrition information; online grocery store; point-of-decision prompt.
Conflict of interest statement
The authors declare no conflict of interest.
Figures
References
-
- Murphy S.L., Kochanek K.D., Xu J., Arias E. Mortality in the United States, 2014. NCH Data Brief. 2015;229:8. - PubMed
-
- Jardim T.V., Mozaffarian D., Abrahams-Gessel S., Sy S., Lee Y., Liu J., Huang Y., Rehm C., Wilde P., Micha R., et al. Cardiometabolic disease costs associated with suboptimal diet in the United States: A cost analysis based on a microsimulation model. PLoS Med. 2019;16:e1002981. doi: 10.1371/journal.pmed.1002981. - DOI - PMC - PubMed
-
- Hoy M.K., Goldman J. Dietary fiber intake of the U.S. population: What We Eat in America, NHANES 2009–2010. Food Surv. Res. Group Diet. Data Brief. 2014;12:6.
-
- Mayo Clinic Dietary Fiber: Essential for a Healthy Diet. [(accessed on 5 July 2020)]; Available online: https://www.mayoclinic.org/healthy-lifestyle/nutrition-and-healthy-eatin....
MeSH terms
Substances
Grants and funding
LinkOut - more resources
Full Text Sources
Medical
