

Effects of Allicin on Pathophysiological Mechanisms during the Progression of Nephropathy Associated to Diabetes
- PMID: 33203103
- PMCID: PMC7697950
- DOI: 10.3390/antiox9111134
Effects of Allicin on Pathophysiological Mechanisms during the Progression of Nephropathy Associated to Diabetes
Abstract
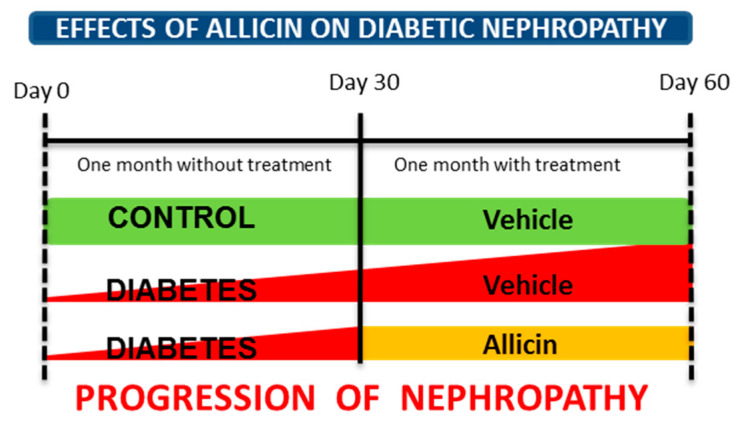
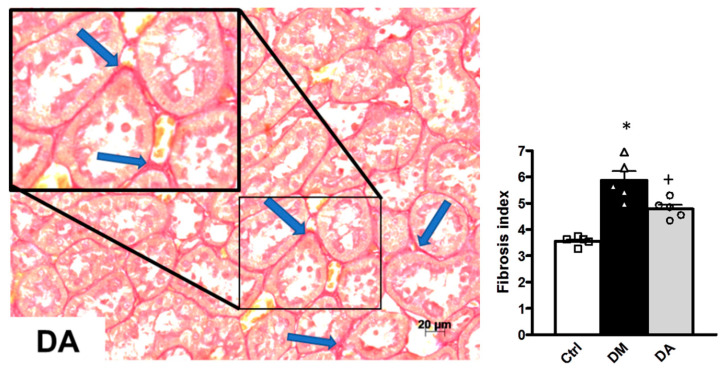
This study aimed to assess the impact of allicin on the course of diabetic nephropathy. Study groups included control, diabetes, and diabetes-treated rats. Allicin treatment (16 mg/kg day/p.o.) started after 1 month of diabetes onset and was administered for 30 days. In the diabetes group, the systolic blood pressure (SBP) increased, also, the oxidative stress and hypoxia in the kidney cortex were evidenced by alterations in the total antioxidant capacity as well as the expression of nuclear factor (erythroid-derived 2)-like 2/Kelch ECH associating protein 1 (Nrf2/Keap1), hypoxia-inducible factor 1-alpha (HIF-1α), vascular endothelial growth factor (VEGF), erythropoietin (Epo) and its receptor (Epo-R). Moreover, diabetes increased nephrin, and kidney injury molecule-1 (KIM-1) expression that correlated with mesangial matrix, the fibrosis index and with the expression of connective tissue growth factor (CTGF), transforming growth factor-β1 (TGF-β1), and α-smooth muscle actin (α-SMA). The insulin levels and glucose transporter protein type-4 (GLUT4) expression were decreased; otherwise, insulin receptor substrates 1 and 2 (IRS-1 and IRS-2) expression was increased. Allicin increased Nrf2 expression and decreased SBP, Keap1, HIF-1α, and VEGF expression. Concurrently, nephrin, KIM-1, the mesangial matrix, fibrosis index, and the fibrotic proteins were decreased. Additionally, allicin decreased hyperglycemia, improved insulin levels, and prevented changes in (GLUT4) and IRSs expression induced by diabetes. In conclusion, our results demonstrate that allicin has the potential to help in the treatment of diabetic nephropathy. The cellular mechanisms underlying its effects mainly rely on the regulation of antioxidant, antifibrotic, and antidiabetic mechanisms, which can contribute towards delay in the progression of renal disease.
Keywords: allicin; diabetes; fibrosis; hypoxia; nephropathy; oxidative stress.
Conflict of interest statement
The authors declare no conflict of interest.
Figures


Similar articles
-
Immunomodulatory Effects of the Nutraceutical Garlic Derivative Allicin in the Progression of Diabetic Nephropathy.Int J Mol Sci. 2018 Oct 11;19(10):3107. doi: 10.3390/ijms19103107. Int J Mol Sci. 2018. PMID: 30314265 Free PMC article.
-
The Beneficial Effects of Allicin in Chronic Kidney Disease Are Comparable to Losartan.Int J Mol Sci. 2017 Sep 16;18(9):1980. doi: 10.3390/ijms18091980. Int J Mol Sci. 2017. PMID: 28926934 Free PMC article.
-
Protective effects of allicin on streptozotocin-induced diabetic nephropathy in rats.J Sci Food Agric. 2017 Mar;97(4):1359-1366. doi: 10.1002/jsfa.7874. Epub 2016 Jul 26. J Sci Food Agric. 2017. PMID: 27363537
-
Diabetic nephropathy: are there new and potentially promising therapies targeting oxygen biology?Kidney Int. 2013 Oct;84(4):693-702. doi: 10.1038/ki.2013.74. Epub 2013 Mar 13. Kidney Int. 2013. PMID: 23486514 Review.
-
Pathogenesis of the podocytopathy and proteinuria in diabetic glomerulopathy.Curr Diabetes Rev. 2008 Feb;4(1):39-45. doi: 10.2174/157339908783502370. Curr Diabetes Rev. 2008. PMID: 18220694 Review.
Cited by
-
Accelerated Senescence and Apoptosis in the Rat Liver during the Progression of Diabetic Complications.Malays J Med Sci. 2022 Dec;29(6):46-59. doi: 10.21315/mjms2022.29.6.5. Epub 2022 Dec 22. Malays J Med Sci. 2022. PMID: 36818894 Free PMC article.
-
Allicin ameliorates sepsis-induced acute kidney injury through Nrf2/HO-1 signaling pathway.J Nat Med. 2024 Jan;78(1):53-67. doi: 10.1007/s11418-023-01745-3. Epub 2023 Sep 5. J Nat Med. 2024. PMID: 37668824 Free PMC article.
-
Antioxidant and anti-inflammatory effects of allicin in the kidney of an experimental model of metabolic syndrome.PeerJ. 2023 Sep 27;11:e16132. doi: 10.7717/peerj.16132. eCollection 2023. PeerJ. 2023. PMID: 37786577 Free PMC article.
-
Thiosulfinate-Enriched Allium sativum Extract Exhibits Differential Effects between Healthy and Sepsis Patients: The Implication of HIF-1α.Int J Mol Sci. 2023 Mar 25;24(7):6234. doi: 10.3390/ijms24076234. Int J Mol Sci. 2023. PMID: 37047205 Free PMC article.
-
Mecanismos moleculares de los efectos benéficos de la alicina sobre la enfermedad cardiovascular.Arch Cardiol Mex. 2022;92(3):362-370. doi: 10.24875/ACM.21000196. Arch Cardiol Mex. 2022. PMID: 35772125 Free PMC article. Review. English.
References
-
- Yusuf S., Hawken S., Ounpuu S., Dans T., Avezum A., Lanas F., McQueen M., Budaj A., Pais P., Varigos J. Effect of potentially modifiable risk factors associated with myocardial infarction in 52 countries (the INTERHEART study): Case-control study. Lancet. 2004;364:937–952. doi: 10.1016/S0140-6736(04)17018-9. - DOI - PubMed
-
- Medina-Urrutia A.X., Martínez-Sánchez F.D., Posadas-Romero C., Jorge-Galarza E., Martínez-Alvarado M., González-Salazar M., Osorio-Alonso H., Juárez-Rojas J.G. Metabolic control achievement in a population with premature coronary artery disease: Results of the genetics of atherosclerotic disease study. Ther. Adv. Endocrinol. Metab. 2020;11 doi: 10.1177/2042018820943374. - DOI - PMC - PubMed
LinkOut - more resources
Full Text Sources
Research Materials
Miscellaneous
