. 2020 Nov 15;21(22):8607.
doi: 10.3390/ijms21228607.

Histological Evaluation and Gene Expression Profiling of Autophagy-Related Genes for Cartilage of Young and Senescent Rats

Affiliations

Histological Evaluation and Gene Expression Profiling of Autophagy-Related Genes for Cartilage of Young and Senescent Rats

Consuelo Arias et al. Int J Mol Sci. .

Abstract

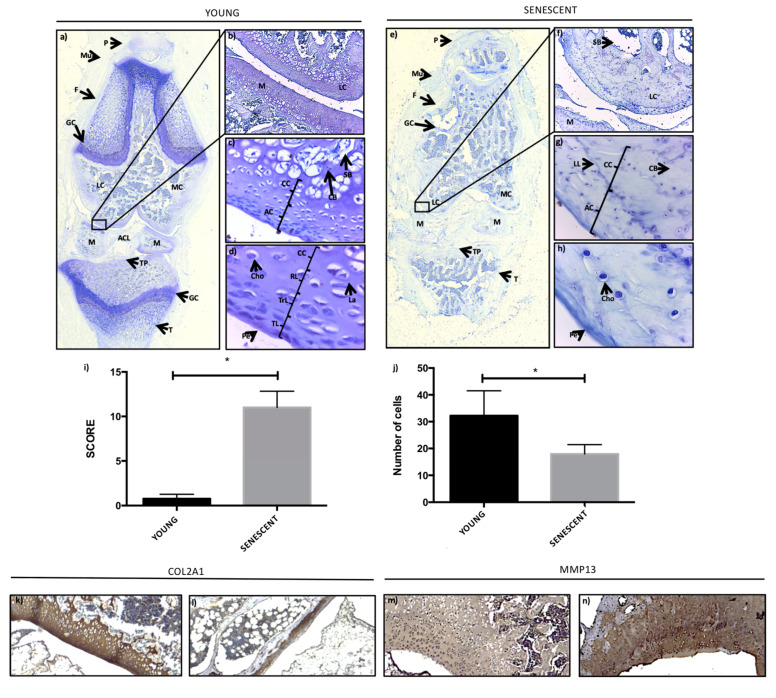
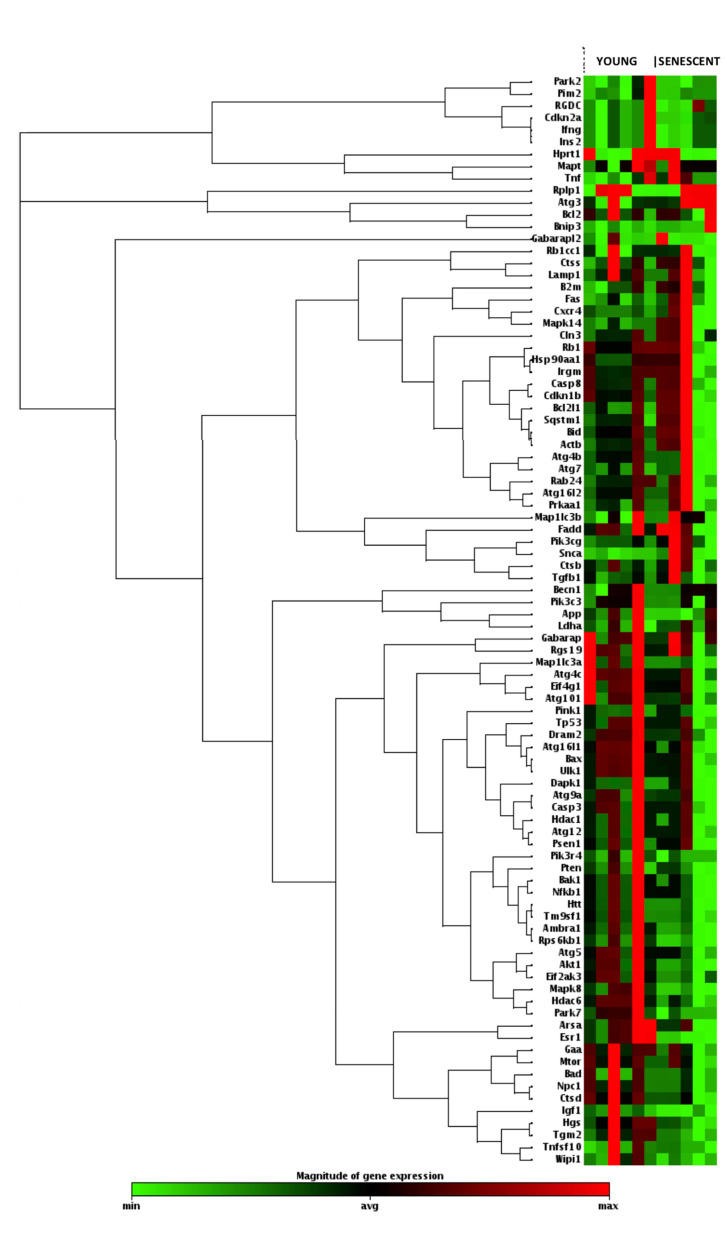
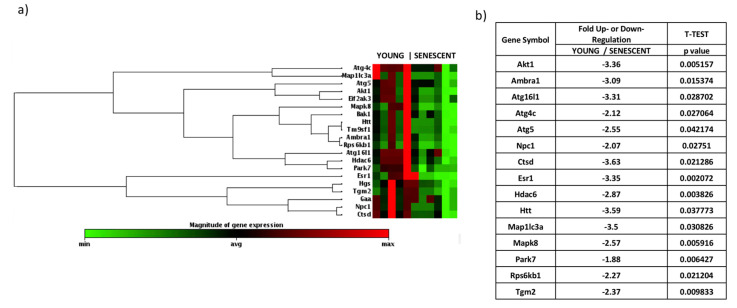
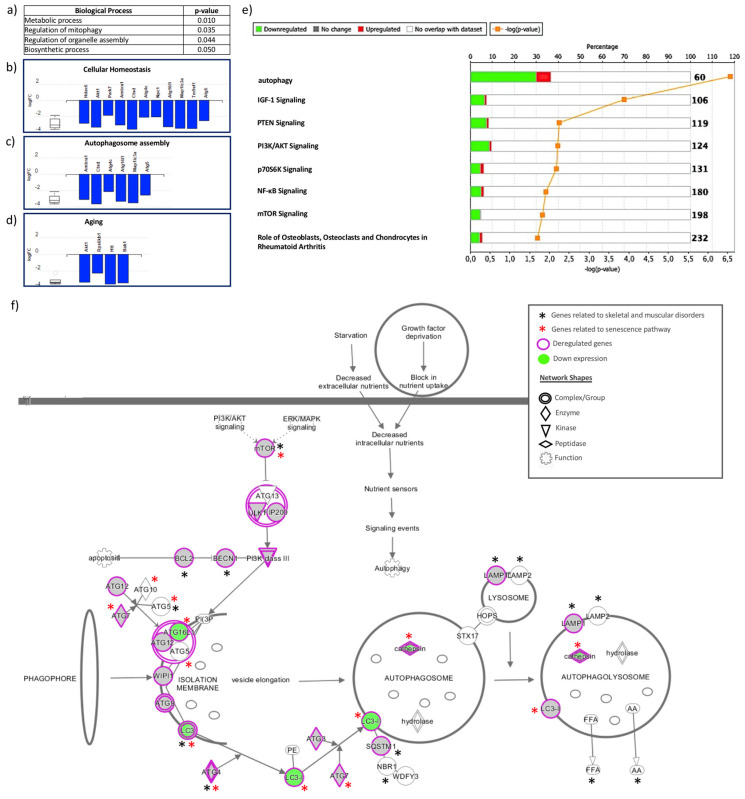
Autophagy is a cellular mechanism that protects cells from stress by digesting non-functional cellular components. In the cartilage, chondrocytes depend on autophagy as a principal mechanism to maintain cellular homeostasis. This protective role diminishes prior to the structural damage that normally occurs during aging. Considering that aging is the main risk factor for osteoarthritis, evaluating the expression of genes associated with autophagy in senescent cartilage might allow for the identification of potential therapeutic targets for treatment. Thus, we studied two groups of young and senescent rats. A histological analysis of cartilage and gene expression quantification for autophagy-related genes were performed. In aged cartilage, morphological changes were observed, such as an increase in cartilage degeneration as measured by the modified Mankin score, a decrease in the number of chondrocytes and collagen II (Col2a1), and an increase in matrix metalloproteinase 13 (Mmp13). Moreover, 84 genes associated with autophagy were evaluated by a PCR array analysis, and 15 of them were found to be significantly decreased with aging. Furthermore, an in silico analysis based on by two different bioinformatics software tools revealed that several processes including cellular homeostasis, autophagosome assembly, and aging-as well as several biological pathways such as autophagy, insulin-like growth factor 1 (IGF-1) signaling, PI3K (phosphoinositide 3-kinase)/AKT (serine/threonine kinase) signaling, and mammalian target of rapamycin (mTOR) signaling-were enriched. In conclusion, the analysis identified some potential targets for osteoarthritis treatment that would allow for the development of new therapeutic strategies for this chronic disease.

Keywords: aging; autophagy; osteoarthritis.


Conflict of interest statement

The authors declare no conflict of interest.

Figures

Figure 1
Figure 1
Histopathological comparisons of young and senescent rat knees: (a,e) Young and senescent rat knees, respectively. P: patella; Mu: muscle; F: femur; GC: growth cartilage; LC: lateral condyle; M: medial condyle; M: meniscus; ACL: anterior cruciate ligament; TP: tibial plateau; and T: Tibial. (bd,fh) Articular cartilage of young and senescent rat knees; respectively. Cho: chondrocytes; SB: spongy bone; CB: compact bone; AC: articular cartilage; CC: calcified cartilage; RL: radial layer; TrL: transitional layer; TL: tangential layer; and Pe: perichondrium. (a,e) The images were obtained with a Stereo Zoom Microscope Leica S6D 0.63×. (b,f) 15×; (c,g) 40×; (d,h) 100× and (kn) 15× images were obtained with a Leica DM 2000 LED microscope and a digital camera (Leica MC 170 HD). (i) Modified Mankin Score. * p < 0.05. (j) Quantification of the number of chondrocytes in both groups, p < 0.05. (km) Immunohistochemistry of collagen II (Col2a1) and metalloproteinase 13 (Mmp13) in the young and senescent groups, respectively.
Figure 2
Figure 2
Heatmap of gene expressions and unsupervised hierarchical cluster analysis for genes of the autophagy pathway comparing young rats (3 weeks, N = 6) and senescent rats (25 months, N = 5). All data were normalized to the best housekeeping genes. Green = downregulated; red = upregulated. Magnitude of log2 (fold change): from −1.84 to 1.84.
Figure 3
Figure 3
Differentially expressed genes of the autophagy pathway comparing the young knee and senescent knee groups. (a) Heatmap of gene expressions and unsupervised hierarchical cluster analysis for genes of the autophagy pathway comparing young rats (3 weeks, N = 6) and senescent rats (25 months, N = 5). The values are expressed in log2. All data were normalized to the best housekeeping genes. Green = downregulated; red = upregulated. Magnitude of log2 (fold change): from −1.84 to 1.84. (b) Fold changes of differentially expressed genes. Gene expression was evaluated using the ∆∆CT method, considering a fold change of >1.5 and Student’s t-test with a p-value < 0.05 as criteria. Negative values indicate downregulation, and positive values indicate upregulation. Akt1: V-akt murine thymoma viral oncogene homolog 1; Ambra1: Autophagy/beclin 1 regulator 1; Atg16l1: ATG16 autophagy related 16-like 1 (S. cerevisiae); Atg4c: ATG4 autophagy-related 4 homolog C (S. cerevisiae); Atg5: autophagy-related 5 homolog (S. cerevisiae); Npc1: Cdig2 protein; Ctsd: cathepsin D; Esr1: estrogen receptor 1; Hdac6: histone deacetylase 6; Htt: huntingtin; Map1lc3a: microtubule-associated protein 1 light chain 3 alpha; Mapk8: mitogen-activated protein kinase 8; Park7: Parkinson’s disease (autosomal recessive, early onset) 7; Rps6kb1: ribosomal protein S6 kinase, polypeptide 1; Tgm2: Transglutaminase 2, C polypeptide. p-values were calculated on the bases of Student’s t-test of replicate values of 2^ (-delta CT) for each gene for the senescent and young groups.
Figure 4
Figure 4
Bioinformatics analysis of biological process terms and pathways among genes related to autophagy in order to explore the biological relevance of the deregulated genes. (a,d) Bioinformatics analysis with Advaita Bio’s iPathwayGuide. (a) Table for biological process terms that are significantly associated with deregulated genes. (bd) Molecules and their respective fold changes involved in the processes of cellular homeostasis, autophagosome assembly, and aging, respectively. (e,f) Bioinformatics analysis with Ingenuity Pathway Analysis. (e) Pathways and diseases associated with differentially expressed genes. (f) Autophagy pathway, deregulated genes, and overlap with skeletal and muscular disorder and senescence. One of the general ways to activate autophagy begins with growth factor deprivation that blocks the nutrient uptake, and another is starvation that decreases the extracellular nutrients; both stimuli decrease the intracellular nutrients, activate nutrient sensors, and generate signaling events that empower autophagy. The detailed processes are illustrated. The upstream pathways are PI3K (phosphoinositide 3-kinase)/AKT (serine/threonine kinase) signaling and ERK/MAPK signaling, respectively, which are able to regulate mammalian target of rapamycin (mTOR) signaling, a key factor for autophagy. In general, autophagy consists of a series of dynamic membrane rearrangements mediated by a group of proteins related to ATG, where Atg1 (ULK1), Atg6 (Beclin1), Atg8 (LC3), and Atg5 are the 4 major regulators of the autophagy pathway. First, cytoplasmic sequestration is generated within double membrane vesicles called autophagosomes. Subsequently, these vesicles are fused with the lysosome to generate autolysosomes, which leads to the degradation of the cargo. It is important to highlight the association among autophagy, skeletal and muscular disorders, and senescence. The genes involved in skeletal and muscular disorders are shown with the black asterisks, and the genes related to senescence are shown with red asterisks.

References

    1. Mizushima N., Komatsu M. Autophagy: Renovation of cells and tissues. Cell. 2011;147:728–741. doi: 10.1016/j.cell.2011.10.026. - DOI - PubMed
    1. Blaney Davidson E.N., van Caam A.P., van der Kraan P.M. Osteoarthritis year in review 2016: Biology. Osteoarthr. Cartil. 2017;25:175–180. doi: 10.1016/j.joca.2016.09.024. - DOI - PubMed
    1. Carames B., Kiosses W.B., Akasaki Y., Brinson D.C., Eap W., Koziol J., Lotz M.K. Glucosamine activates autophagy in vitro and in vivo. Arthritis Rheum. 2013;65:1843–1852. doi: 10.1002/art.37977. - DOI - PMC - PubMed
    1. Jing Z., Han W., Sui X., Xie J., Pan H. Interaction of autophagy with microRNAs and their potential therapeutic implications in human cancers. Cancer Lett. 2015;356:332–338. doi: 10.1016/j.canlet.2014.09.039. - DOI - PubMed
    1. Nabavi S.F., Sureda A., Dehpour A.R., Shirooie S., Silva A.S., Devi K.P., Ahmed T., Ishaq N., Hashim R., Sobarzo-Sanchez E., et al. Regulation of autophagy by polyphenols: Paving the road for treatment of neurodegeneration. Biotechnol. Adv. 2018;36:1768–1778. doi: 10.1016/j.biotechadv.2017.12.001. - DOI - PubMed

Publication types